Case Study: Nestle - Industry Analysis, Business Model, and Strategy
VerifiedAdded on 2022/06/14
|21
|6166
|339
Case Study
AI Summary
This case study provides a comprehensive analysis of Nestle, a Swiss multinational food and beverage company. It begins with an introduction and a historical overview, tracing Nestle's evolution from its inception in 1866 to its current global presence with over 2,000 brands. The study then delves into an industry analysis, examining the challenges and sales evolution of the food and beverage sector, including a SWOT analysis and competitor landscape. The business model is explored, covering Nestle's mission, distinctive factors, corporate governance, and corporate social responsibility, along with product segmentation. The case study includes financial statements (balance sheet, income statement, and cash flow statement) and relevant financial ratios. Finally, the study addresses specific questions related to Nestle's performance and concludes with a bibliography and annexes containing key financial data.
CASE STUDY OF NESTLÉ1
INDEX
PART A
1. Introduction 3
2. History 3
3. Industry Analysis and Competitors 5
3.1 Challenges of the food and beverage industry 6
3.2 Sales evolution of the industry 6
3.3 Qualitative Analysis: SWOT industry 8
3.4 Main competitors 9
3.5 Market Share 9
4. Business Model 10
4.1 Mission 10
4.2 Distinctive Factors 10
4.3 Corporate Governance 11
4.4 Corporate Social Responsibility 11
4.5 Segmentation of products 13
5. Questions 13
6. Bibliography 13
7. Notes 14
1 Case written by Clara Aguilar, Cristina Hey, Laura Plaza and Sara Zayas and supervised by Oriol
Amat, BSM Universitat Pompeu Fabra, 2018
Paraphrase This Document
Need a fresh take? Get an instant paraphrase of this document with our AI Paraphraser
8. Annex 14
8.1 Balance Sheet 14
8.2 Income Statement 17
8.3 Cash Flow Statement 18
8.4 Ratios 20
PART B
1. Answer to the Questions Raised 22
2
8.1 Balance Sheet 14
8.2 Income Statement 17
8.3 Cash Flow Statement 18
8.4 Ratios 20
PART B
1. Answer to the Questions Raised 22
2
PART A
1. INTRODUCTION
“Nestlé” is a Swiss multinational food and beverage company whose business started in 1866.
It is one of the largest food companies in the world, with presence in 191 countries, and more
than 2,000 brands. Some of these are globally iconic while others are just regional, presenting
a great variety of products, such as tea, coffee, bottled water, medical and baby food, breakfast
cereals, and lots more. It is a well-known company world-wide, specially because of Nestlé
milk chocolate bar, which is one of the most famous products.
The company focuses on the production and supply of great quality and healthy food products.
Nestle has a huge portfolio and is seen as an enormous competitor across the food industries.
Nevertheless, although nowadays their revenues keep increasing, its growth rate is decreasing.
In this case study, we will focus on the food industry where the majority of Nestlé products are
present. The following information about the history and context of this company will be based
on the data from Nestlé’s web page (“The Nestlé Company History, Nestlé”).
2. HISTORY
It all started in 1867 when a German pharmacist named Henri Nestlé launched his “farine
lactée”, a breakthrough infant food to deal with high mortality rates among the infants who
cannot be breastfed. In 1875, he sold the firm to 3 businessmen who helped expand production
and sales. Later on, the firm merged (1905) with their rival, the Anglo-Swiss Milk company,
with whom they competed by selling rival versions of the other’s original products. Once these
two big companies became one, they lived a period of prosperity (1905-1913), and just before
the World War I, they became a global dairy company, with more than 20 factories around all
continents. Once the WW1 broke, the industry was able to survive thanks to their condensed
milk, which became really popular in the armed force, as it lasted for long and it was easy to
transport. Moreover, this demand prevailed after the war from warring nations. At the end of
the decade, they already had 40 factories
The company was rocked by the Wall Street Crash in 1929 after being recovered of a declined
demand for canned milk which led to falling prices. During this period and after all the
difficulties, the power was centralized, and they consolidated their research only at one
laboratory.
World War II affected every market. To protect the company, Nestlé & Anglo-Swiss relocated
some managers to a new office in Stamford (USA). To fight the war, the firm started supplying
and expanding to Africa, Asia, Australia and Latin America. Later on, due to the entering of
the US into the war, Nestlé rapidly gained popularity among the American population, and
3
⊘ This is a preview!⊘
Do you want full access?
Subscribe today to unlock all pages.
Trusted by 1+ million students worldwide
even though the war slowed down Nescafé sales, when the war ended the product was included
in aid supplies in Japan and Europe.
In 1947, they merged with Alimentana (Maggi Soups) and they renamed the company to Nestlé
Alimentana. The merger meant the growth of new segments for the company, such as the
launch of more canned and prepared foods.
The post-war was marked by a diversification in the production. Firstly, as people started
spending money on machines such as freezers, Nestlé started launching new products like ready
meals, canned foods and also, they acquired firms related to coffee and milk.
In 1977, the firm was renamed Nestlé S.A. They continued with their strategy of diversification.
However, during that period the company was criticized because of the declining breast-
feeding rate, so people started boycotting its products believing that their baby food was one
of the causes.
The 80s and 90s decade were of growth. They had a new ambition they named “Nutrition,
Health and Wellness” and for achieving it they disposed of unprofitable brands just to satisfy
the health-conscious consumers. They targeted a global leadership in water, ice cream and
animal food. Moreover, Nestlé was one of the first companies to develop breast-milk
substitutes.
Finally, during these last years, Nestlé articulated its Creating Shared Value approach to
business and launches different plans to further develop sustainable supply chains such as in
coffee. Its position in traditional segments gets stronger and they also focus on medical
nutrition in order to make this segment stronger too.
In the following table (Figure 1), it can be appreciated the most important launches and
acquisition of Nestlé since 1866, ordered chronologically.
MOST IMPORTANT LAUNCHES AND ACQUISITIONS
1937 Nescafé was launched (powder extract of pure coffee that could be prepared with hot water).
1947 Merged with Alimentana (firm that created the Maggi Soups).
1948 Nestea (a soluble tea) was launched. Nesquik was launched this year too and it was a top seller in the
United States. Moreover, canned raviolis were launched under Maggi brand.
1977 Minority shareholder with L’Oréal.
1985 Carnation and Coffee-Mate are acquired by Nestlé.
1986 Nespresso story started.
1998 Nestlé bought mineral waters business Sanpellegrino group.
4
Paraphrase This Document
Need a fresh take? Get an instant paraphrase of this document with our AI Paraphraser
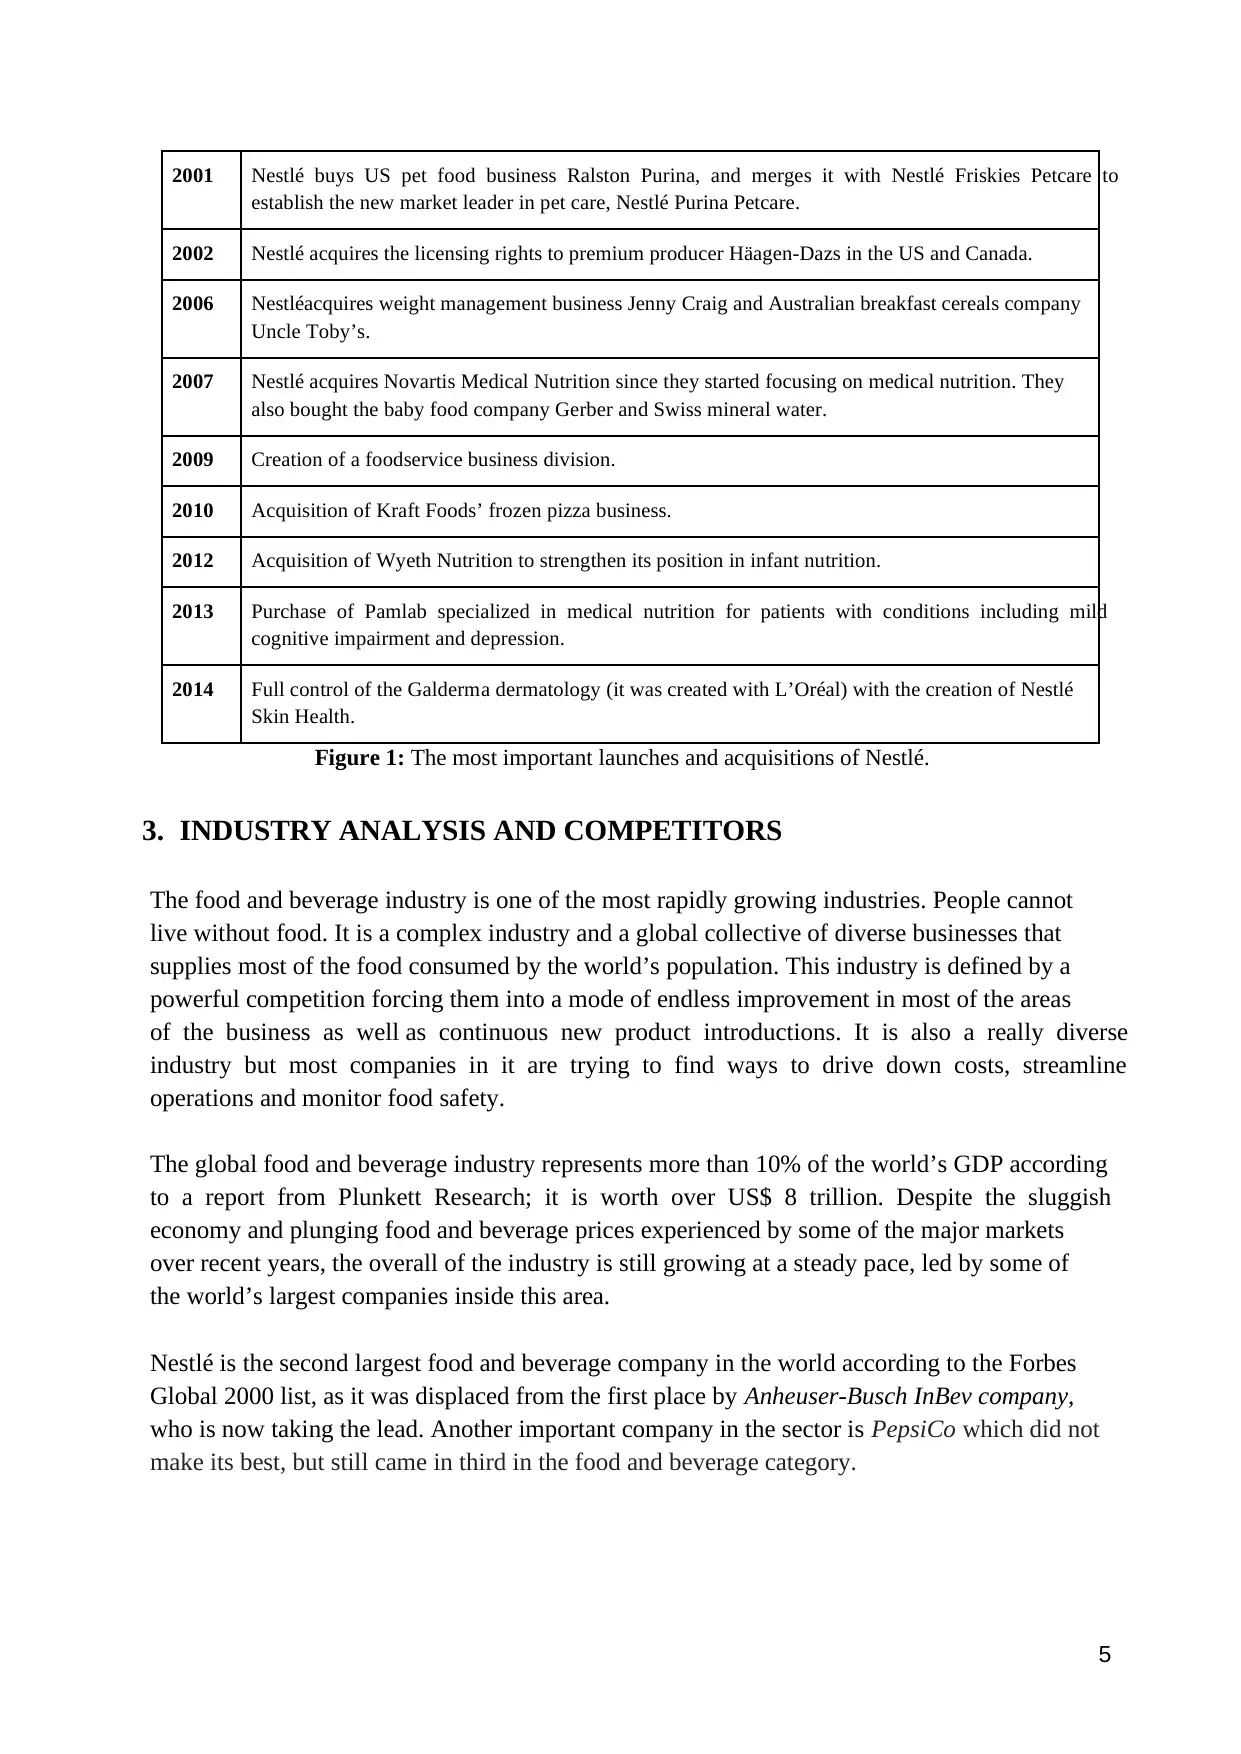
2001 Nestlé buys US pet food business Ralston Purina, and merges it with Nestlé Friskies Petcare to
establish the new market leader in pet care, Nestlé Purina Petcare.
2002 Nestlé acquires the licensing rights to premium producer Häagen-Dazs in the US and Canada.
2006 Nestléacquires weight management business Jenny Craig and Australian breakfast cereals company
Uncle Toby’s.
2007 Nestlé acquires Novartis Medical Nutrition since they started focusing on medical nutrition. They
also bought the baby food company Gerber and Swiss mineral water.
2009 Creation of a foodservice business division.
2010 Acquisition of Kraft Foods’ frozen pizza business.
2012 Acquisition of Wyeth Nutrition to strengthen its position in infant nutrition.
2013 Purchase of Pamlab specialized in medical nutrition for patients with conditions including mild
cognitive impairment and depression.
2014 Full control of the Galderma dermatology (it was created with L’Oréal) with the creation of Nestlé
Skin Health.
Figure 1: The most important launches and acquisitions of Nestlé.
3. INDUSTRY ANALYSIS AND COMPETITORS
The food and beverage industry is one of the most rapidly growing industries. People cannot
live without food. It is a complex industry and a global collective of diverse businesses that
supplies most of the food consumed by the world’s population. This industry is defined by a
powerful competition forcing them into a mode of endless improvement in most of the areas
of the business as well as continuous new product introductions. It is also a really diverse
industry but most companies in it are trying to find ways to drive down costs, streamline
operations and monitor food safety.
The global food and beverage industry represents more than 10% of the world’s GDP according
to a report from Plunkett Research; it is worth over US$ 8 trillion. Despite the sluggish
economy and plunging food and beverage prices experienced by some of the major markets
over recent years, the overall of the industry is still growing at a steady pace, led by some of
the world’s largest companies inside this area.
Nestlé is the second largest food and beverage company in the world according to the Forbes
Global 2000 list, as it was displaced from the first place by Anheuser-Busch InBev company,
who is now taking the lead. Another important company in the sector is PepsiCo which did not
make its best, but still came in third in the food and beverage category.
5
3.1. CHALLENGES OF THE FOOD AND BEVERAGE INDUSTRY
The industry has experienced massive changes over the last decade owing to increasing
consumer demand and industry innovation. Driven by the changing in global trends, this
industry has some challenges to face.
People nowadays are more nutrition-friendly, they prefer fat-free products, and are generally
more inclined towards maintaining robust health. This means that products are not only judged
based on quality, but also by the nutritional content. Some of the other challenges are the raw
material quality or product traceability.
Regarding these challenges, Nestlé is also concerned on how to develop new eye-catching
products, and improving the quality of their goods, and consequently building a better and
stronger reputation. Concerning of what was previously mentioned, the final business model
of Nestlé will focus on how to reblossom the firm again.
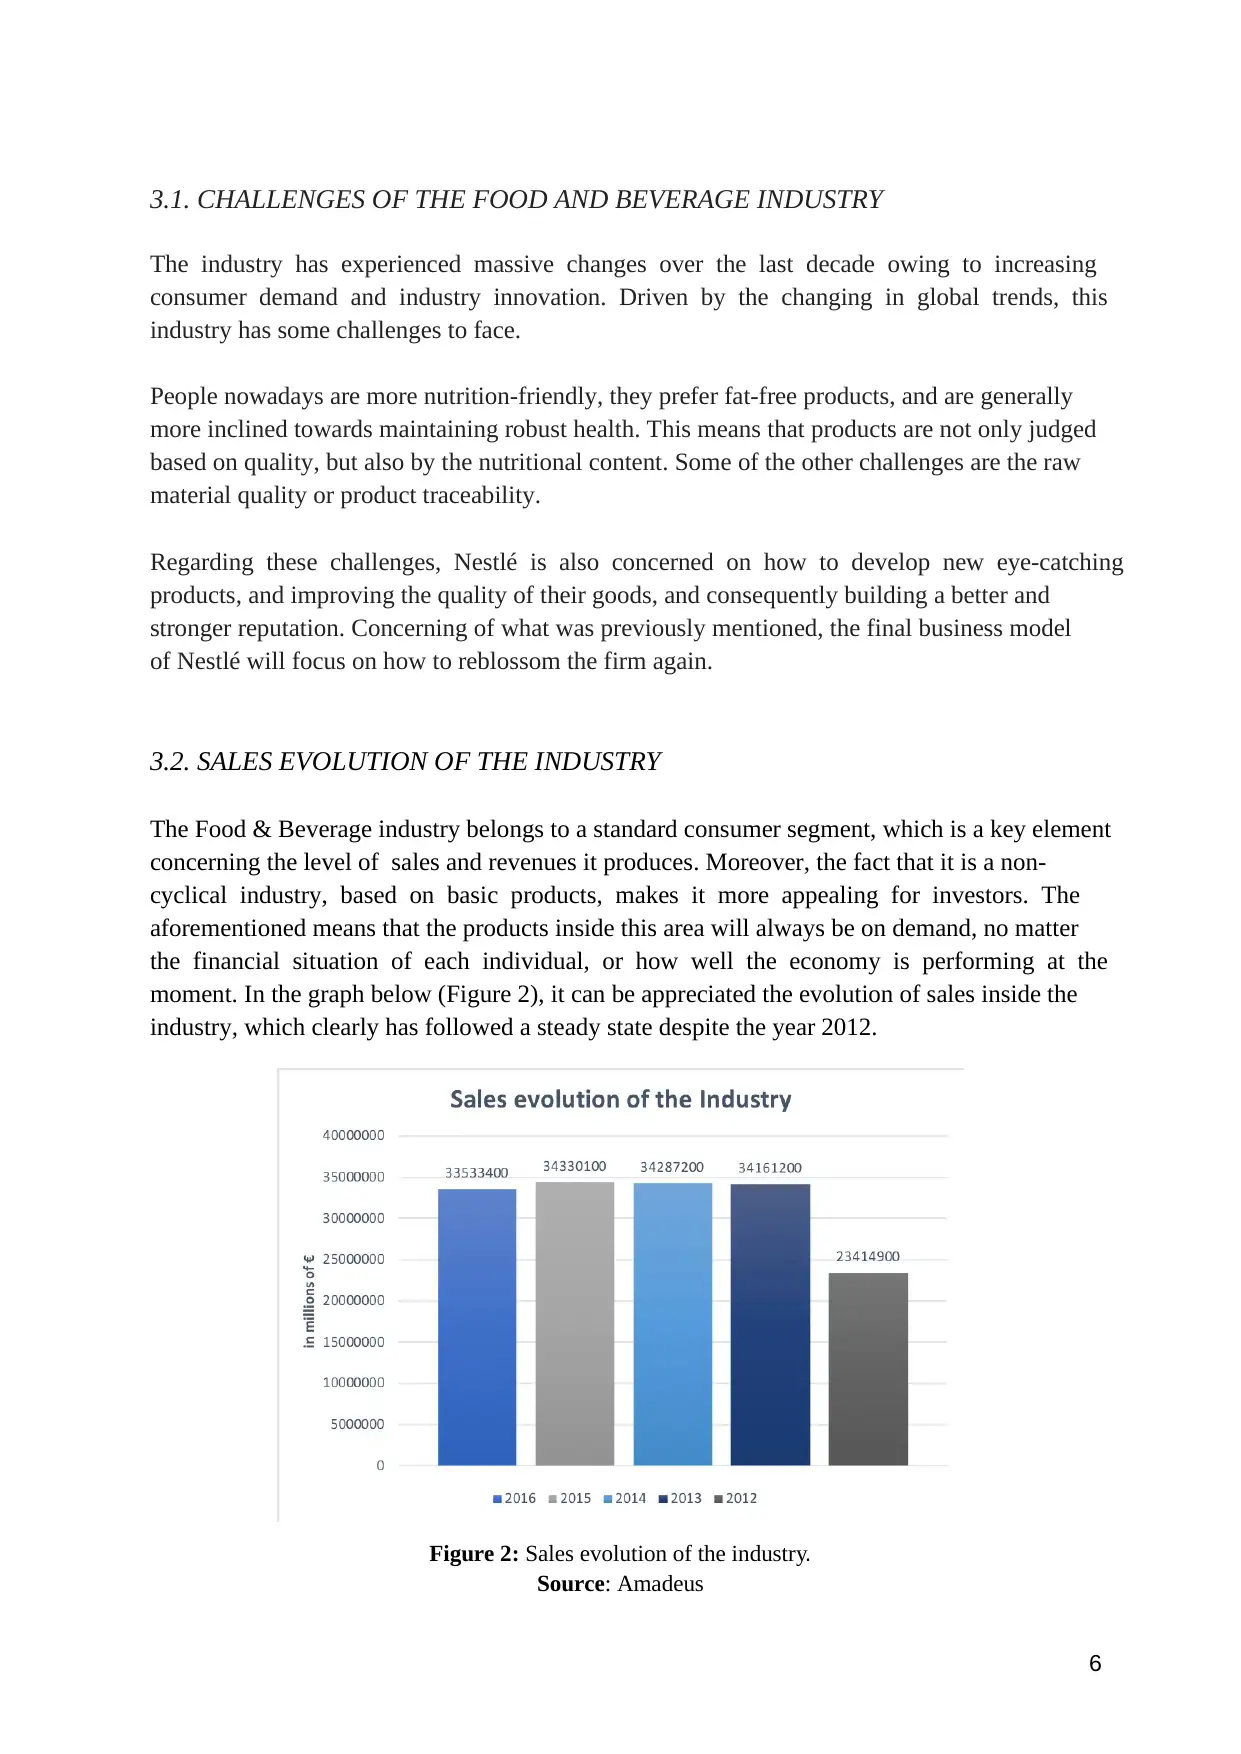
3.2. SALES EVOLUTION OF THE INDUSTRY
The Food & Beverage industry belongs to a standard consumer segment, which is a key element
concerning the level of sales and revenues it produces. Moreover, the fact that it is a non-
cyclical industry, based on basic products, makes it more appealing for investors. The
aforementioned means that the products inside this area will always be on demand, no matter
the financial situation of each individual, or how well the economy is performing at the
moment. In the graph below (Figure 2), it can be appreciated the evolution of sales inside the
industry, which clearly has followed a steady state despite the year 2012.
Figure 2: Sales evolution of the industry.
Source: Amadeus
6
The industry has experienced massive changes over the last decade owing to increasing
consumer demand and industry innovation. Driven by the changing in global trends, this
industry has some challenges to face.
People nowadays are more nutrition-friendly, they prefer fat-free products, and are generally
more inclined towards maintaining robust health. This means that products are not only judged
based on quality, but also by the nutritional content. Some of the other challenges are the raw
material quality or product traceability.
Regarding these challenges, Nestlé is also concerned on how to develop new eye-catching
products, and improving the quality of their goods, and consequently building a better and
stronger reputation. Concerning of what was previously mentioned, the final business model
of Nestlé will focus on how to reblossom the firm again.
3.2. SALES EVOLUTION OF THE INDUSTRY
The Food & Beverage industry belongs to a standard consumer segment, which is a key element
concerning the level of sales and revenues it produces. Moreover, the fact that it is a non-
cyclical industry, based on basic products, makes it more appealing for investors. The
aforementioned means that the products inside this area will always be on demand, no matter
the financial situation of each individual, or how well the economy is performing at the
moment. In the graph below (Figure 2), it can be appreciated the evolution of sales inside the
industry, which clearly has followed a steady state despite the year 2012.
Figure 2: Sales evolution of the industry.
Source: Amadeus
6
⊘ This is a preview!⊘
Do you want full access?
Subscribe today to unlock all pages.
Trusted by 1+ million students worldwide
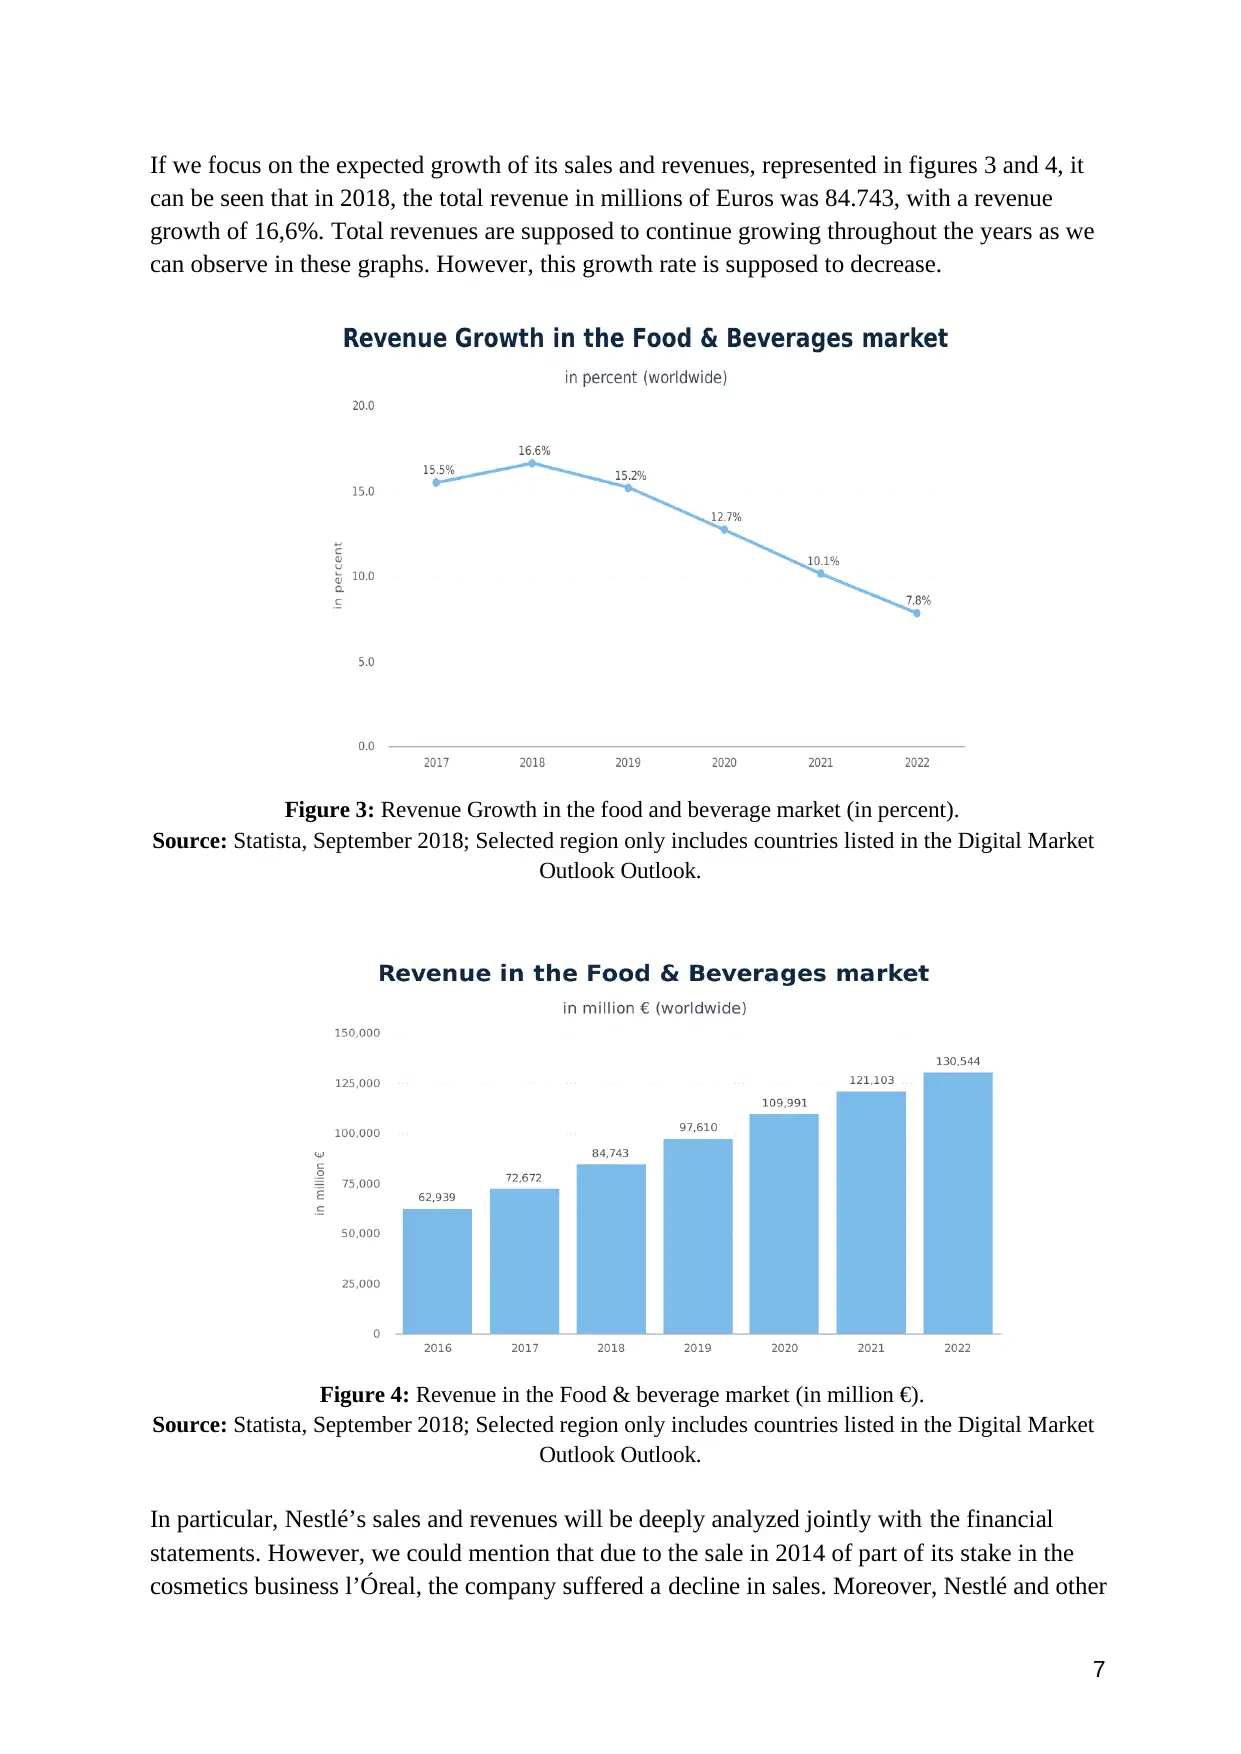
If we focus on the expected growth of its sales and revenues, represented in figures 3 and 4, it
can be seen that in 2018, the total revenue in millions of Euros was 84.743, with a revenue
growth of 16,6%. Total revenues are supposed to continue growing throughout the years as we
can observe in these graphs. However, this growth rate is supposed to decrease.
Figure 3: Revenue Growth in the food and beverage market (in percent).
Source: Statista, September 2018; Selected region only includes countries listed in the Digital Market
Outlook Outlook.
Figure 4: Revenue in the Food & beverage market (in million €).
Source: Statista, September 2018; Selected region only includes countries listed in the Digital Market
Outlook Outlook.
In particular, Nestlé’s sales and revenues will be deeply analyzed jointly with the financial
statements. However, we could mention that due to the sale in 2014 of part of its stake in the
cosmetics business l’Óreal, the company suffered a decline in sales. Moreover, Nestlé and other
7
Paraphrase This Document
Need a fresh take? Get an instant paraphrase of this document with our AI Paraphraser
companies of the sector are facing “a difficult environment since profit margins are under
pressure as companies are not able to raise prices, while productivity is edging lower” (Koen
De Leus, senior economist at KBC in Brussels).
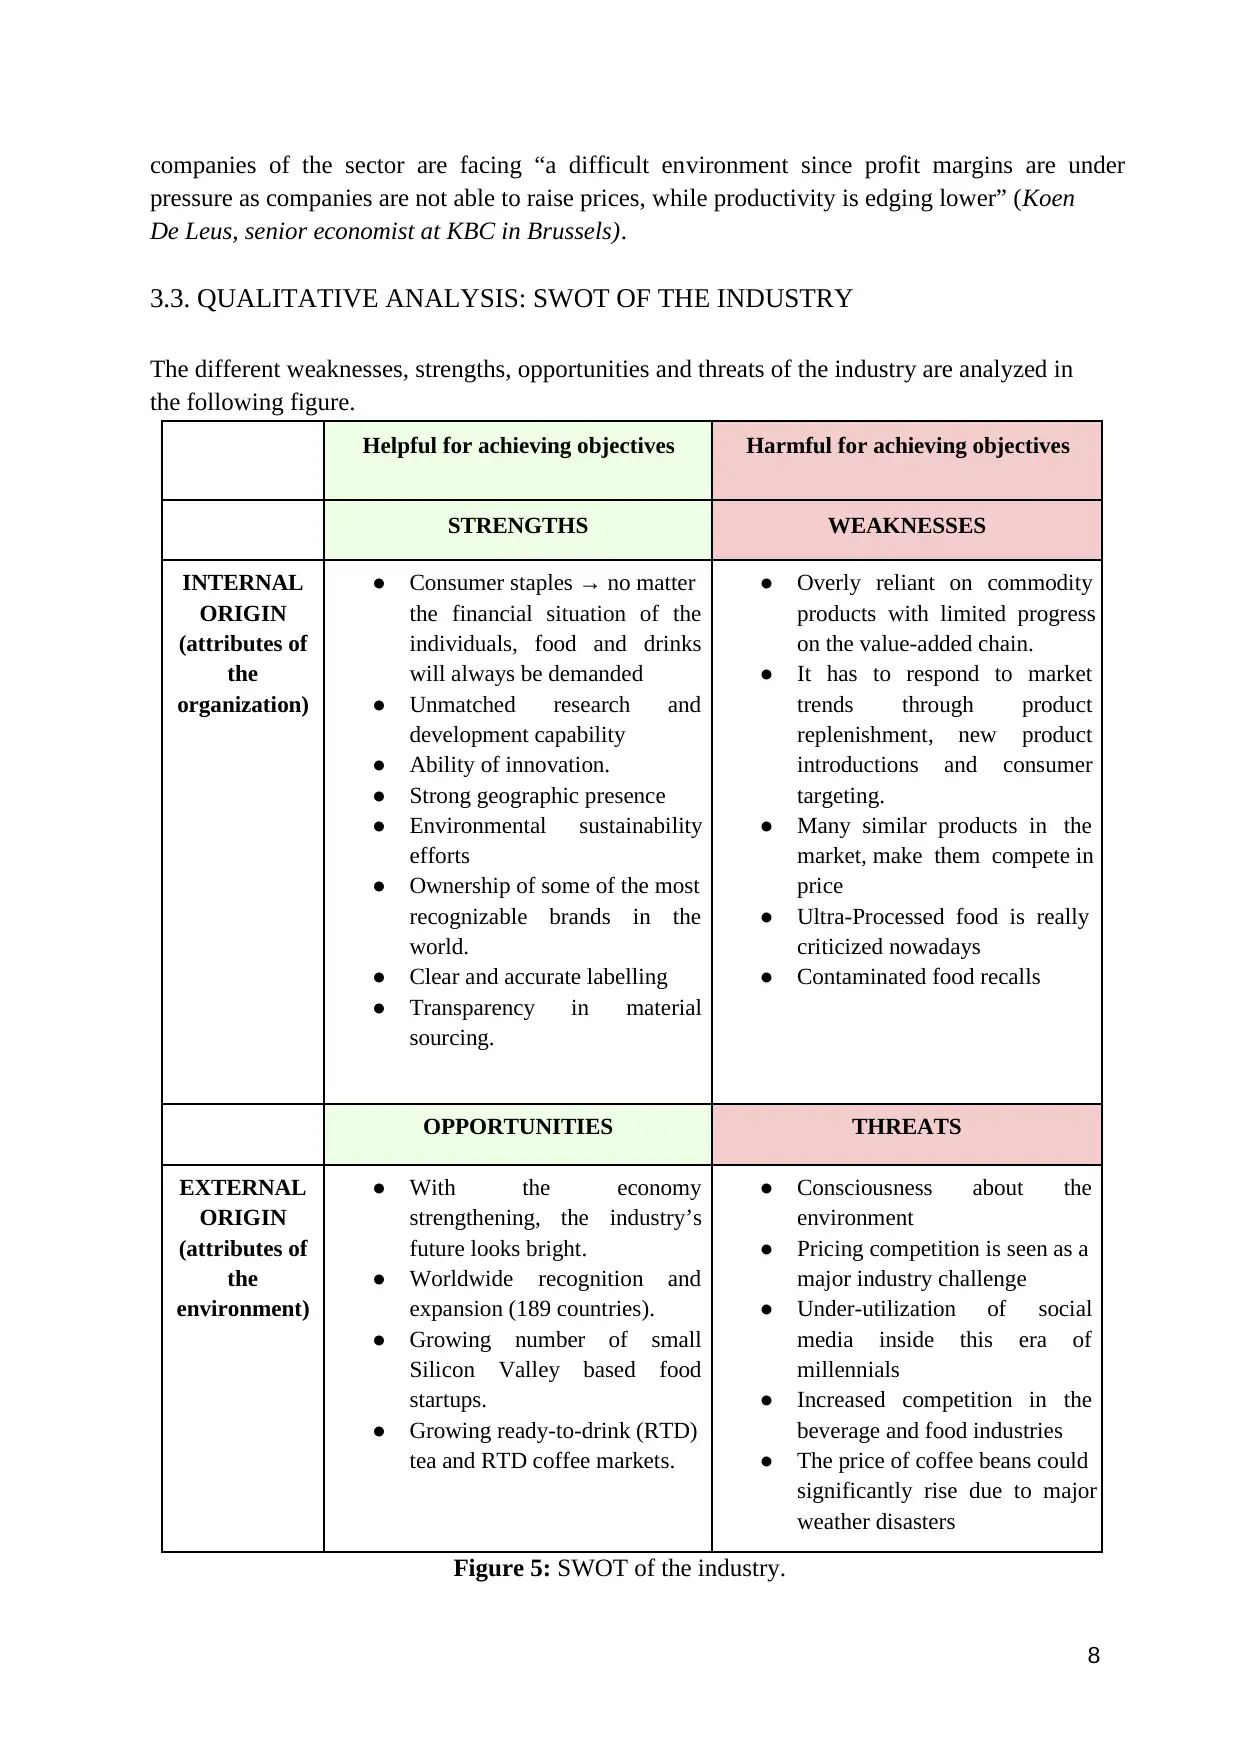
3.3. QUALITATIVE ANALYSIS: SWOT OF THE INDUSTRY
The different weaknesses, strengths, opportunities and threats of the industry are analyzed in
the following figure.
Helpful for achieving objectives Harmful for achieving objectives
STRENGTHS WEAKNESSES
INTERNAL
ORIGIN
(attributes of
the
organization)
● Consumer staples → no matter
the financial situation of the
individuals, food and drinks
will always be demanded
● Unmatched research and
development capability
● Ability of innovation.
● Strong geographic presence
● Environmental sustainability
efforts
● Ownership of some of the most
recognizable brands in the
world.
● Clear and accurate labelling
● Transparency in material
sourcing.
● Overly reliant on commodity
products with limited progress
on the value-added chain.
● It has to respond to market
trends through product
replenishment, new product
introductions and consumer
targeting.
● Many similar products in the
market, make them compete in
price
● Ultra-Processed food is really
criticized nowadays
● Contaminated food recalls
OPPORTUNITIES THREATS
EXTERNAL
ORIGIN
(attributes of
the
environment)
● With the economy
strengthening, the industry’s
future looks bright.
● Worldwide recognition and
expansion (189 countries).
● Growing number of small
Silicon Valley based food
startups.
● Growing ready-to-drink (RTD)
tea and RTD coffee markets.
● Consciousness about the
environment
● Pricing competition is seen as a
major industry challenge
● Under-utilization of social
media inside this era of
millennials
● Increased competition in the
beverage and food industries
● The price of coffee beans could
significantly rise due to major
weather disasters
Figure 5: SWOT of the industry.
8
pressure as companies are not able to raise prices, while productivity is edging lower” (Koen
De Leus, senior economist at KBC in Brussels).
3.3. QUALITATIVE ANALYSIS: SWOT OF THE INDUSTRY
The different weaknesses, strengths, opportunities and threats of the industry are analyzed in
the following figure.
Helpful for achieving objectives Harmful for achieving objectives
STRENGTHS WEAKNESSES
INTERNAL
ORIGIN
(attributes of
the
organization)
● Consumer staples → no matter
the financial situation of the
individuals, food and drinks
will always be demanded
● Unmatched research and
development capability
● Ability of innovation.
● Strong geographic presence
● Environmental sustainability
efforts
● Ownership of some of the most
recognizable brands in the
world.
● Clear and accurate labelling
● Transparency in material
sourcing.
● Overly reliant on commodity
products with limited progress
on the value-added chain.
● It has to respond to market
trends through product
replenishment, new product
introductions and consumer
targeting.
● Many similar products in the
market, make them compete in
price
● Ultra-Processed food is really
criticized nowadays
● Contaminated food recalls
OPPORTUNITIES THREATS
EXTERNAL
ORIGIN
(attributes of
the
environment)
● With the economy
strengthening, the industry’s
future looks bright.
● Worldwide recognition and
expansion (189 countries).
● Growing number of small
Silicon Valley based food
startups.
● Growing ready-to-drink (RTD)
tea and RTD coffee markets.
● Consciousness about the
environment
● Pricing competition is seen as a
major industry challenge
● Under-utilization of social
media inside this era of
millennials
● Increased competition in the
beverage and food industries
● The price of coffee beans could
significantly rise due to major
weather disasters
Figure 5: SWOT of the industry.
8
3.4 MAIN COMPETITORS
Nestlé operates in a lot of different markets and therefore it has several important competitors.
There are companies with a very diversified portfolio that represent an important competition
for Nestlé, but there are also more specialized companies that compete with it.
We have chosen five of these companies basing our decision on several ratings and reports.
We will study, as we have stated before, the food and beverage industry, basically the chocolate
market. The five companies we will base our analysis on since they are the main five
competitors of Nestlé are: Danone, Mondelez, Unilever, Mars and Pladis.
The production of Danone focuses on the production and sale of healthy and delicious food
that is custom-made for the requirements of people of all ages. Mondelez produces various
products like chocolate, cookies, and confectionary. Unilever is a consumer goods producer
company and their products include food and beverage. It has an extensive distribution channel.
Mars is a famous food industry and is the topmost producer of confectionary products. Pladis
Ltd is a global biscuit, chocolate and confectionery company.
In each specific market Nestle operates, it has also to face the presence of very specialized
companies which are more focused and therefore experienced on that market. If we take the
Coffee market as an example, we can see that Starbucks, Keurig and Maxwell House appear
as the main competitors. However, we have focus our analysis oN the big competitors on a
general level.
3.5. MARKET SHARE
Nestlé has a very large business portfolio that include products such as water, cafe, health,
chocolate, among others. A big percentage of Nestlé’s sales are related to chocolate products,
so because of this the analysis of the market share will be focused on the global chocolate
market. However, to analyze how’s the company doing, and to know its strengths and
weaknesses, it will be considered Nestlé as a whole, in order to have a more general view and
understanding.
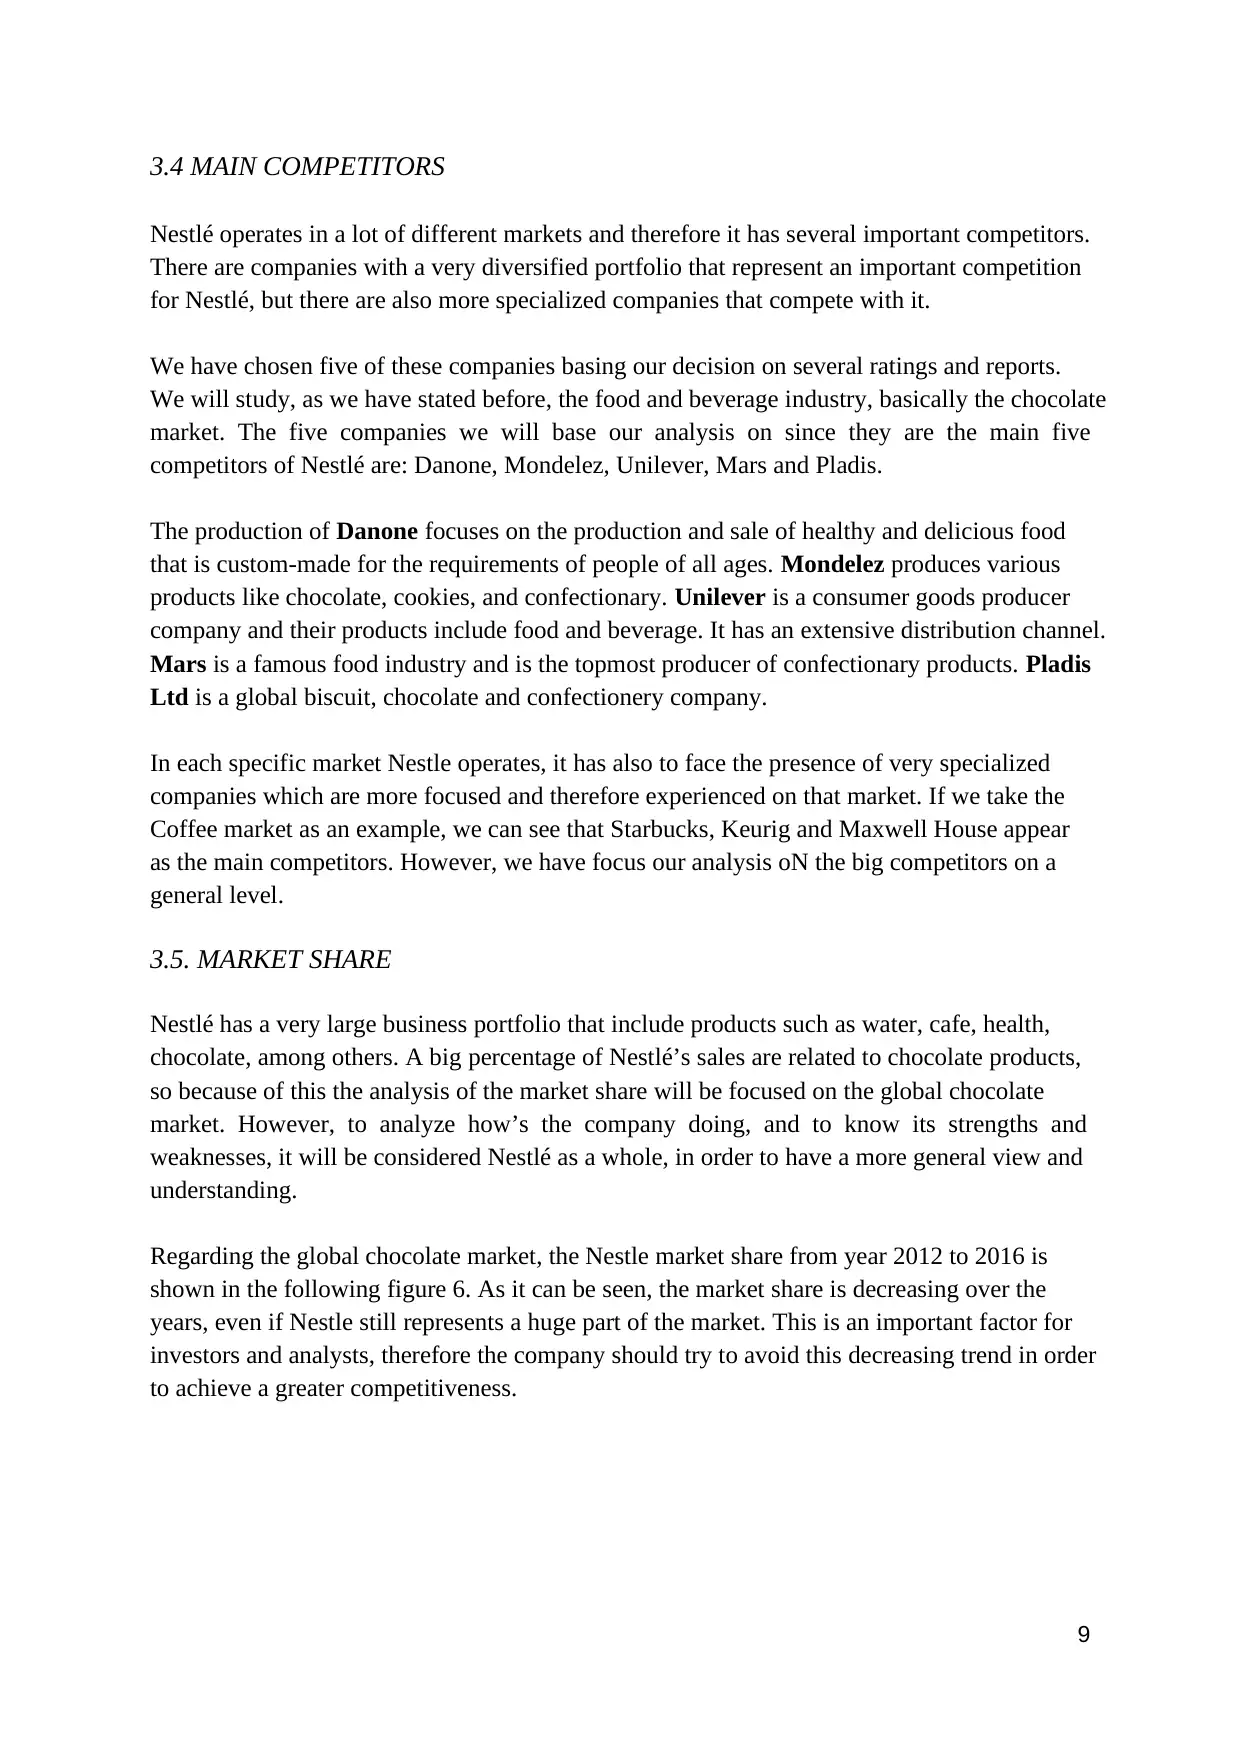
Regarding the global chocolate market, the Nestle market share from year 2012 to 2016 is
shown in the following figure 6. As it can be seen, the market share is decreasing over the
years, even if Nestle still represents a huge part of the market. This is an important factor for
investors and analysts, therefore the company should try to avoid this decreasing trend in order
to achieve a greater competitiveness.
9
Nestlé operates in a lot of different markets and therefore it has several important competitors.
There are companies with a very diversified portfolio that represent an important competition
for Nestlé, but there are also more specialized companies that compete with it.
We have chosen five of these companies basing our decision on several ratings and reports.
We will study, as we have stated before, the food and beverage industry, basically the chocolate
market. The five companies we will base our analysis on since they are the main five
competitors of Nestlé are: Danone, Mondelez, Unilever, Mars and Pladis.
The production of Danone focuses on the production and sale of healthy and delicious food
that is custom-made for the requirements of people of all ages. Mondelez produces various
products like chocolate, cookies, and confectionary. Unilever is a consumer goods producer
company and their products include food and beverage. It has an extensive distribution channel.
Mars is a famous food industry and is the topmost producer of confectionary products. Pladis
Ltd is a global biscuit, chocolate and confectionery company.
In each specific market Nestle operates, it has also to face the presence of very specialized
companies which are more focused and therefore experienced on that market. If we take the
Coffee market as an example, we can see that Starbucks, Keurig and Maxwell House appear
as the main competitors. However, we have focus our analysis oN the big competitors on a
general level.
3.5. MARKET SHARE
Nestlé has a very large business portfolio that include products such as water, cafe, health,
chocolate, among others. A big percentage of Nestlé’s sales are related to chocolate products,
so because of this the analysis of the market share will be focused on the global chocolate
market. However, to analyze how’s the company doing, and to know its strengths and
weaknesses, it will be considered Nestlé as a whole, in order to have a more general view and
understanding.
Regarding the global chocolate market, the Nestle market share from year 2012 to 2016 is
shown in the following figure 6. As it can be seen, the market share is decreasing over the
years, even if Nestle still represents a huge part of the market. This is an important factor for
investors and analysts, therefore the company should try to avoid this decreasing trend in order
to achieve a greater competitiveness.
9
⊘ This is a preview!⊘
Do you want full access?
Subscribe today to unlock all pages.
Trusted by 1+ million students worldwide
Figure 6. Market share of Nestlé on Global Chocolate market.
Source: Statista. Wall Street Journal.
4. BUSINESS MODEL OF NESTLÉ
4.1. MISSION
“Nestlé" is a world-wide company which impacts on the every day’s life of millions of people
by improving their quality of life and contributing for a more healthy future. It has a great
impact on people from the farmers with whom they work to the families who enjoy its products.
It supports the achievement of the sustainable development goals of the United Nations by:
- Helping more than 50 million children to have a more healthy lifestyle.
- Improving the living conditions of 30 million people directly related to their business
activities
- Working for achieving a null impact in the environment by their activities.
4.2. DISTINCTIVE FACTORS
The company gives its support to health development, breastfeeding, actions to stop children
exploitations, and environmental issues.
- “Nestlé” Spain does not use genetically modified raw materials: Although in many
countries the safety of genetically modified organisms, commonly referred to as
transgenic, is increasingly accepted, not only by authorities but also by consumers, in
Spain their safety continues to be questioned, that is why if at any time it uses them it
would indicate this in the labeling of its products.
10
Paraphrase This Document
Need a fresh take? Get an instant paraphrase of this document with our AI Paraphraser
- Palm oil: Nestlé guarantees that these and all its products are totally safe for health.
The use of palm oil is made for sensory reasons such as texture. Compared to
conventional oils (olive, sunflower), it is more resistant and keeps the product much
better.
- Support to the breastfeeding: It supports the recommendations of the World Health
Organization to feed babies with breast milk the first six months of life and continue
breastfeeding later with complementary foods.
- Against children exploitation: The company has recruited 18 controls and correction
agents to raise awareness of child labor and inform in order to determine if interventions
are needed.
- Actions in order to stop the climate change.
Nestlé wants to position itself as part of the solution, and strives every day to reduce its
emissions and improve the management of resources.
- They do not test their products with animals.
- The world's largest private research network in nutrition and food: Nestlé
Research has the largest private R & D global network which aims to investigate the
benefits of nutrition for health in order to apply them to Nestlé products.
4.3. CORPORATE GOVERNANCE
The Board of Directors of Nestlé is highly engaged in the long-term value creation and the
investment for the future development of the company. The Board is really concerned about
the growth and efficiency, thus it stated commitments to margin expansion, streamlining the
portfolio, a prudent capital allocation and moreover, they approved a share buyback
programme of CHF 20 billion for strategic opportunities. All these subjects show how the
governance is involved with the sustainable growth of Nestlé.
Ulf Mark Schneider is the executive member of the Board of Directors of Nestlé and the CEO
of the company since 2017. The financial analyst Paul Bulcke is the chairman of Nestlé and
has certain responsibilities for the direction and control of the group.
4.4. CORPORATE SOCIAL RESPONSIBILITY
The Nestle Corporate Business Principles have been developing for over 150 years and they
are the basis of the company culture.
These principles try to adapt to the world that keeps changing but the basic fundamentals have
11
not change since the company first was created. Moreover, they reflect the idea of honesty,
fairness and concern for people.
All these points are important for all the countries and they take into account each country and
their religion and culture:
1. Nutrition, Health and Wellbeing
Nestle objective is to offer food and drinks that are tasty and healthy and that promote
a healthy lifestyle. (“A gusto con la vida”).
2. Quality assurance and product safety
It assures that their products are safe and that have a high quality.
3. Communication with the consumer
They are committed to maintain reliable and responsible communication. Consumer
privacy is respected.
4. Human rights in their business activity
Nestle supports the United Nations Global Compact on human rights and they try to
offer an example of good human practices in all the activities.
5. Leadership and personal responsibility
For Nestle, the staff are really important, they say they are the key of their success.
Employees are professional and motivated people. They ensure the employees privacy
and they do not tolerate any form of discrimination.
6. Safety
Nestle protects their employees and tries to prevent accidents and injuries.
7. Relations with suppliers and customers
They ask for agents, suppliers and employees to work and act with honesty, fairness
and integrity. These same aspects apply to the clients.
8. Agriculture and rural development
From the environmental point of view, Nestle contributes to improve the production
system, the economic level of farmers and the agricultural production.
9. Environmental sustainability
They aim to use natural resources in the life cycle of the production and their goal is to
have “zero waste”.
10. Water
Nestle wants to improve the administration of water.
12
⊘ This is a preview!⊘
Do you want full access?
Subscribe today to unlock all pages.
Trusted by 1+ million students worldwide
1 out of 21
Related Documents


Your All-in-One AI-Powered Toolkit for Academic Success.
+13062052269
info@desklib.com
Available 24*7 on WhatsApp / Email
![[object Object]](/_next/static/media/star-bottom.7253800d.svg)
Unlock your academic potential
Copyright © 2020–2026 A2Z Services. All Rights Reserved. Developed and managed by ZUCOL.