Economics Assignment: Nestle's Strategy and Microeconomic Analysis
VerifiedAdded on 2023/04/19
|16
|3711
|79
Report
AI Summary
This economics assignment analyzes Nestle, a major player in the global food and beverage industry. The report begins with an introduction and an overview of Nestle, detailing its global presence and diverse product portfolio, followed by an examination of the industry's characteristics, including market structure, particularly focusing on monopolistic competition. The assignment further explores microeconomic principles, such as demand and supply, and their influence on Nestle's pricing strategies and market share. It investigates the elasticity of Nestle's products, assessing how changes in price affect demand, and includes an analysis of recent events in the Australian food and beverage industry. The report also examines the company's competitors and market share dynamics. Finally, the report concludes with a discussion of Nestle's strategic considerations and future outlook.

Running head: ECONOMICS ASSIGNMENT
Economics Assignment
Name of the Student
Name of the University
Author Note
Economics Assignment
Name of the Student
Name of the University
Author Note
Paraphrase This Document
Need a fresh take? Get an instant paraphrase of this document with our AI Paraphraser

1ECONOMICS ASSIGNMENT
Table of Contents
Introduction:...............................................................................................................................2
Description of Company and Industry:......................................................................................2
Overview of the company:.....................................................................................................2
Industry overview:.................................................................................................................3
Industry Market Structure:.........................................................................................................5
Microeconomic analysis of Nestle:............................................................................................7
Elasticity of products:..............................................................................................................10
Recent events in food and beverage industry of Australia:......................................................12
Conclusion:..............................................................................................................................13
References:...............................................................................................................................14

2ECONOMICS ASSIGNMENT
Introduction:
In this dynamic world of business, each small, medium or large-size business needs to
select proper business strategy as their respective market structure. This business strategy can
further help a company to sustain in a competitive business market through making sufficient
amount of profit. After globalisation, a firm needs to compete in international market with
foreign companies. Therefore, making standard product and delivering better services are
become an essential issue. In this context, it needs to mention that different types of
companies operate in different market structure based on characteristics of different
industries. Moreover, demand and supply of a company’s product or service depend on
various factors. The firm needs to understand the demand elasticity and supply elasticity of
their product. This can help the producer to charge prices accordingly (Thomason 2018). This
project intends to determine strategy of Nestle for the next 5 years covering various key
issues that have mentioned earlier.
Description of Company and Industry:
Overview of the company:
Nestle is an international company, headquartered in Switzerland. This is the largest
food and beverages company across the world, as it delivers large a vast range of food items,
such as medical food, baby food, dairy products, pet foods and coffee and tea and so on.
Nestle was established over 150 years ago and gradually has made a unique footprint in
international market (Nestle.com 2018). However, Nestle grew significantly after the First
World War. At present, Nestle sells its products in 189 countries. The chief aim of this
company is to provide sustainable as well as industry leading performance to the world. This
further helps Nestle to earn customers’ trust by increasing quality of life and offering best
quality of product for healthier future. At of 2017, around 323000 employees work in this
⊘ This is a preview!⊘
Do you want full access?
Subscribe today to unlock all pages.
Trusted by 1+ million students worldwide
3ECONOMICS ASSIGNMENT
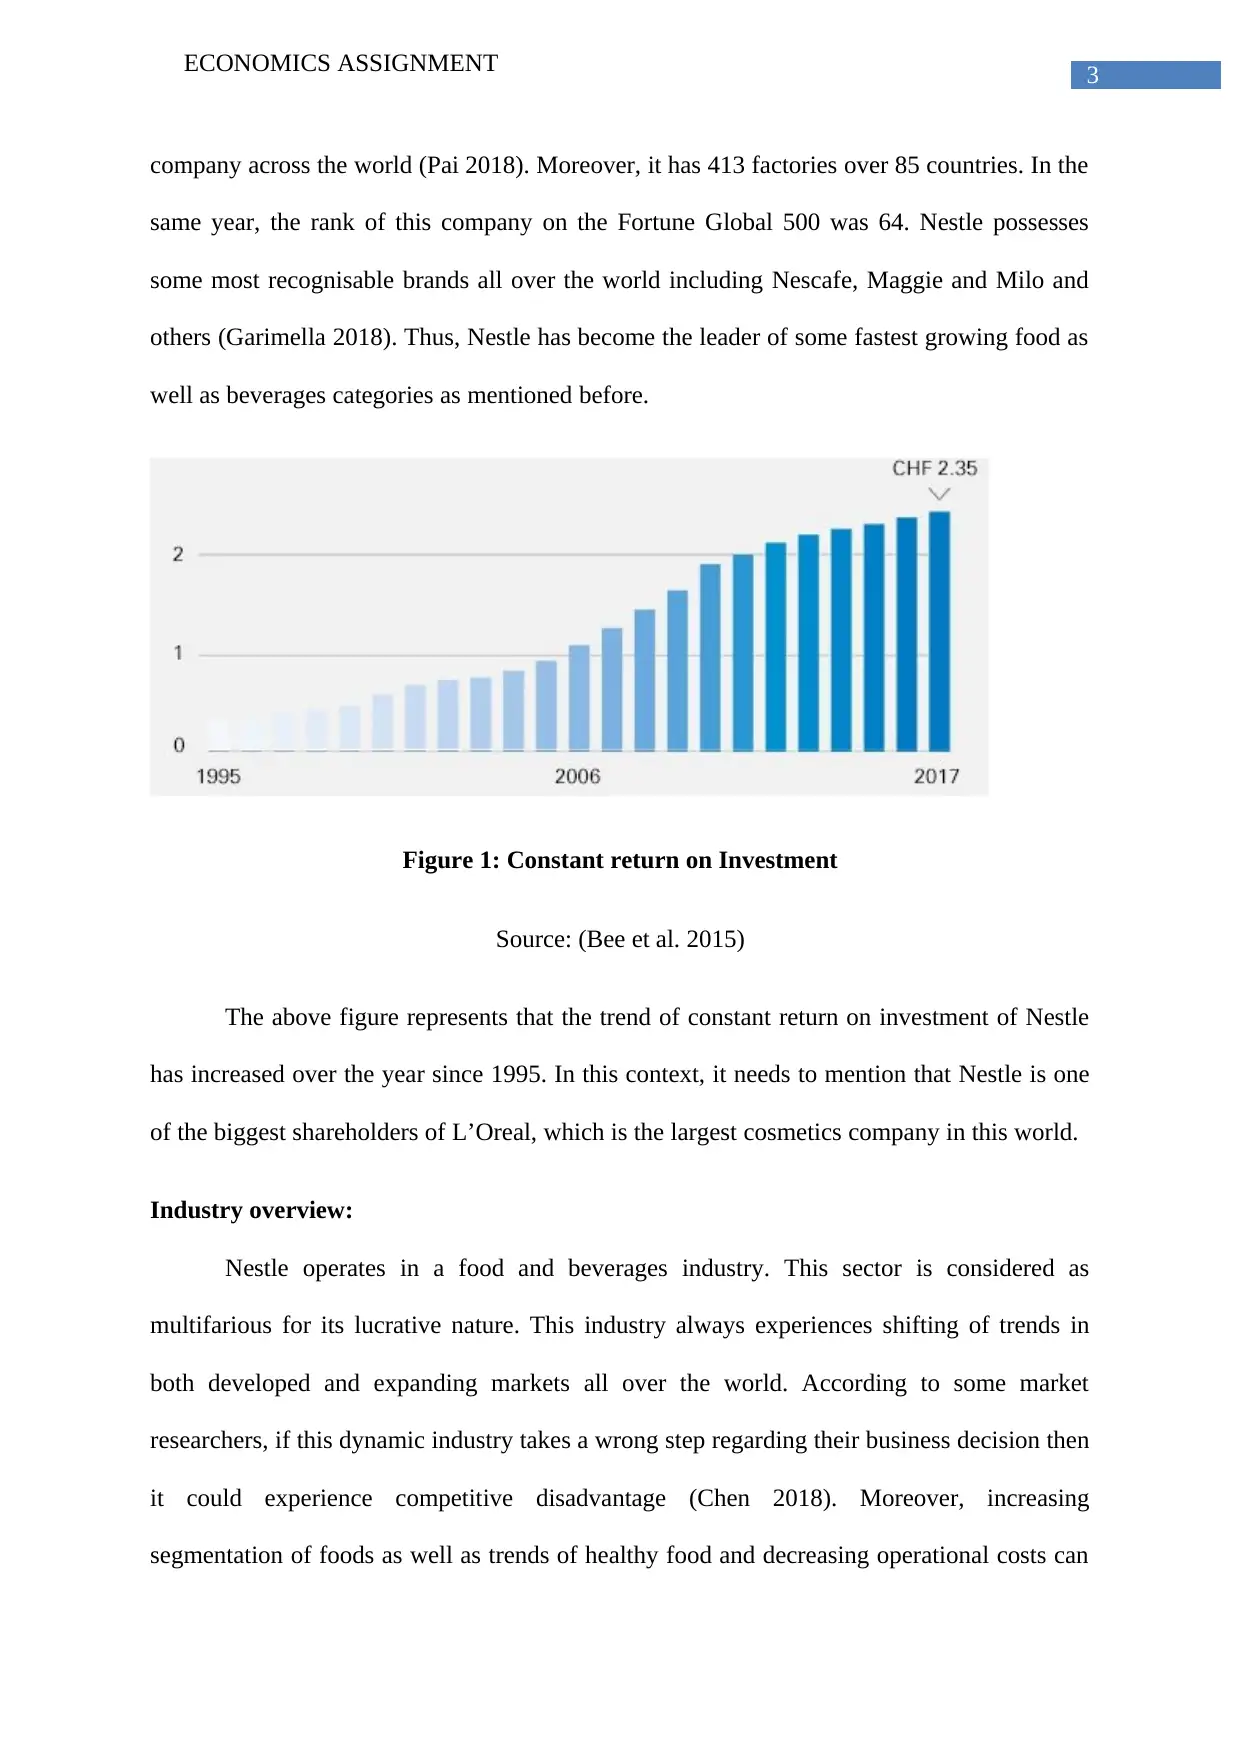
company across the world (Pai 2018). Moreover, it has 413 factories over 85 countries. In the
same year, the rank of this company on the Fortune Global 500 was 64. Nestle possesses
some most recognisable brands all over the world including Nescafe, Maggie and Milo and
others (Garimella 2018). Thus, Nestle has become the leader of some fastest growing food as
well as beverages categories as mentioned before.
Figure 1: Constant return on Investment
Source: (Bee et al. 2015)
The above figure represents that the trend of constant return on investment of Nestle
has increased over the year since 1995. In this context, it needs to mention that Nestle is one
of the biggest shareholders of L’Oreal, which is the largest cosmetics company in this world.
Industry overview:
Nestle operates in a food and beverages industry. This sector is considered as
multifarious for its lucrative nature. This industry always experiences shifting of trends in
both developed and expanding markets all over the world. According to some market
researchers, if this dynamic industry takes a wrong step regarding their business decision then
it could experience competitive disadvantage (Chen 2018). Moreover, increasing
segmentation of foods as well as trends of healthy food and decreasing operational costs can
Paraphrase This Document
Need a fresh take? Get an instant paraphrase of this document with our AI Paraphraser
4ECONOMICS ASSIGNMENT
generate obvious challenges in coming years. Thus, according to researchers, companies
within this industry need to optimise operational costs by conducting detail analysis of
market trends and new products. According to the Food and Beverages Global Market Report
of 2018, the estimated revenue of this market was more than $560 billion in 2017. The
segmentation of this market includes alcoholic beverages, non-alcoholic beverages, grain
foods, pet foods sea foods and frozen foods and so on. However, Nestle does not produce all
types of foods. In Australia, this industry is considered as a major one in terms of
employment generation and financial contribution. In this country, the industry operates in a
most dynamic way due to consumers’ demand (Santoro, Vrontis and Pastore 2017). The trend
of consumer’s demand changes for diversity, value and quality. The ethnic as well as cultural
diversity of this country can be observed in the vast range of available food.
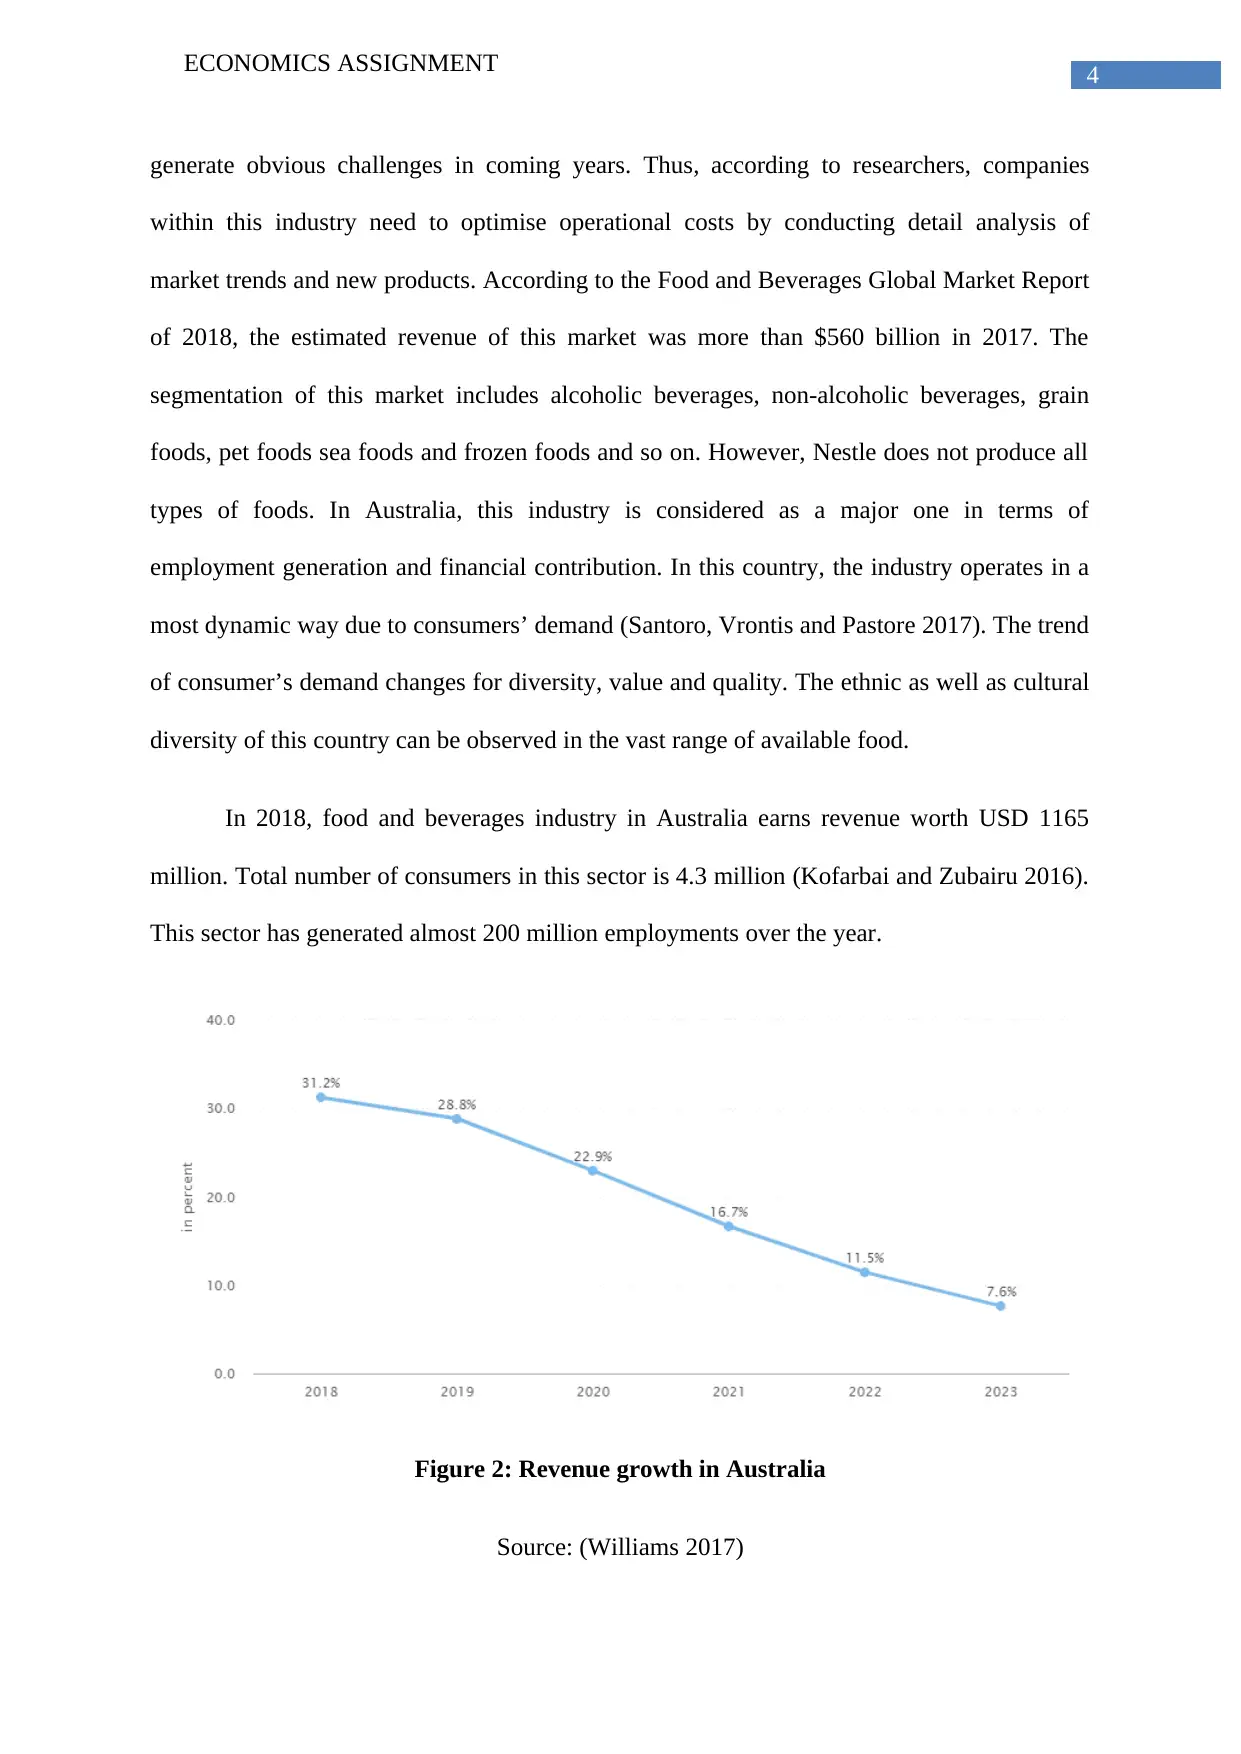
In 2018, food and beverages industry in Australia earns revenue worth USD 1165
million. Total number of consumers in this sector is 4.3 million (Kofarbai and Zubairu 2016).
This sector has generated almost 200 million employments over the year.
Figure 2: Revenue growth in Australia
Source: (Williams 2017)
generate obvious challenges in coming years. Thus, according to researchers, companies
within this industry need to optimise operational costs by conducting detail analysis of
market trends and new products. According to the Food and Beverages Global Market Report
of 2018, the estimated revenue of this market was more than $560 billion in 2017. The
segmentation of this market includes alcoholic beverages, non-alcoholic beverages, grain
foods, pet foods sea foods and frozen foods and so on. However, Nestle does not produce all
types of foods. In Australia, this industry is considered as a major one in terms of
employment generation and financial contribution. In this country, the industry operates in a
most dynamic way due to consumers’ demand (Santoro, Vrontis and Pastore 2017). The trend
of consumer’s demand changes for diversity, value and quality. The ethnic as well as cultural
diversity of this country can be observed in the vast range of available food.
In 2018, food and beverages industry in Australia earns revenue worth USD 1165
million. Total number of consumers in this sector is 4.3 million (Kofarbai and Zubairu 2016).
This sector has generated almost 200 million employments over the year.
Figure 2: Revenue growth in Australia
Source: (Williams 2017)

5ECONOMICS ASSIGNMENT
According to above diagram, it can be seen that revenue growth in Australia will
decrease in coming years (Dalton 2015). Therefore, it could be beneficial for companies
including Nestle to adopt proper business strategy to prevent itself from incurring losses.
Industry Market Structure:
The food and beverage industry follows monopolistic competitive market structure. In
this type of market, the number of sellers and buyers is very large. In addition to this, the
market gives the opportunity of free exit and entry to any firm. As a result, new firms can
enter into the market easily while existing firms can also exist from this market without
experiencing much trouble. The other characteristic of this market is that all firms sell almost
same products, which are closely substitute but can be differentiated based on their colour,
size, price and product quality. Therefore, each firm operates like a monopolistic one due to
their unique product structure. In this specified market, many firms including Nestle sell
foods and beverages which are almost similar though customers can differentiate these
according to their size, price, brand and taste. Therefore, each company has the opportunity to
earn super normal or normal profit. Moreover, companies can incur loss based on their
performance. The demand curve, marginal revenue and marginal cost curves of a firm under
the monopolistic competitive market can be described with the help of following diagram.
⊘ This is a preview!⊘
Do you want full access?
Subscribe today to unlock all pages.
Trusted by 1+ million students worldwide

6ECONOMICS ASSIGNMENT
O
Q
P
C
Output
SACSMC
AR=D
MR
Figure 1: Monopolistically Competitive Market
Source: (Created by author)
The above figure represents a condition of excess profit-making of a firm. Each firm
in this market experiences a down-slopping curve. The market price is P while cost is C.
Therefore, the market can experience the amount of profit by the difference P-C.
In the food and beverage market, Nestle conducts its business with some strong
competitors, which are MARS, Mondelez, Hershey’s, Heinz and Unilever and so on. Most of
them experience significant market share and consequently operate individually without
influencing business strategy of other companies. Therefore, it is essential to explain market
share of other firms.
Paraphrase This Document
Need a fresh take? Get an instant paraphrase of this document with our AI Paraphraser

7ECONOMICS ASSIGNMENT
Figure 2: Market share of Nestle and other competitor firms in 2017
Source: (Anghel, Curea and Popescu 2018)
It can be said from the above figure that MARS has experienced the largest market
share in the last year. The company possesses 14.4 % of the total food and beverage market.
Following this company, Mondelez experiences 13.7% of total market share while Nestle
possesses the third position, as it captures 10.2% share of total market (Karnani, McFerran
and Mukhopadhyay 2016). However, from the above figure it can be said that each company
experiences almost equal share of market on an average. Moreover, the term ‘other’
represents that there are many small and medium size firms, which also operate in the same
industry. Therefore, none of these firms experience any restrictions to enter into this specified
market (Romaniuk, Dawes and Nenycz-Thiel 2018). None of them possesses a huge share of
the entire market. Therefore, each of them has operated as a monopolistic competitive
market.
Microeconomic analysis of Nestle:
It is essential for each firm to know market demand for their products in market.
Based on this demand and other factors the firm determines corresponding level of supply. In

8ECONOMICS ASSIGNMENT
Price Price of Nestle
P1
Price of MARS
P0
Q0 Q1
D
P
D0
D1
Q1Q0Output Output
general, most of the products follow the law of demand and supply considering other factors
as constant. This is also true for Nestle. The demand and supply of the Nestle products
depend entirely on its own price while some other factors can also influence the demand and
supply accordingly (Anttila-Hughes et al. 2018). However, this report intends to select two
chief reasons that can influence demand for the Nestle products in market. The most
important demand influencing factor is own price. If prices of these products increase in
market then consumers intend to purchase these products by fewer amounts compare to
before. On the contrary, decrease in price can tend customers to purchase these products by
more amount than before. Therefore, Nestle products follow the demand law that states that
price of a product has inverse relationship with quantity demanded. The other factor that can
influence demand for Nestle products are price of other companies’ products. Products of
other competitive firms are close substitute of Nestle (Ramesh 2018). Therefore, if another
firm changes price then demand for Nestle products can be changed accordingly. For
instance, if MARS increases prices of their products then demand for Nestle products can be
increased accordingly. This can be explained with the help of following diagram.
⊘ This is a preview!⊘
Do you want full access?
Subscribe today to unlock all pages.
Trusted by 1+ million students worldwide
9ECONOMICS ASSIGNMENT
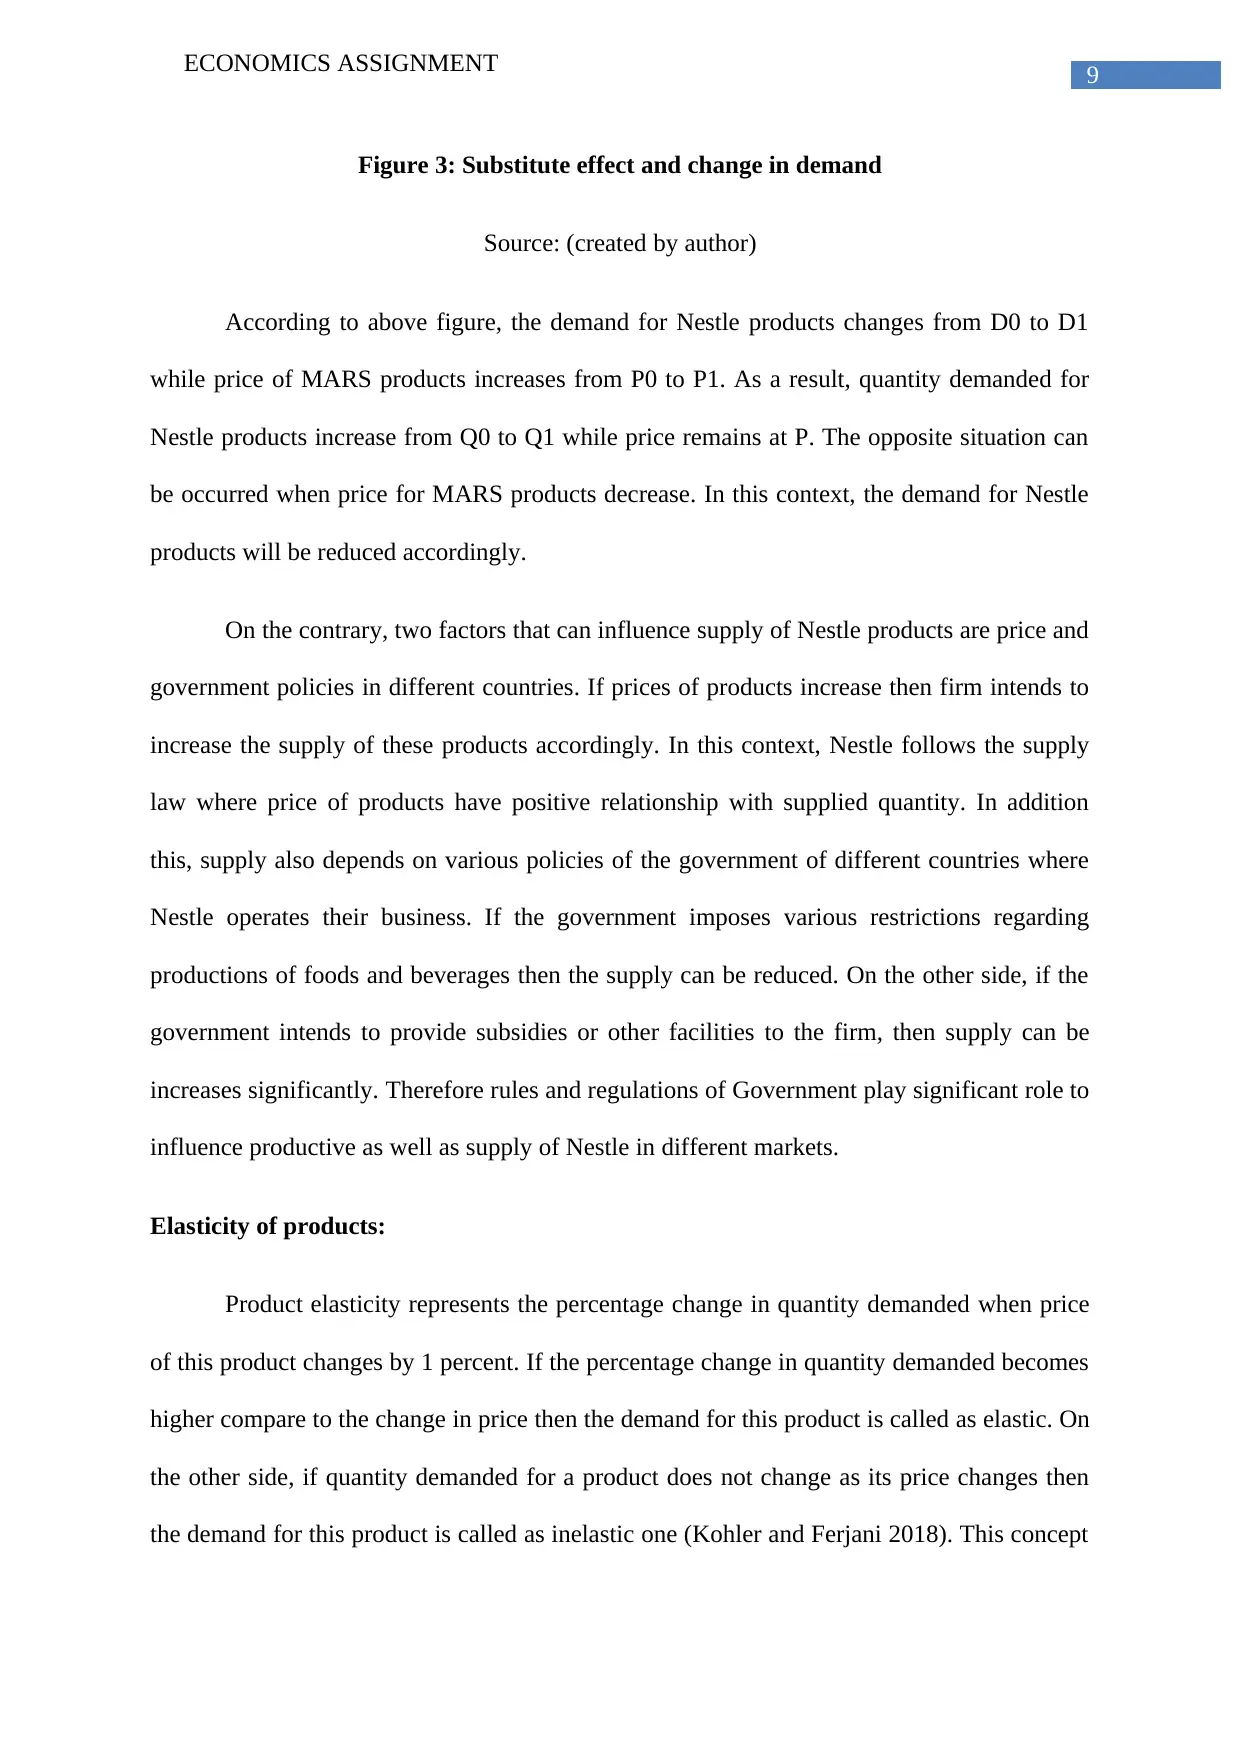
Figure 3: Substitute effect and change in demand
Source: (created by author)
According to above figure, the demand for Nestle products changes from D0 to D1
while price of MARS products increases from P0 to P1. As a result, quantity demanded for
Nestle products increase from Q0 to Q1 while price remains at P. The opposite situation can
be occurred when price for MARS products decrease. In this context, the demand for Nestle
products will be reduced accordingly.
On the contrary, two factors that can influence supply of Nestle products are price and
government policies in different countries. If prices of products increase then firm intends to
increase the supply of these products accordingly. In this context, Nestle follows the supply
law where price of products have positive relationship with supplied quantity. In addition
this, supply also depends on various policies of the government of different countries where
Nestle operates their business. If the government imposes various restrictions regarding
productions of foods and beverages then the supply can be reduced. On the other side, if the
government intends to provide subsidies or other facilities to the firm, then supply can be
increases significantly. Therefore rules and regulations of Government play significant role to
influence productive as well as supply of Nestle in different markets.
Elasticity of products:
Product elasticity represents the percentage change in quantity demanded when price
of this product changes by 1 percent. If the percentage change in quantity demanded becomes
higher compare to the change in price then the demand for this product is called as elastic. On
the other side, if quantity demanded for a product does not change as its price changes then
the demand for this product is called as inelastic one (Kohler and Ferjani 2018). This concept
Paraphrase This Document
Need a fresh take? Get an instant paraphrase of this document with our AI Paraphraser

10ECONOMICS ASSIGNMENT
Price of Nestle products
P0
P1
Q0 Q1 Quantity demanded
D
O
helps a firm to set prices for products accordingly. As Nestle sells foods and beverages and
the company has many competitors in market, the company experiences unitary elastic
demand curve for their products. This implies that if prices of Nestle products increase by 1
percent then quantity demanded for these products decrease by the same percentage. In this
situation, some consumers will shift from this company to other one. The following diagram
represents this unitary elastic demand curve.
Figure 4: Unitary elastic demand curve of Nestle
Source: (created by author)
The above figure represents unitary elastic demand curve where change in price and
change in quantity demanded become equal. This implies that the difference between P0P1
and Q0Q1 are equal.
The elasticity of demand depends on various factors. In the context of Nestle, demand
elasticity can be changed due to availability of substitute products and time period. If the

11ECONOMICS ASSIGNMENT
number of substitute products increase in market then the demand for Nestle products can be
more elastic than before. This is because people may change their preference from Nestle
products to others. Therefore a change in price can change the quantity demanded for Nestle
products by large extend. The opposite can also happen if the number of substitute products
of Nestle decreases in market. On the other side, time also plays significant role to stimulate
elasticity of a product. The taste and preference of customers can be changed over time. In
addition to this, production technology of Nestle products can be upgraded. For this, the price
of this company’s products can reduce accordingly. These two changing factors over time can
influence demand elasticity of Nestle to change further.
The demand elasticity can also be determined based on income and or price of related
commodities considering both substitute and complementary products. The income elasticity
of Nestle products is greater than one (Bogue, Collins and Troy 2017). This implies that if the
income of a consumer increases then the person intends to purchase Nestle products by large
amount. However, if the income of those consumers decreases then those people tend to
purchase other goods with comparatively lower prices. This happens as Nestle products have
significant brand value and consequently these are considered as inferior goods (Jovanov,
Davcev and Boeva 2018). On the other side, cross price elasticity considers as another
important factor. For instance, if price of MARS products increase, the demand for Nestle
products increase accordingly. This is true for other competitive firms of Nestle.
Recent events in food and beverage industry of Australia:
Recently, the food and beverage industry experiences some changes that further
changes the market demand for these products significantly. Due to higher obesity rate, most
of the people reduce their preference on fastfood and beverages that contain sugar by large
quantity. Previously, people consumed these fastfood by large extend in their fastest life.
⊘ This is a preview!⊘
Do you want full access?
Subscribe today to unlock all pages.
Trusted by 1+ million students worldwide
1 out of 16
Related Documents


Your All-in-One AI-Powered Toolkit for Academic Success.
+13062052269
info@desklib.com
Available 24*7 on WhatsApp / Email
![[object Object]](/_next/static/media/star-bottom.7253800d.svg)
Unlock your academic potential
Copyright © 2020–2026 A2Z Services. All Rights Reserved. Developed and managed by ZUCOL.