Netflix Data Analysis: Statistical Methods and Techniques Used
VerifiedAdded on 2023/06/11
|11
|2251
|479
Report
AI Summary
This report focuses on analyzing Netflix's performance from 2012 to 2020 using various statistical and data handling techniques. Raw data related to profits, sales, content spend, and subscriber numbers was extracted from online sources. Statistical methods such as mean, median, and mode were applied to the data, followed by data manipulation techniques including minimum, maximum, sum, average, and count functions in Excel. The findings are presented through diagrams and tables to visualize the data and assess Netflix's performance over the specified period, concluding with an interpretation of the results and their implications for the company's growth and market position. This document is available on Desklib, a platform offering study tools and solved assignments.
MANAGING DATA
Paraphrase This Document
Need a fresh take? Get an instant paraphrase of this document with our AI Paraphraser
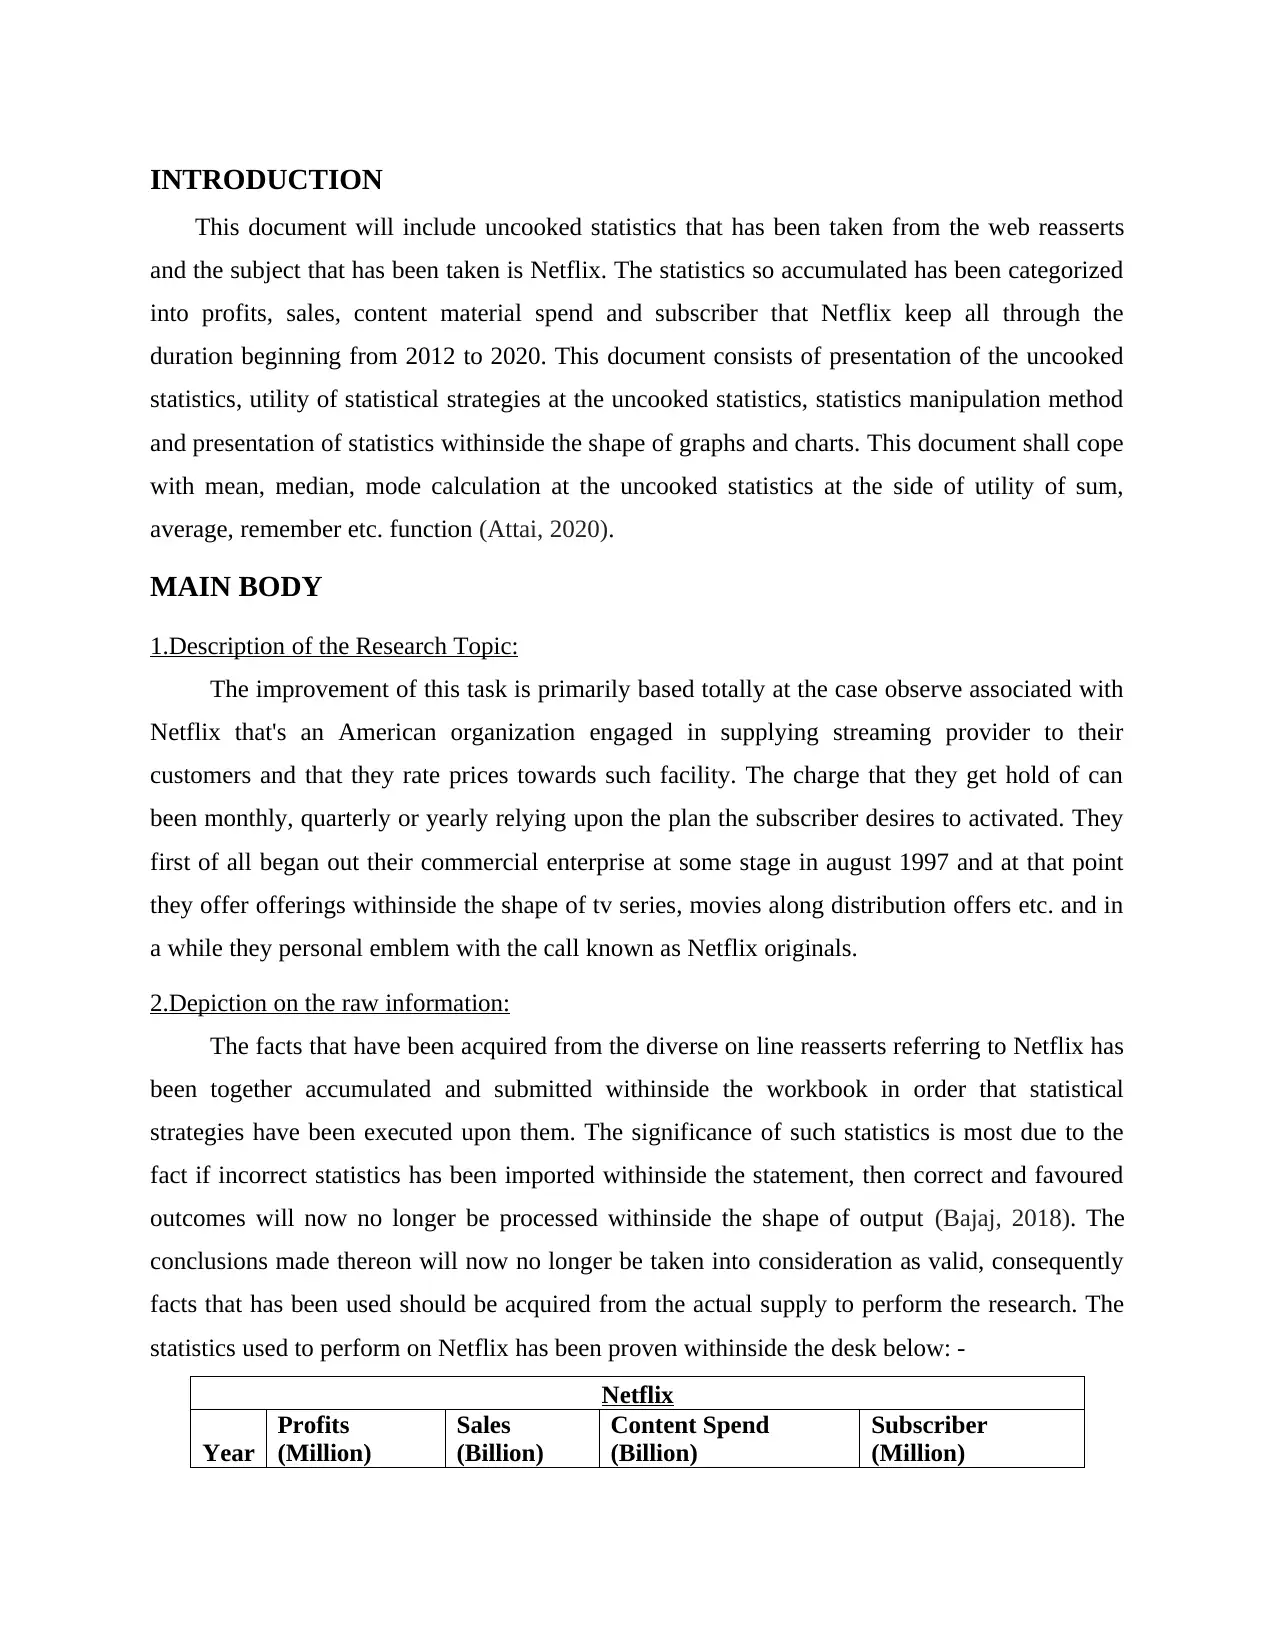
Contents
INTRODUCTION...........................................................................................................................3
MAIN BODY...................................................................................................................................3
1.Description of the Research Topic:.....................................................................................3
2.Depiction on the raw information:......................................................................................3
3.Application of statistical method on raw information:........................................................4
4.Data handling techniques:...................................................................................................5
5.Information demonstration using diagrams and tables:.......................................................7
CONCLUSION..............................................................................................................................10
REFERENCES..............................................................................................................................11
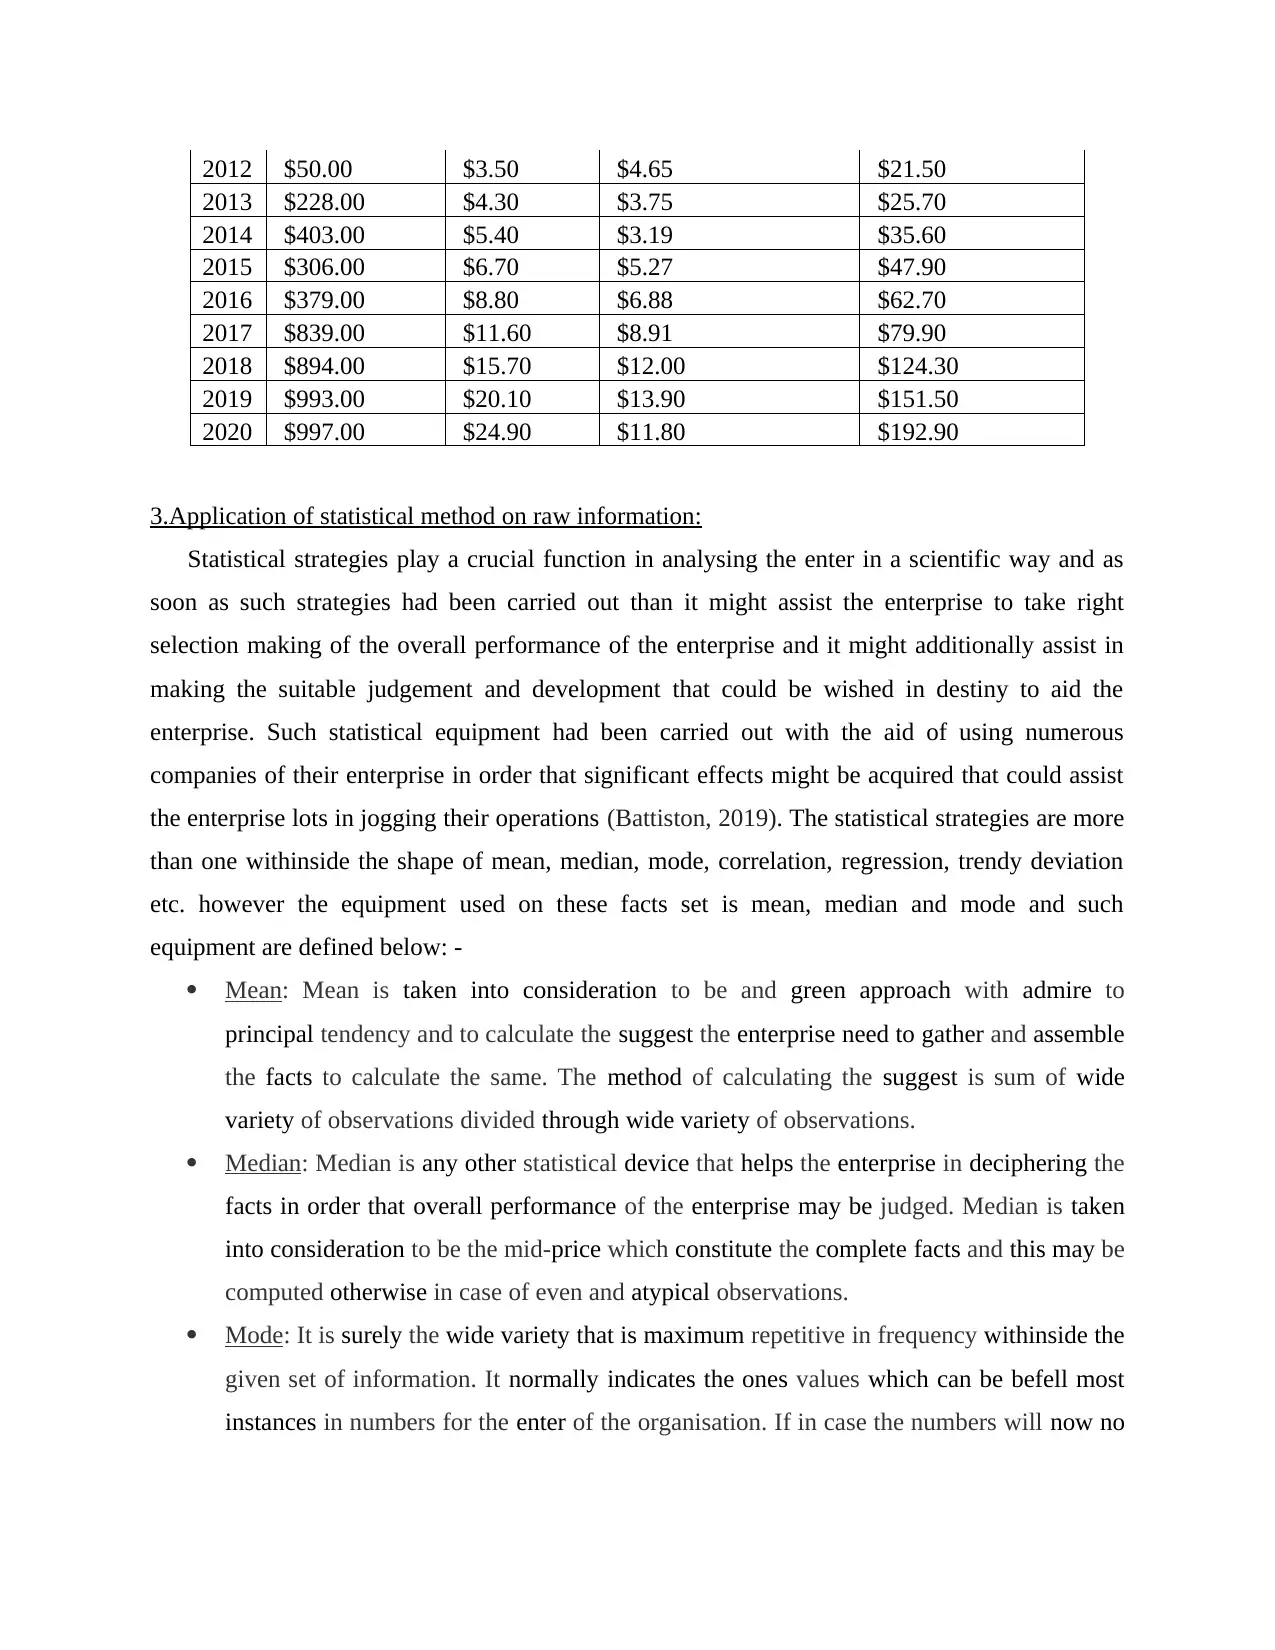
INTRODUCTION
This document will include uncooked statistics that has been taken from the web reasserts
and the subject that has been taken is Netflix. The statistics so accumulated has been categorized
into profits, sales, content material spend and subscriber that Netflix keep all through the
duration beginning from 2012 to 2020. This document consists of presentation of the uncooked
statistics, utility of statistical strategies at the uncooked statistics, statistics manipulation method
and presentation of statistics withinside the shape of graphs and charts. This document shall cope
with mean, median, mode calculation at the uncooked statistics at the side of utility of sum,
average, remember etc. function (Attai, 2020).
MAIN BODY
1.Description of the Research Topic:
The improvement of this task is primarily based totally at the case observe associated with
Netflix that's an American organization engaged in supplying streaming provider to their
customers and that they rate prices towards such facility. The charge that they get hold of can
been monthly, quarterly or yearly relying upon the plan the subscriber desires to activated. They
first of all began out their commercial enterprise at some stage in august 1997 and at that point
they offer offerings withinside the shape of tv series, movies along distribution offers etc. and in
a while they personal emblem with the call known as Netflix originals.
2.Depiction on the raw information:
The facts that have been acquired from the diverse on line reasserts referring to Netflix has
been together accumulated and submitted withinside the workbook in order that statistical
strategies have been executed upon them. The significance of such statistics is most due to the
fact if incorrect statistics has been imported withinside the statement, then correct and favoured
outcomes will now no longer be processed withinside the shape of output (Bajaj, 2018). The
conclusions made thereon will now no longer be taken into consideration as valid, consequently
facts that has been used should be acquired from the actual supply to perform the research. The
statistics used to perform on Netflix has been proven withinside the desk below: -
Netflix
Year
Profits
(Million)
Sales
(Billion)
Content Spend
(Billion)
Subscriber
(Million)
⊘ This is a preview!⊘
Do you want full access?
Subscribe today to unlock all pages.
Trusted by 1+ million students worldwide
2012 $50.00 $3.50 $4.65 $21.50
2013 $228.00 $4.30 $3.75 $25.70
2014 $403.00 $5.40 $3.19 $35.60
2015 $306.00 $6.70 $5.27 $47.90
2016 $379.00 $8.80 $6.88 $62.70
2017 $839.00 $11.60 $8.91 $79.90
2018 $894.00 $15.70 $12.00 $124.30
2019 $993.00 $20.10 $13.90 $151.50
2020 $997.00 $24.90 $11.80 $192.90
3.Application of statistical method on raw information:
Statistical strategies play a crucial function in analysing the enter in a scientific way and as
soon as such strategies had been carried out than it might assist the enterprise to take right
selection making of the overall performance of the enterprise and it might additionally assist in
making the suitable judgement and development that could be wished in destiny to aid the
enterprise. Such statistical equipment had been carried out with the aid of using numerous
companies of their enterprise in order that significant effects might be acquired that could assist
the enterprise lots in jogging their operations (Battiston, 2019). The statistical strategies are more
than one withinside the shape of mean, median, mode, correlation, regression, trendy deviation
etc. however the equipment used on these facts set is mean, median and mode and such
equipment are defined below: -
Mean: Mean is taken into consideration to be and green approach with admire to
principal tendency and to calculate the suggest the enterprise need to gather and assemble
the facts to calculate the same. The method of calculating the suggest is sum of wide
variety of observations divided through wide variety of observations.
Median: Median is any other statistical device that helps the enterprise in deciphering the
facts in order that overall performance of the enterprise may be judged. Median is taken
into consideration to be the mid-price which constitute the complete facts and this may be
computed otherwise in case of even and atypical observations.
Mode: It is surely the wide variety that is maximum repetitive in frequency withinside the
given set of information. It normally indicates the ones values which can be befell most
instances in numbers for the enter of the organisation. If in case the numbers will now no
Paraphrase This Document
Need a fresh take? Get an instant paraphrase of this document with our AI Paraphraser
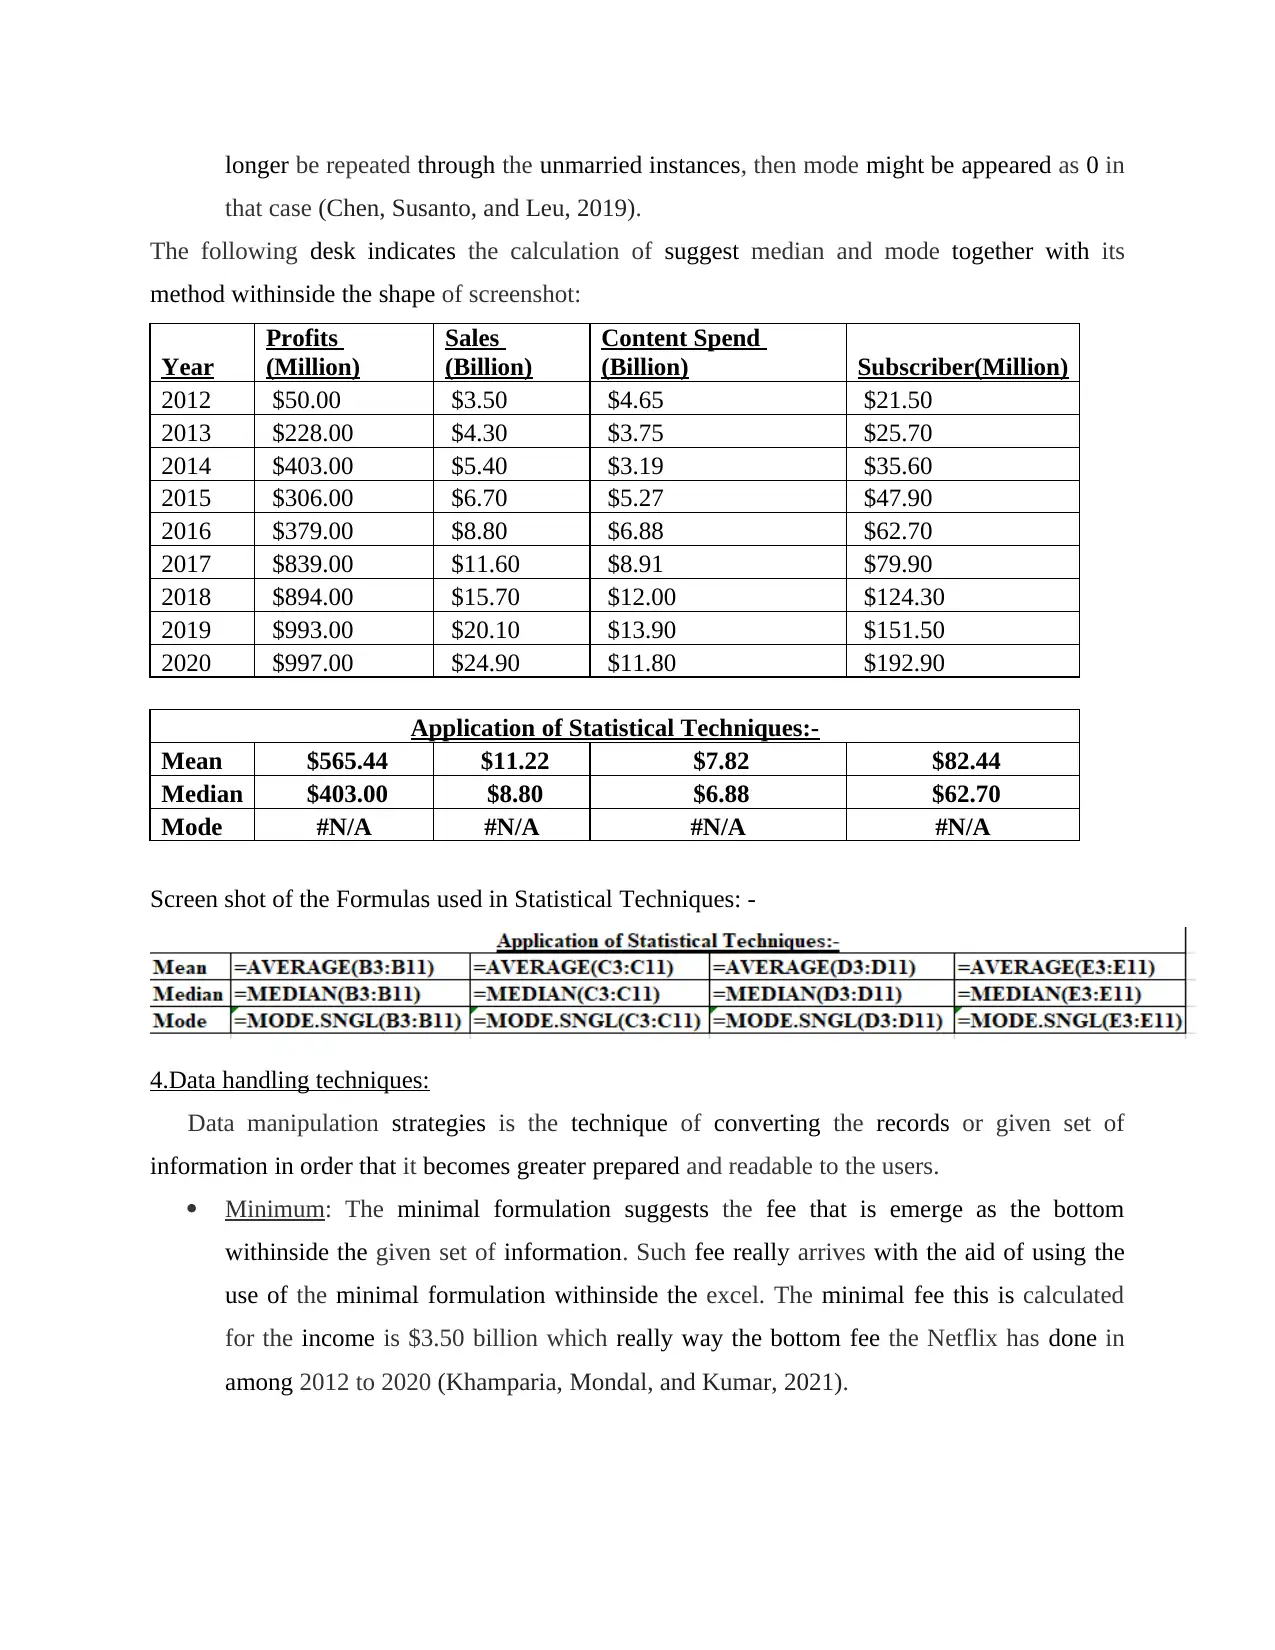
longer be repeated through the unmarried instances, then mode might be appeared as 0 in
that case (Chen, Susanto, and Leu, 2019).
The following desk indicates the calculation of suggest median and mode together with its
method withinside the shape of screenshot:
Year
Profits
(Million)
Sales
(Billion)
Content Spend
(Billion) Subscriber(Million)
2012 $50.00 $3.50 $4.65 $21.50
2013 $228.00 $4.30 $3.75 $25.70
2014 $403.00 $5.40 $3.19 $35.60
2015 $306.00 $6.70 $5.27 $47.90
2016 $379.00 $8.80 $6.88 $62.70
2017 $839.00 $11.60 $8.91 $79.90
2018 $894.00 $15.70 $12.00 $124.30
2019 $993.00 $20.10 $13.90 $151.50
2020 $997.00 $24.90 $11.80 $192.90
Application of Statistical Techniques:-
Mean $565.44 $11.22 $7.82 $82.44
Median $403.00 $8.80 $6.88 $62.70
Mode #N/A #N/A #N/A #N/A
Screen shot of the Formulas used in Statistical Techniques: -
4.Data handling techniques:
Data manipulation strategies is the technique of converting the records or given set of
information in order that it becomes greater prepared and readable to the users.
Minimum: The minimal formulation suggests the fee that is emerge as the bottom
withinside the given set of information. Such fee really arrives with the aid of using the
use of the minimal formulation withinside the excel. The minimal fee this is calculated
for the income is $3.50 billion which really way the bottom fee the Netflix has done in
among 2012 to 2020 (Khamparia, Mondal, and Kumar, 2021).
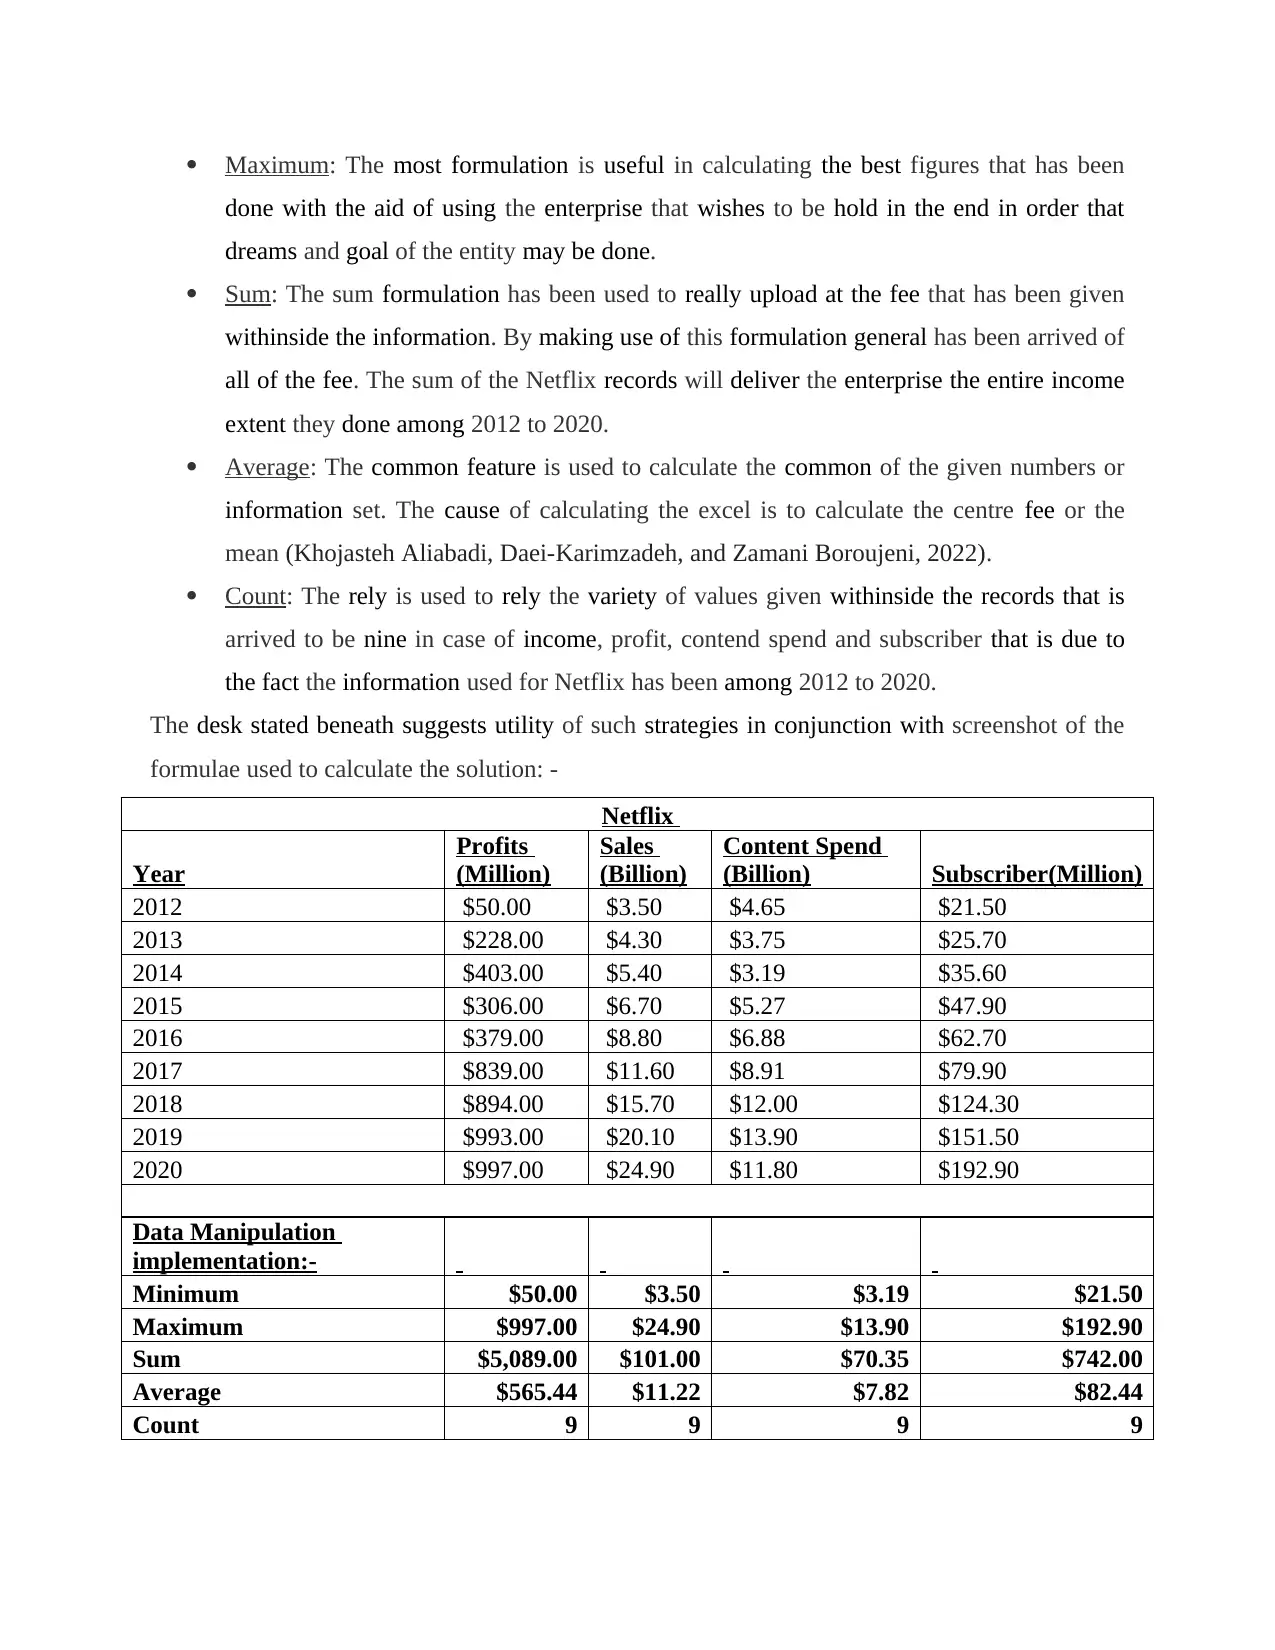
Maximum: The most formulation is useful in calculating the best figures that has been
done with the aid of using the enterprise that wishes to be hold in the end in order that
dreams and goal of the entity may be done.
Sum: The sum formulation has been used to really upload at the fee that has been given
withinside the information. By making use of this formulation general has been arrived of
all of the fee. The sum of the Netflix records will deliver the enterprise the entire income
extent they done among 2012 to 2020.
Average: The common feature is used to calculate the common of the given numbers or
information set. The cause of calculating the excel is to calculate the centre fee or the
mean (Khojasteh Aliabadi, Daei-Karimzadeh, and Zamani Boroujeni, 2022).
Count: The rely is used to rely the variety of values given withinside the records that is
arrived to be nine in case of income, profit, contend spend and subscriber that is due to
the fact the information used for Netflix has been among 2012 to 2020.
The desk stated beneath suggests utility of such strategies in conjunction with screenshot of the
formulae used to calculate the solution: -
Netflix
Year
Profits
(Million)
Sales
(Billion)
Content Spend
(Billion) Subscriber(Million)
2012 $50.00 $3.50 $4.65 $21.50
2013 $228.00 $4.30 $3.75 $25.70
2014 $403.00 $5.40 $3.19 $35.60
2015 $306.00 $6.70 $5.27 $47.90
2016 $379.00 $8.80 $6.88 $62.70
2017 $839.00 $11.60 $8.91 $79.90
2018 $894.00 $15.70 $12.00 $124.30
2019 $993.00 $20.10 $13.90 $151.50
2020 $997.00 $24.90 $11.80 $192.90
Data Manipulation
implementation:-
Minimum $50.00 $3.50 $3.19 $21.50
Maximum $997.00 $24.90 $13.90 $192.90
Sum $5,089.00 $101.00 $70.35 $742.00
Average $565.44 $11.22 $7.82 $82.44
Count 9 9 9 9
⊘ This is a preview!⊘
Do you want full access?
Subscribe today to unlock all pages.
Trusted by 1+ million students worldwide
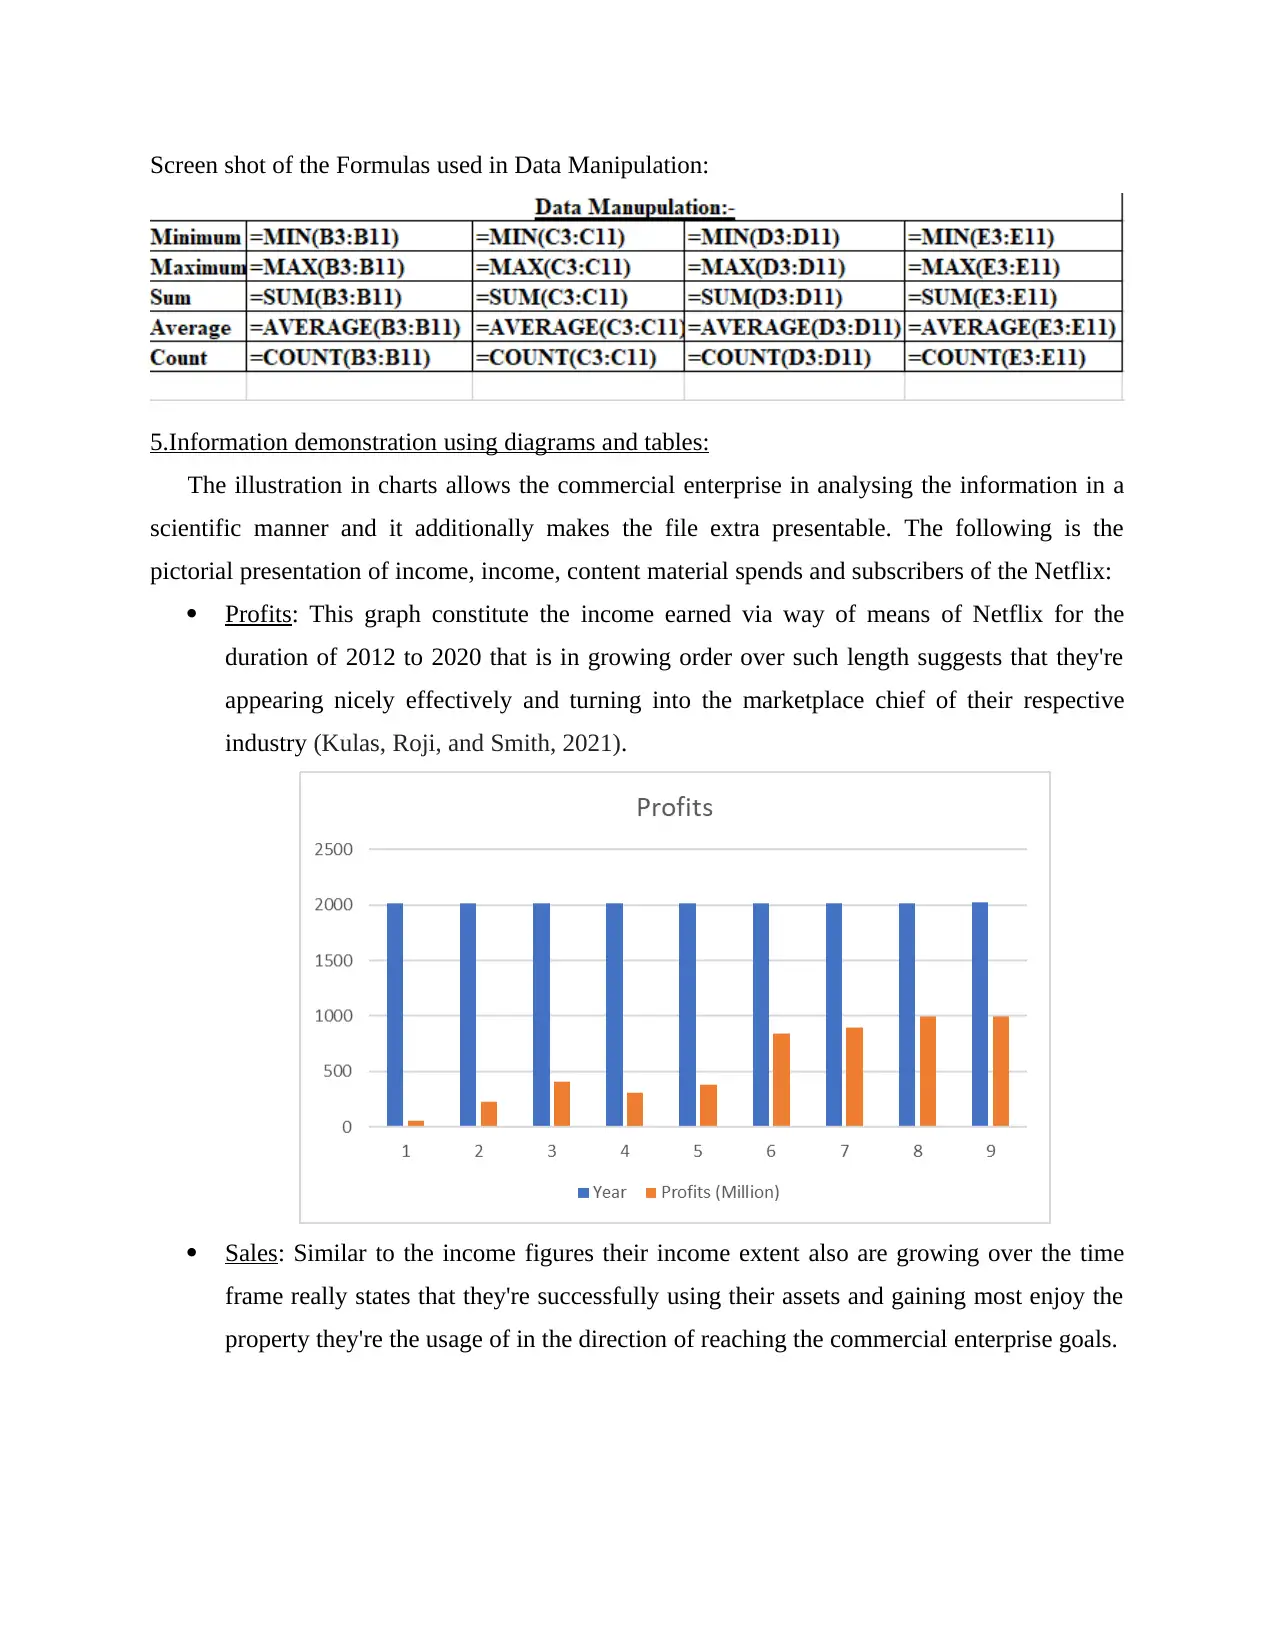
Screen shot of the Formulas used in Data Manipulation:
5.Information demonstration using diagrams and tables:
The illustration in charts allows the commercial enterprise in analysing the information in a
scientific manner and it additionally makes the file extra presentable. The following is the
pictorial presentation of income, income, content material spends and subscribers of the Netflix:
Profits: This graph constitute the income earned via way of means of Netflix for the
duration of 2012 to 2020 that is in growing order over such length suggests that they're
appearing nicely effectively and turning into the marketplace chief of their respective
industry (Kulas, Roji, and Smith, 2021).
Sales: Similar to the income figures their income extent also are growing over the time
frame really states that they're successfully using their assets and gaining most enjoy the
property they're the usage of in the direction of reaching the commercial enterprise goals.
Paraphrase This Document
Need a fresh take? Get an instant paraphrase of this document with our AI Paraphraser
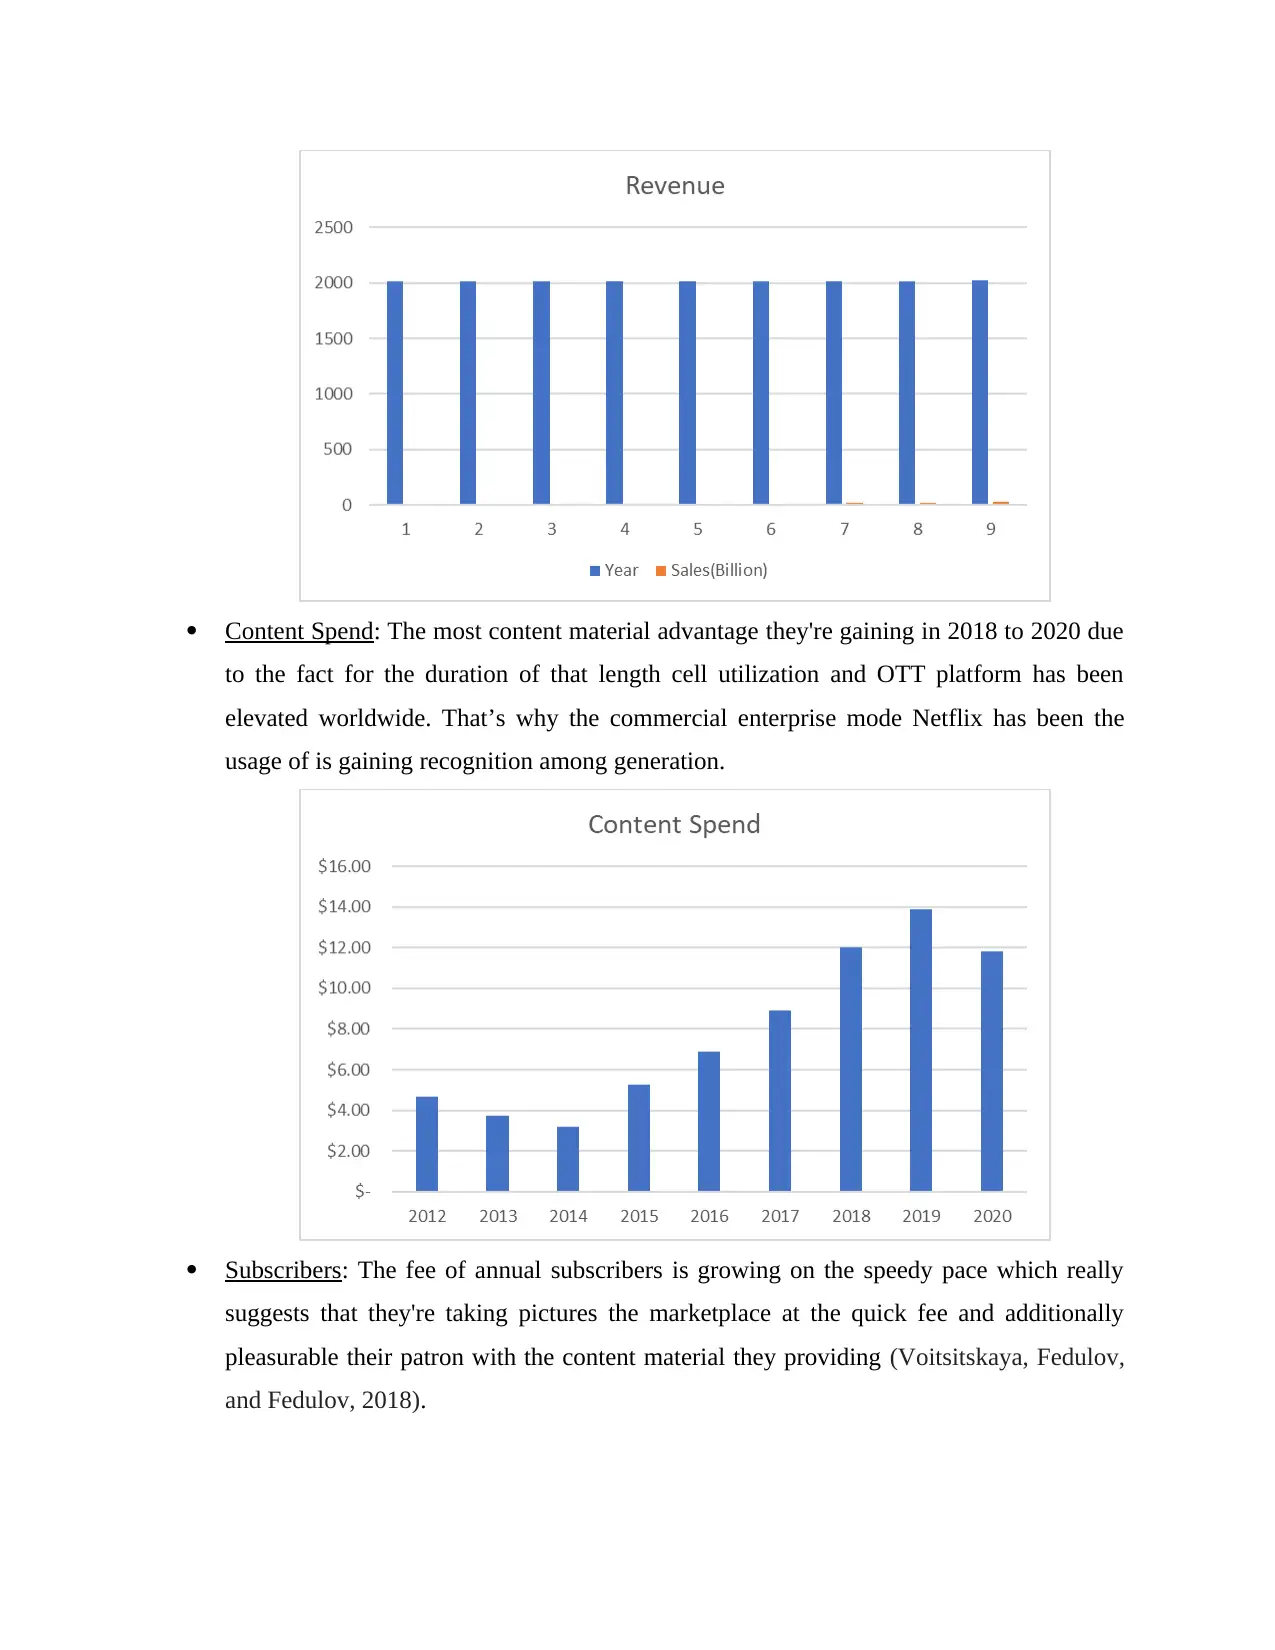
Content Spend: The most content material advantage they're gaining in 2018 to 2020 due
to the fact for the duration of that length cell utilization and OTT platform has been
elevated worldwide. That’s why the commercial enterprise mode Netflix has been the
usage of is gaining recognition among generation.
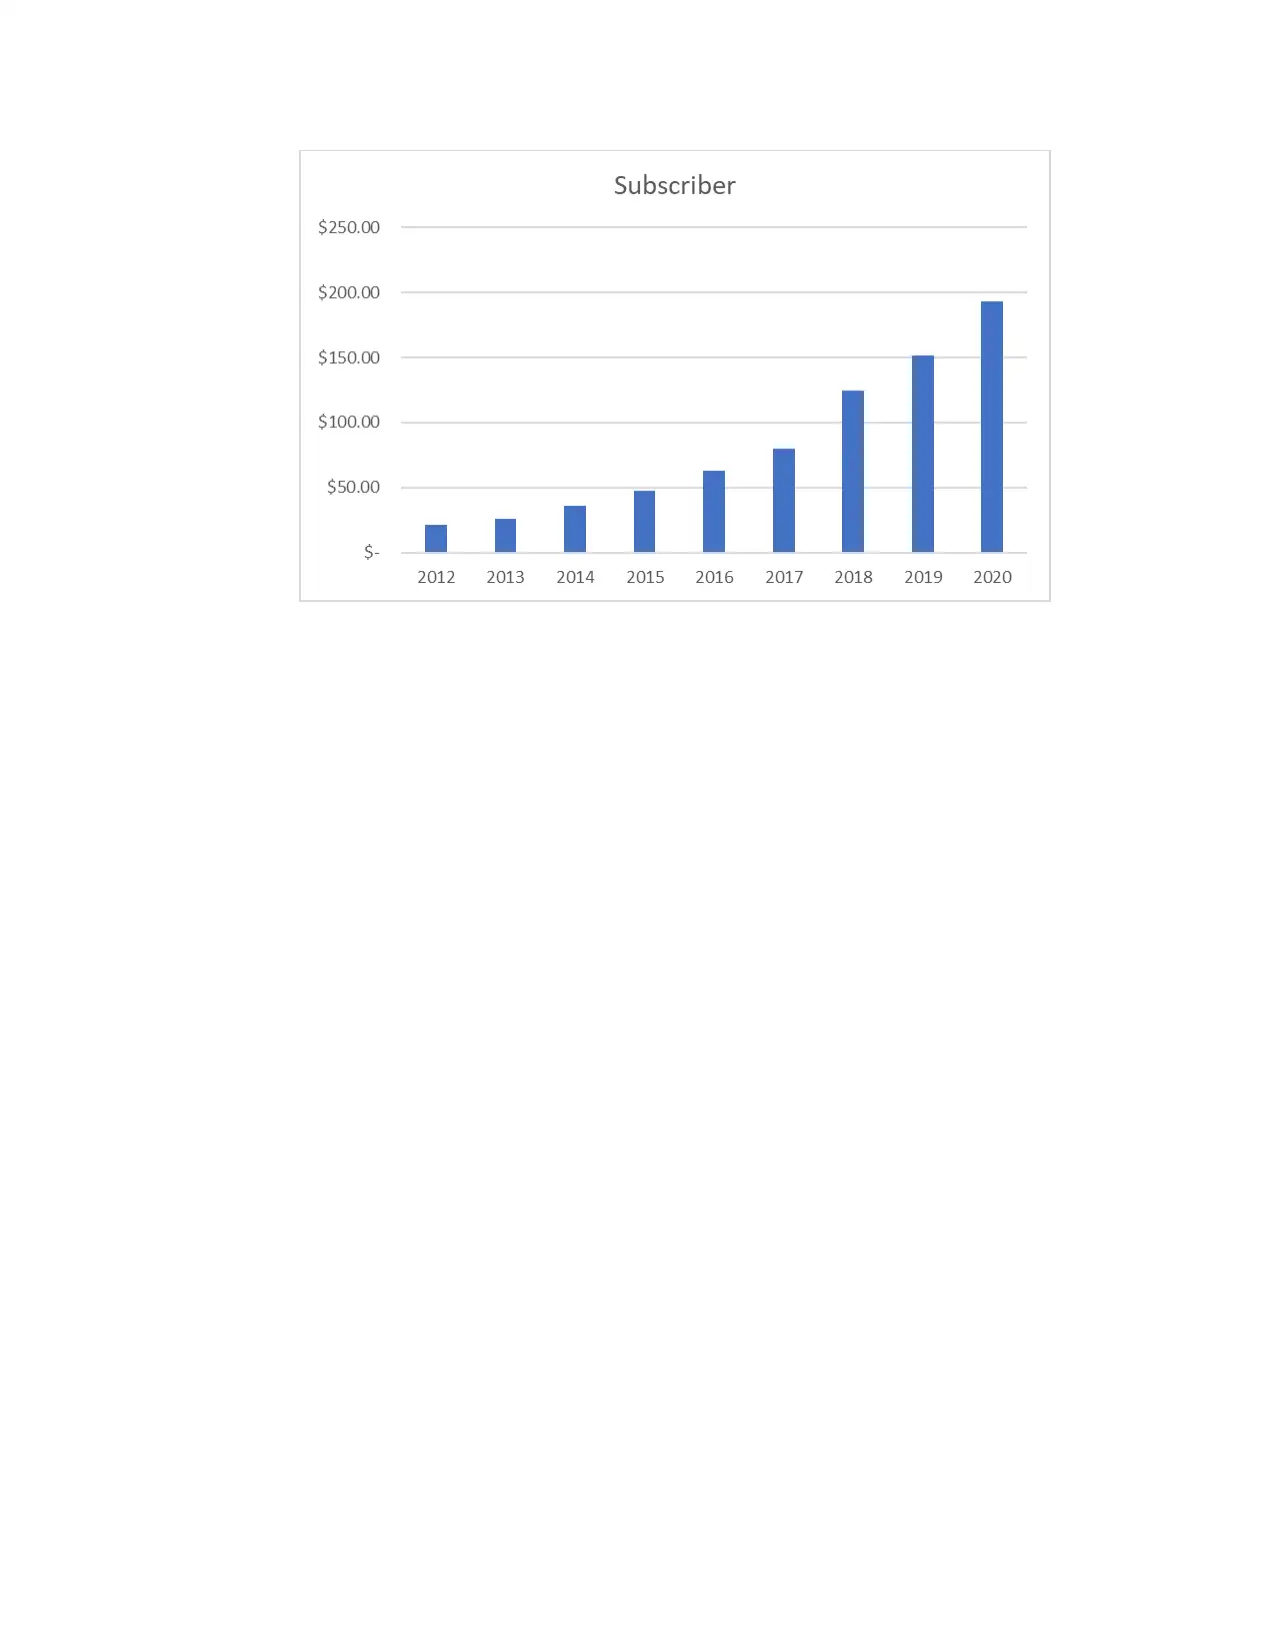
Subscribers: The fee of annual subscribers is growing on the speedy pace which really
suggests that they're taking pictures the marketplace at the quick fee and additionally
pleasurable their patron with the content material they providing (Voitsitskaya, Fedulov,
and Fedulov, 2018).
to the fact for the duration of that length cell utilization and OTT platform has been
elevated worldwide. That’s why the commercial enterprise mode Netflix has been the
usage of is gaining recognition among generation.
Subscribers: The fee of annual subscribers is growing on the speedy pace which really
suggests that they're taking pictures the marketplace at the quick fee and additionally
pleasurable their patron with the content material they providing (Voitsitskaya, Fedulov,
and Fedulov, 2018).
⊘ This is a preview!⊘
Do you want full access?
Subscribe today to unlock all pages.
Trusted by 1+ million students worldwide
CONCLUSION
This record consists of the studies subject matter regarding the Netflix and for analysing
their overall performance the uncooked statistics has been extracted the usage of the net reasserts
in order that their overall performance may be judged accordingly. The principal class for
analysing their overall performance is the income figures, income they made, subscribers they
maintain and their content material spend at some point of the length beginning from 2012 to
2020. After extracting such statistics, statistical evaluation has been finished on such statistics
withinside the shape of calculation of mean, median, and mode. After calculating the same,
statistics manipulation strategies were executed which incorporates maximum, minimum, count,
common and sum characteristic that's executed in excel. After appearing such statistical
equipment at the Netflix statistics interpretation and end has been made in order that their overall
performance may be checked.
Paraphrase This Document
Need a fresh take? Get an instant paraphrase of this document with our AI Paraphraser
REFERENCES
Books and Journals
Attai, L.J., 2020. Student data privacy: Managing vendor relationships. Rowman & Littlefield
Publishers.
Bajaj, S., 2018. Hybrid test automation framework for managing test data. International Journal
of Pure and Applied Mathematics, pp.265-276.
Battiston, S., 2019. The importance of being forward-looking: managing financial stability in the
face of climate risk. Financial Stability Review, (23), pp.39-48.
Chen, C.K., Susanto, H. and Leu, F.Y., 2019. Managing Online Learning: Big Data, Social
Networks, and Cloud Computing. In The Emerging Technology of Big Data (pp. 229-252).
Apple Academic Press.
Khamparia, A., Mondal, R.H., and Kumar, S. eds., 2021. Computational Intelligence for
Managing Pandemics (Vol. 5). Walter de Gruyter GmbH & Co KG.
Khojasteh Aliabadi, H.A., Daei-Karimzadeh, S., and Zamani Boroujeni, F., 2022. Developing a
model for managing the risk assessment of import declarations in customs based on data
analysis techniques. Advances in Mathematical Finance and Applications.
Kulas, J.T., Roji, R.G.P.P. and Smith, A.M., 2021. IBM SPSS Essentials: Managing and
Analyzing Social Sciences Data. John Wiley & Sons.
Voitsitskaya, A., Fedulov, A. and Fedulov, Y., 2018, September. Resource managing method for
parallel computing systems using fuzzy data preprocessing for input tasks parameters.
In International Conference on Intelligent Information Technologies for Industry (pp. 410-
419). Springer, Cham.
1 out of 11
Related Documents


Your All-in-One AI-Powered Toolkit for Academic Success.
+13062052269
info@desklib.com
Available 24*7 on WhatsApp / Email
![[object Object]](/_next/static/media/star-bottom.7253800d.svg)
Unlock your academic potential
Copyright © 2020–2026 A2Z Services. All Rights Reserved. Developed and managed by ZUCOL.