Comprehensive Financial Analysis of Netflix: 2020-2021 Performance
VerifiedAdded on 2023/01/18
|20
|4474
|83
Report
AI Summary
This report provides a comprehensive financial analysis of Netflix, examining its performance from 2020 to 2021. It delves into key aspects such as revenue generation, subscriber growth trends, and the impact of significant events like the COVID-19 pandemic. The report assesses Netflix's financial health through detailed ratio analysis, including profitability, liquidity, and gearing ratios. It also explores the company's dividend policy, sources of finance, and capital structure. The analysis includes an examination of subscriber development, the impact of selling products, and the company's sources of finance, evaluating the company's financial standing, risk management, and overall efficiency. The report also considers the company's gearing ratio and its sources of finance, concluding with an assessment of Netflix's financial performance and future prospects.
1
Name:
Student I.D:
Date:
Name:
Student I.D:
Date:
Paraphrase This Document
Need a fresh take? Get an instant paraphrase of this document with our AI Paraphraser
Table of Contents
INTRODUCTION...............................................................................................................3
1. Company Name:.........................................................................................................3
1.1-Selling Products.......................................................................................................3
1.2- Revenue of the Company.......................................................................................4
1.3- Purpose...................................................................................................................4
Section A............................................................................................................................5
1- Development one: Subscribers growth......................................................................5
2- Development two: Covid19........................................................................................6
Section B............................................................................................................................7
2. Dividend Policy........................................................................................................7
Netflix Dividend...............................................................................................................7
Section C: Ratio Analysis................................................................................................10
1. Profitability Ratios:.................................................................................................10
Return on Capital Employed..............................................................................10
Operating Profit margin......................................................................................10
Return on Equity.................................................................................................11
2. Liquidity Ratio:...........................................................................................................11
Current ratio...........................................................................................................11
Quick ratio..............................................................................................................12
4. Gearing Ratio:...........................................................................................................13
Interest Coverage Ratio.........................................................................................13
5. Investment Ratio.......................................................................................................14
Earnings Per Share...............................................................................................14
Conclusion.......................................................................................................................14
References.......................................................................................................................15
Appendices......................................................................................................................20
2
INTRODUCTION
1. Company Name:
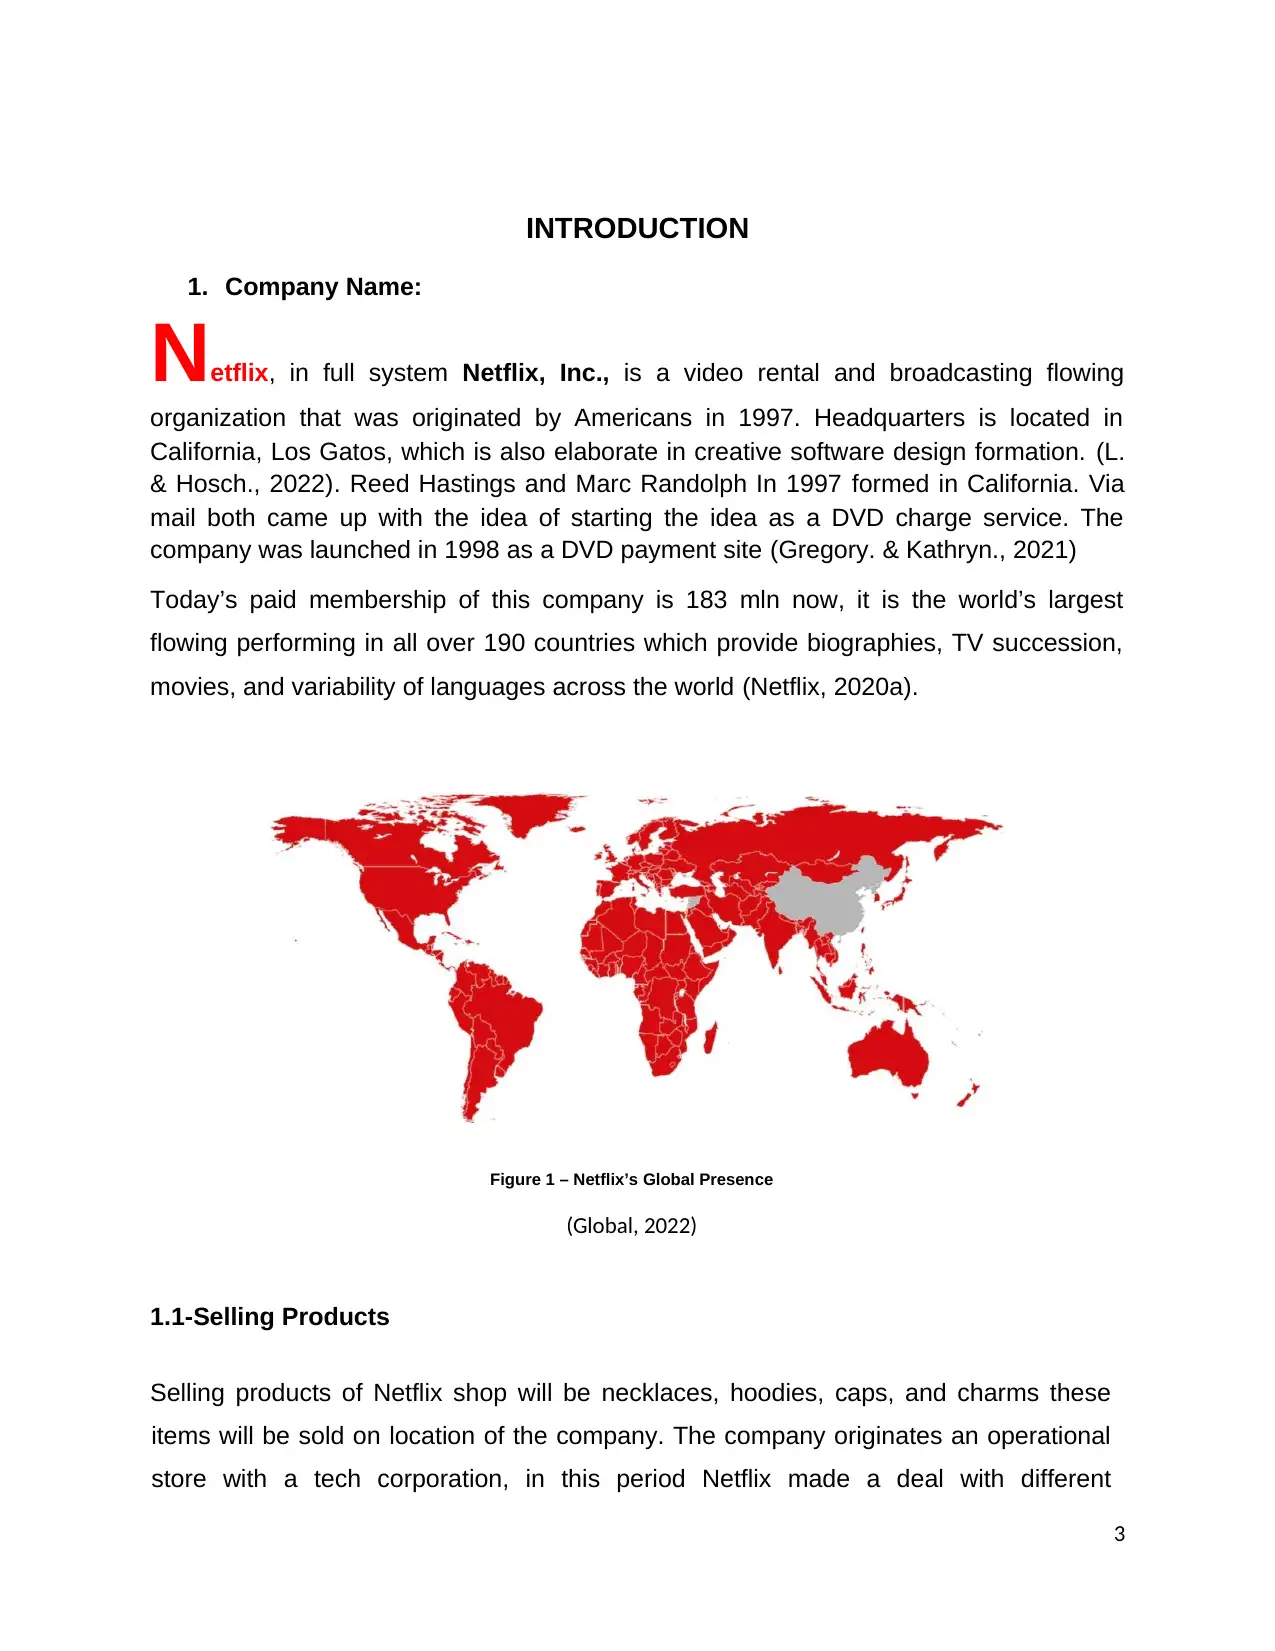
Netflix, in full system Netflix, Inc., is a video rental and broadcasting flowing
organization that was originated by Americans in 1997. Headquarters is located in
California, Los Gatos, which is also elaborate in creative software design formation. (L.
& Hosch., 2022). Reed Hastings and Marc Randolph In 1997 formed in California. Via
mail both came up with the idea of starting the idea as a DVD charge service. The
company was launched in 1998 as a DVD payment site (Gregory. & Kathryn., 2021)
Today’s paid membership of this company is 183 mln now, it is the world’s largest
flowing performing in all over 190 countries which provide biographies, TV succession,
movies, and variability of languages across the world (Netflix, 2020a).
Figure 1 – Netflix’s Global Presence
(Global, 2022)
1.1-Selling Products
Selling products of Netflix shop will be necklaces, hoodies, caps, and charms these
items will be sold on location of the company. The company originates an operational
store with a tech corporation, in this period Netflix made a deal with different
3
1. Company Name:
Netflix, in full system Netflix, Inc., is a video rental and broadcasting flowing
organization that was originated by Americans in 1997. Headquarters is located in
California, Los Gatos, which is also elaborate in creative software design formation. (L.
& Hosch., 2022). Reed Hastings and Marc Randolph In 1997 formed in California. Via
mail both came up with the idea of starting the idea as a DVD charge service. The
company was launched in 1998 as a DVD payment site (Gregory. & Kathryn., 2021)
Today’s paid membership of this company is 183 mln now, it is the world’s largest
flowing performing in all over 190 countries which provide biographies, TV succession,
movies, and variability of languages across the world (Netflix, 2020a).
Figure 1 – Netflix’s Global Presence
(Global, 2022)
1.1-Selling Products
Selling products of Netflix shop will be necklaces, hoodies, caps, and charms these
items will be sold on location of the company. The company originates an operational
store with a tech corporation, in this period Netflix made a deal with different
3
⊘ This is a preview!⊘
Do you want full access?
Subscribe today to unlock all pages.
Trusted by 1+ million students worldwide
organizations such as; Walmart, Sephora, and products which is selling online items
related to films and series like toys, clothes, and housewares. (Maheshwari., et al.,
2022).
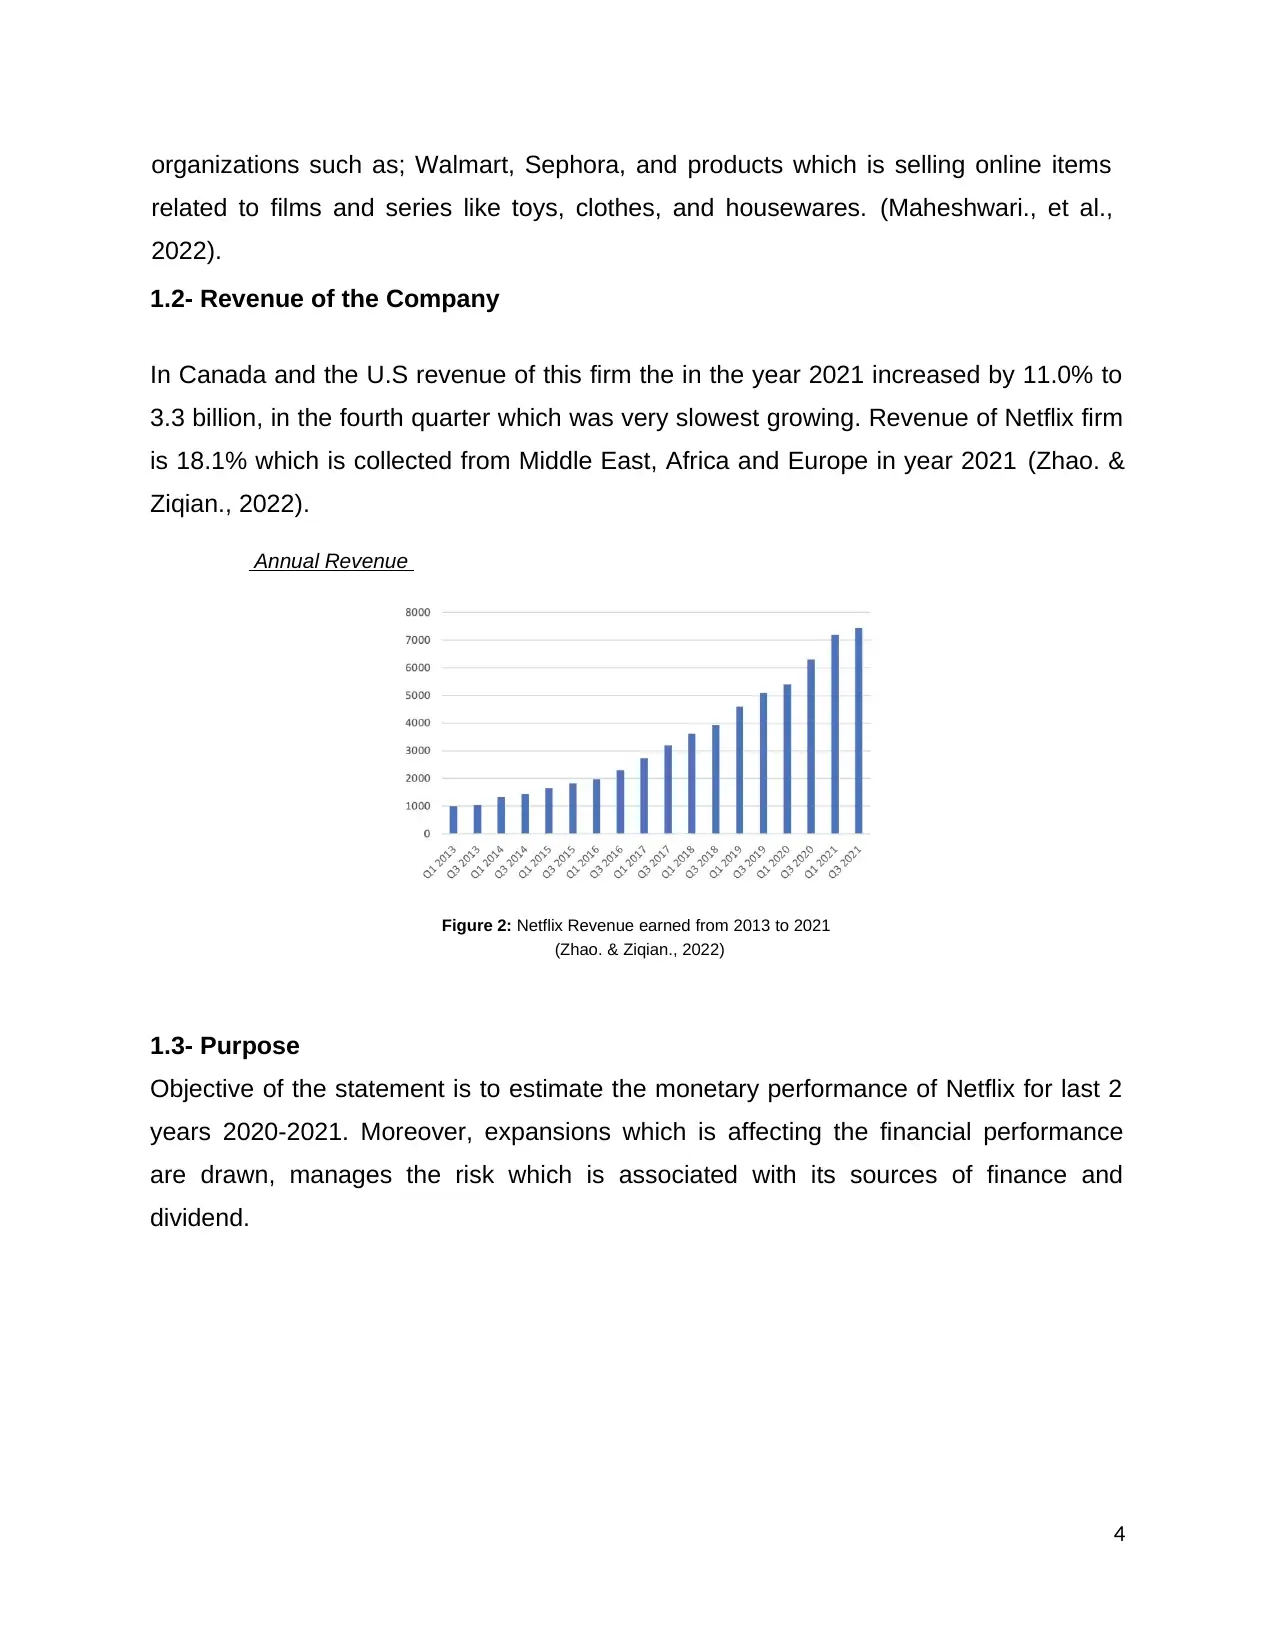
1.2- Revenue of the Company
In Canada and the U.S revenue of this firm the in the year 2021 increased by 11.0% to
3.3 billion, in the fourth quarter which was very slowest growing. Revenue of Netflix firm
is 18.1% which is collected from Middle East, Africa and Europe in year 2021 (Zhao. &
Ziqian., 2022).
Annual Revenue
Figure 2: Netflix Revenue earned from 2013 to 2021
(Zhao. & Ziqian., 2022)
1.3- Purpose
Objective of the statement is to estimate the monetary performance of Netflix for last 2
years 2020-2021. Moreover, expansions which is affecting the financial performance
are drawn, manages the risk which is associated with its sources of finance and
dividend.
4
related to films and series like toys, clothes, and housewares. (Maheshwari., et al.,
2022).
1.2- Revenue of the Company
In Canada and the U.S revenue of this firm the in the year 2021 increased by 11.0% to
3.3 billion, in the fourth quarter which was very slowest growing. Revenue of Netflix firm
is 18.1% which is collected from Middle East, Africa and Europe in year 2021 (Zhao. &
Ziqian., 2022).
Annual Revenue
Figure 2: Netflix Revenue earned from 2013 to 2021
(Zhao. & Ziqian., 2022)
1.3- Purpose
Objective of the statement is to estimate the monetary performance of Netflix for last 2
years 2020-2021. Moreover, expansions which is affecting the financial performance
are drawn, manages the risk which is associated with its sources of finance and
dividend.
4
Paraphrase This Document
Need a fresh take? Get an instant paraphrase of this document with our AI Paraphraser
Section A
1- Development one: Subscribers growth
One event that has affected financial performance of Netflix, in second quarter of 2020,
losses one million subscribers, but it was improved than the two million predictions
(DEGGANS, 2022).
Subscribers Development
Subscribers count as of 2022 is 221.6 million, and generated a $7.87 billion dollar
revenue in the first quarter. This organization supported subscription plan with Microsoft
and introduce cheaper ad. In 2021, company made 29.698 billion revenues. Netflix have
6000 titles catalog in the US. Almost 80% popular shows in the US owned by Netflix in
2020 (Ruby, 2022).
Development effect on financial performance
The firm additional net was 420,000 spilling clients in the U.S. and 8.33 million foreign in
the year 2019, for a total of 8.76 million net improves. Netflix had formerly prediction a
total of 7.6 million net waged added to 600,000 in the U.S. and 7.0 million globally
(Spangler, 2020).
Netflix forwarded income of $5.47 billion and Earnings per share of $1.30. Analysts
anticipated $5.45 billion in income and EPS of 53 per cent. Company documented a
$437.6 million tax profit, illumination that it had over-accrued U.S. tax expenditures
through the initial tierce quarters of 2019. In the first quarter of 2020, Netflix forecasts
total waged net additions of seven million. This is down from Wall Street analysts
forecast of 7.86 million and comes from a record net addition of 9.6 million in 2019.
Netflix's 2020 financial guidance calls for income of $5.73 billion, analyst consensus
expectations of $5.76 billion earning $1.66 per share, or $1.19 each share by Wall
Street estimates (Spangler, 2020).
5
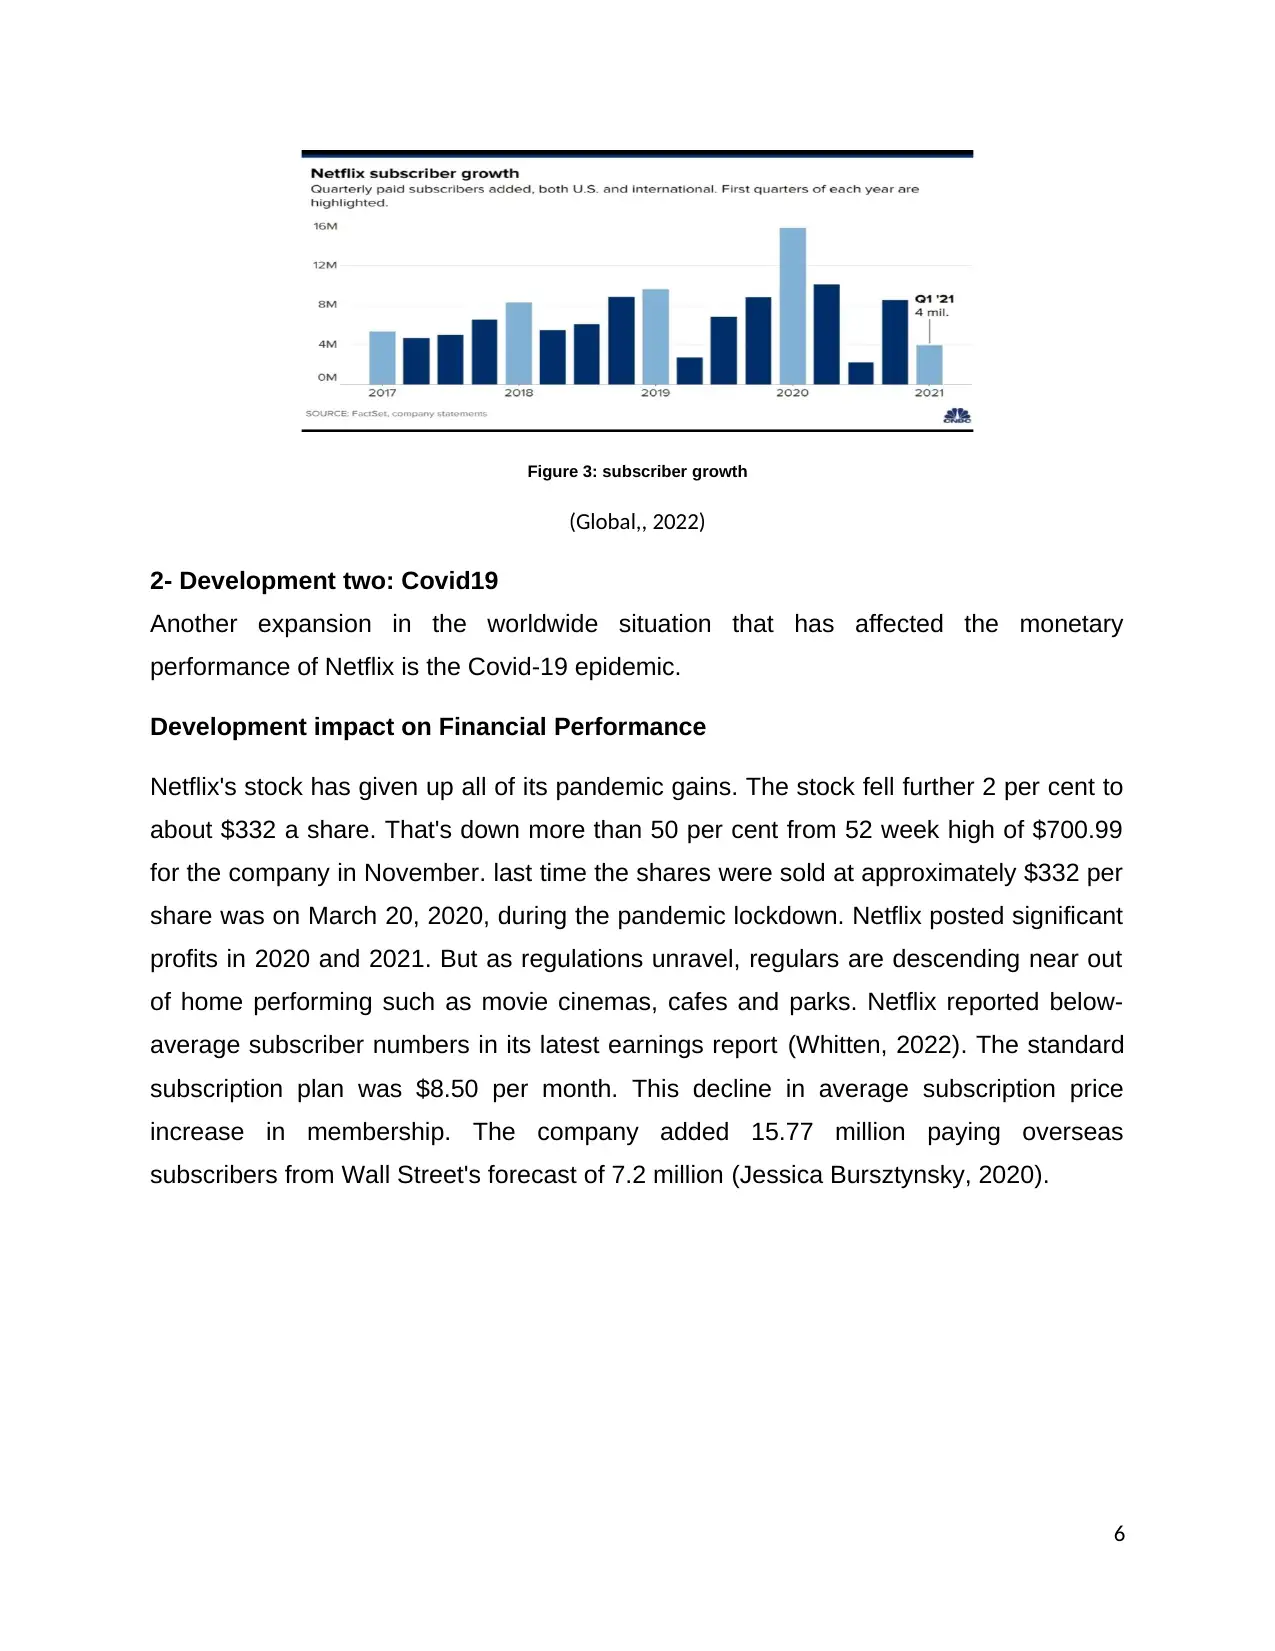
Figure 3: subscriber growth
(Global,, 2022)
2- Development two: Covid19
Another expansion in the worldwide situation that has affected the monetary
performance of Netflix is the Covid-19 epidemic.
Development impact on Financial Performance
Netflix's stock has given up all of its pandemic gains. The stock fell further 2 per cent to
about $332 a share. That's down more than 50 per cent from 52 week high of $700.99
for the company in November. last time the shares were sold at approximately $332 per
share was on March 20, 2020, during the pandemic lockdown. Netflix posted significant
profits in 2020 and 2021. But as regulations unravel, regulars are descending near out
of home performing such as movie cinemas, cafes and parks. Netflix reported below-
average subscriber numbers in its latest earnings report (Whitten, 2022). The standard
subscription plan was $8.50 per month. This decline in average subscription price
increase in membership. The company added 15.77 million paying overseas
subscribers from Wall Street's forecast of 7.2 million (Jessica Bursztynsky, 2020).
6
⊘ This is a preview!⊘
Do you want full access?
Subscribe today to unlock all pages.
Trusted by 1+ million students worldwide
Section B
2. Dividend Policy
Dividend policies are financial decisions that include the rate of dividends, the frequency
and the decision to pay dividends. (Tamplin, 2022),(Shivani Chaluvadi, 2022).
Netflix Dividend
Since 2002, the company going public but currently does not pay a dividend. This does
not mean that stakeholders always avoid non-dividend stocks. Many tech stocks have
matured and started paying dividends over the last decade and are now posting strong
earnings. Netflix will pay a dividend if investors may wonder. This caused in tremendous
sales development over the last few years. Netflix's annual revenue more than tripled
from 2016 to 2021, reaching $29.7 billion last year. EPS increased in 2016 from $0.43
to $11.24 in 2021. The company would consider paid a dividend to shareholders.
Projections for 2022 put at $10.97 per share for Netflix, with an earnings yield of 4.8%.
In other words, if Netflix were to pay almost all of its annual earnings per share, it would
yield a dividend yield of 4.8%, which of course it doesn't. The cost of content is high,
which is a big reason why Netflix doesn't pay dividends (Ciura, 2022).
Pay a bonus, must have the necessary cash flow to cover the payment. Corporations
that do not deliver reliable free cash flow will scrap to find the return cash to
shareholders each quarter. Company could technically pay dividends on that basis, but
Netflix continues to use cash flow for growth initiatives (Ciura, 2022).
Netflix has unsuccessful to produce consistently optimistic growth of free cash flow.
Company imagines positive cash flow this year and beyond, which is an improvement
given Netflix's typical tradition of recording negative free cash flow. Using significant
capital will have to entree the debt market to continue spending. This will impact the
balance sheet of the company and pose another obstacle to future dividend payments.
Netflix ended its latest quarter with long-term debt of $14.23 billion and cash and
equivalents It was $5.82 billion (Ciura, 2022).
7
Paraphrase This Document
Need a fresh take? Get an instant paraphrase of this document with our AI Paraphraser
Dividend Theory of Netflix
The dividend “Capital structure” theory applies here. CS is how a business funds its
entire business, this comprises equity and debt. In 1958, Capital structure theory
created by Modigliani and Miller. Company's cost of funds is the capital cost. The
interest rates are achieved by looking at what returns investors can get on alternative
securities with the same level of risk. Netflix has just improved its debt-to-equity ratio
(Global , 2018).
3.1- Sources of Finance
Funding sources are the establishment of funds to meet short-term working capital and
fixed asset needs, as well as other long-term investments (Global, 2022).
Netflix sources of finance
1. Membership Fees
Main source of revenue is monthly contributions. Netflix offers different price points, so
customers can choose the plan that best suits their needs. The basic plan is $9.99 per
month. This membership allows users to watch and download her one screen at a time
to their phone or tablet. The standard plan is $15.50 and gives him access to two
screens at the same time and can be downloaded to two phones or tablets. HD is also
available for users (Marte, 2022).
2. DVD rental
From 1998, this company has shipped five billion DVDs to US regulars. Netflix
continues to make income with its DVD service in the US. Customers can log into
dvd.netflix.com and browse thousands of movies and show listings. Customers select
the content they want to rent and the discs are mailed within two business days.
Returns are free and there are no overage or late fees (Marte, 2022).
8
Gearing Ratio
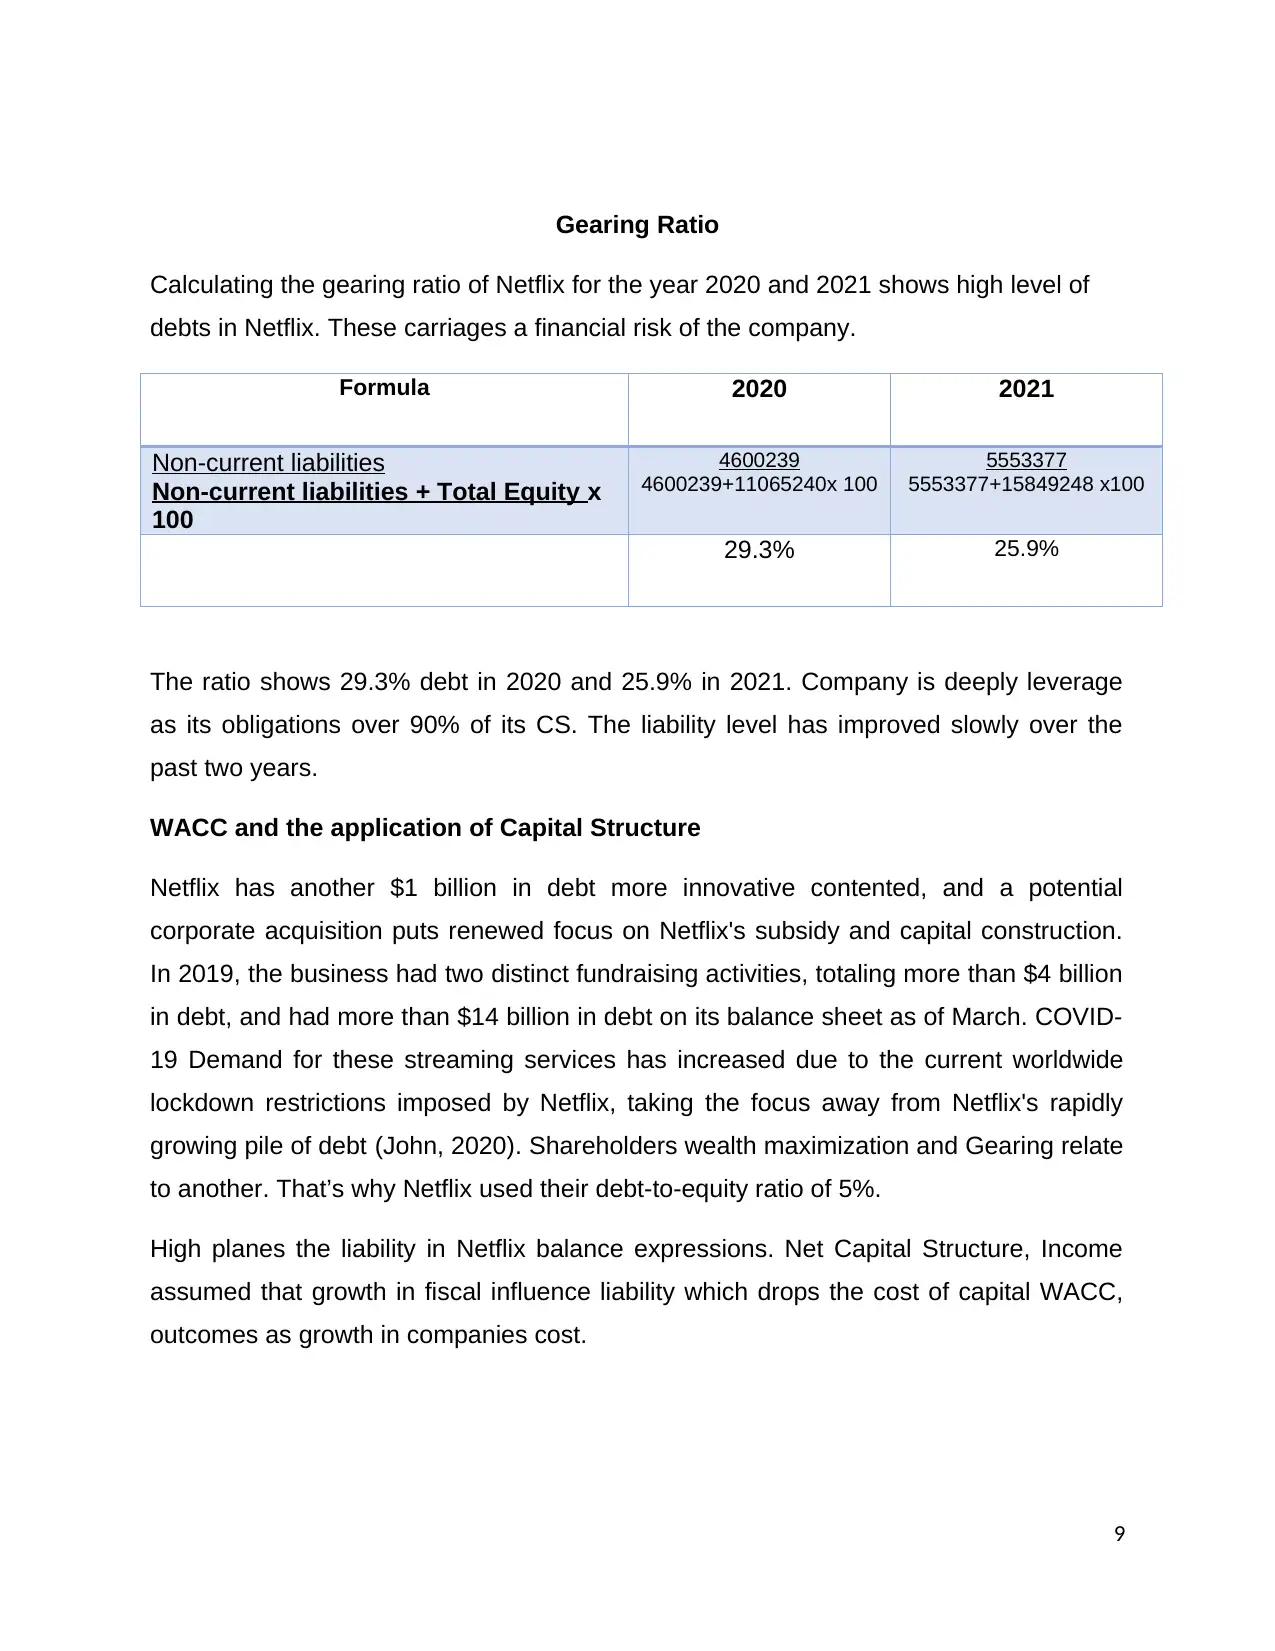
Calculating the gearing ratio of Netflix for the year 2020 and 2021 shows high level of
debts in Netflix. These carriages a financial risk of the company.
Formula 2020 2021
Non-current liabilities
Non-current liabilities + Total Equity x
100
4600239
4600239+11065240x 100
5553377
5553377+15849248 x100
29.3% 25.9%
The ratio shows 29.3% debt in 2020 and 25.9% in 2021. Company is deeply leverage
as its obligations over 90% of its CS. The liability level has improved slowly over the
past two years.
WACC and the application of Capital Structure
Netflix has another $1 billion in debt more innovative contented, and a potential
corporate acquisition puts renewed focus on Netflix's subsidy and capital construction.
In 2019, the business had two distinct fundraising activities, totaling more than $4 billion
in debt, and had more than $14 billion in debt on its balance sheet as of March. COVID-
19 Demand for these streaming services has increased due to the current worldwide
lockdown restrictions imposed by Netflix, taking the focus away from Netflix's rapidly
growing pile of debt (John, 2020). Shareholders wealth maximization and Gearing relate
to another. That’s why Netflix used their debt-to-equity ratio of 5%.
High planes the liability in Netflix balance expressions. Net Capital Structure, Income
assumed that growth in fiscal influence liability which drops the cost of capital WACC,
outcomes as growth in companies cost.
9
⊘ This is a preview!⊘
Do you want full access?
Subscribe today to unlock all pages.
Trusted by 1+ million students worldwide
Section C: Ratio Analysis
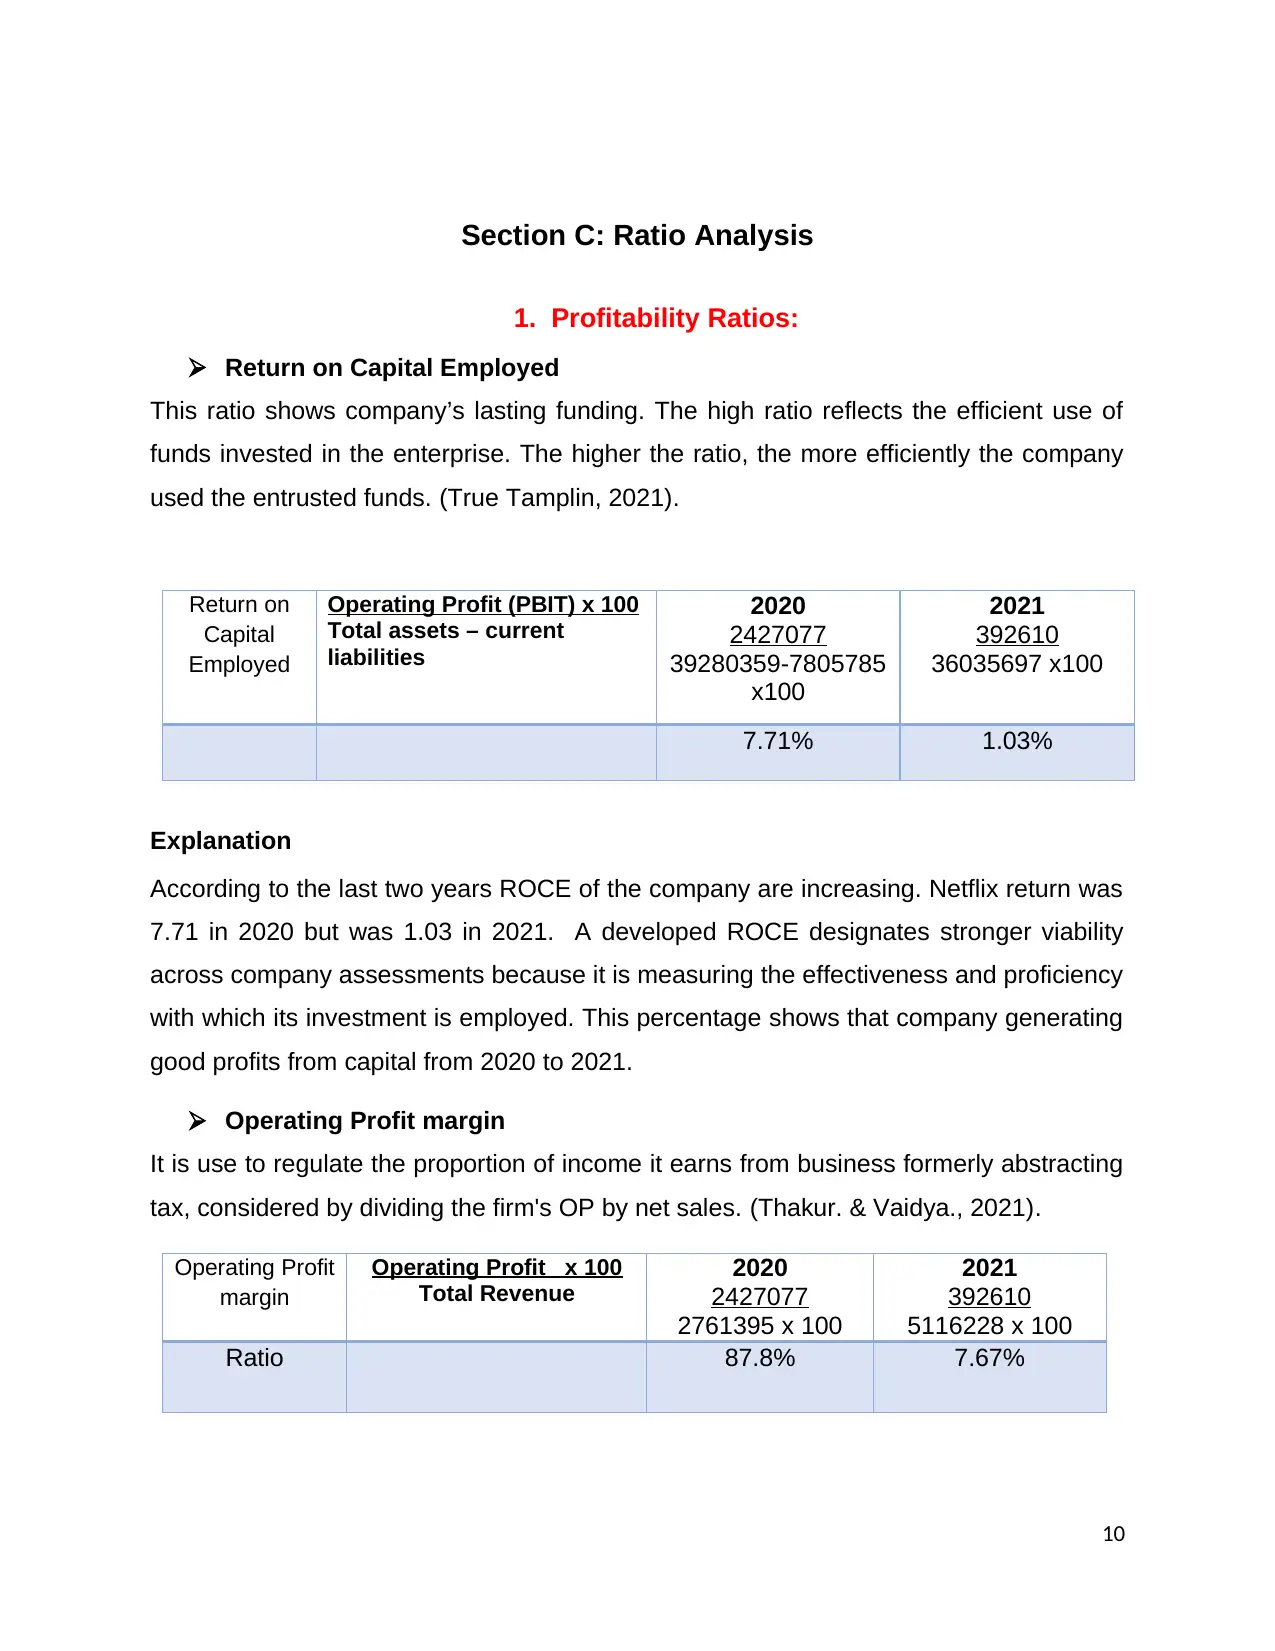
1. Profitability Ratios:
Return on Capital Employed
This ratio shows company’s lasting funding. The high ratio reflects the efficient use of
funds invested in the enterprise. The higher the ratio, the more efficiently the company
used the entrusted funds. (True Tamplin, 2021).
Return on
Capital
Employed
Operating Profit (PBIT) x 100
Total assets – current
liabilities
2020
2427077
39280359-7805785
x100
2021
392610
36035697 x100
7.71% 1.03%
Explanation
According to the last two years ROCE of the company are increasing. Netflix return was
7.71 in 2020 but was 1.03 in 2021. A developed ROCE designates stronger viability
across company assessments because it is measuring the effectiveness and proficiency
with which its investment is employed. This percentage shows that company generating
good profits from capital from 2020 to 2021.
Operating Profit margin
It is use to regulate the proportion of income it earns from business formerly abstracting
tax, considered by dividing the firm's OP by net sales. (Thakur. & Vaidya., 2021).
Operating Profit
margin
Operating Profit x 100
Total Revenue
2020
2427077
2761395 x 100
2021
392610
5116228 x 100
Ratio 87.8% 7.67%
10
Paraphrase This Document
Need a fresh take? Get an instant paraphrase of this document with our AI Paraphraser
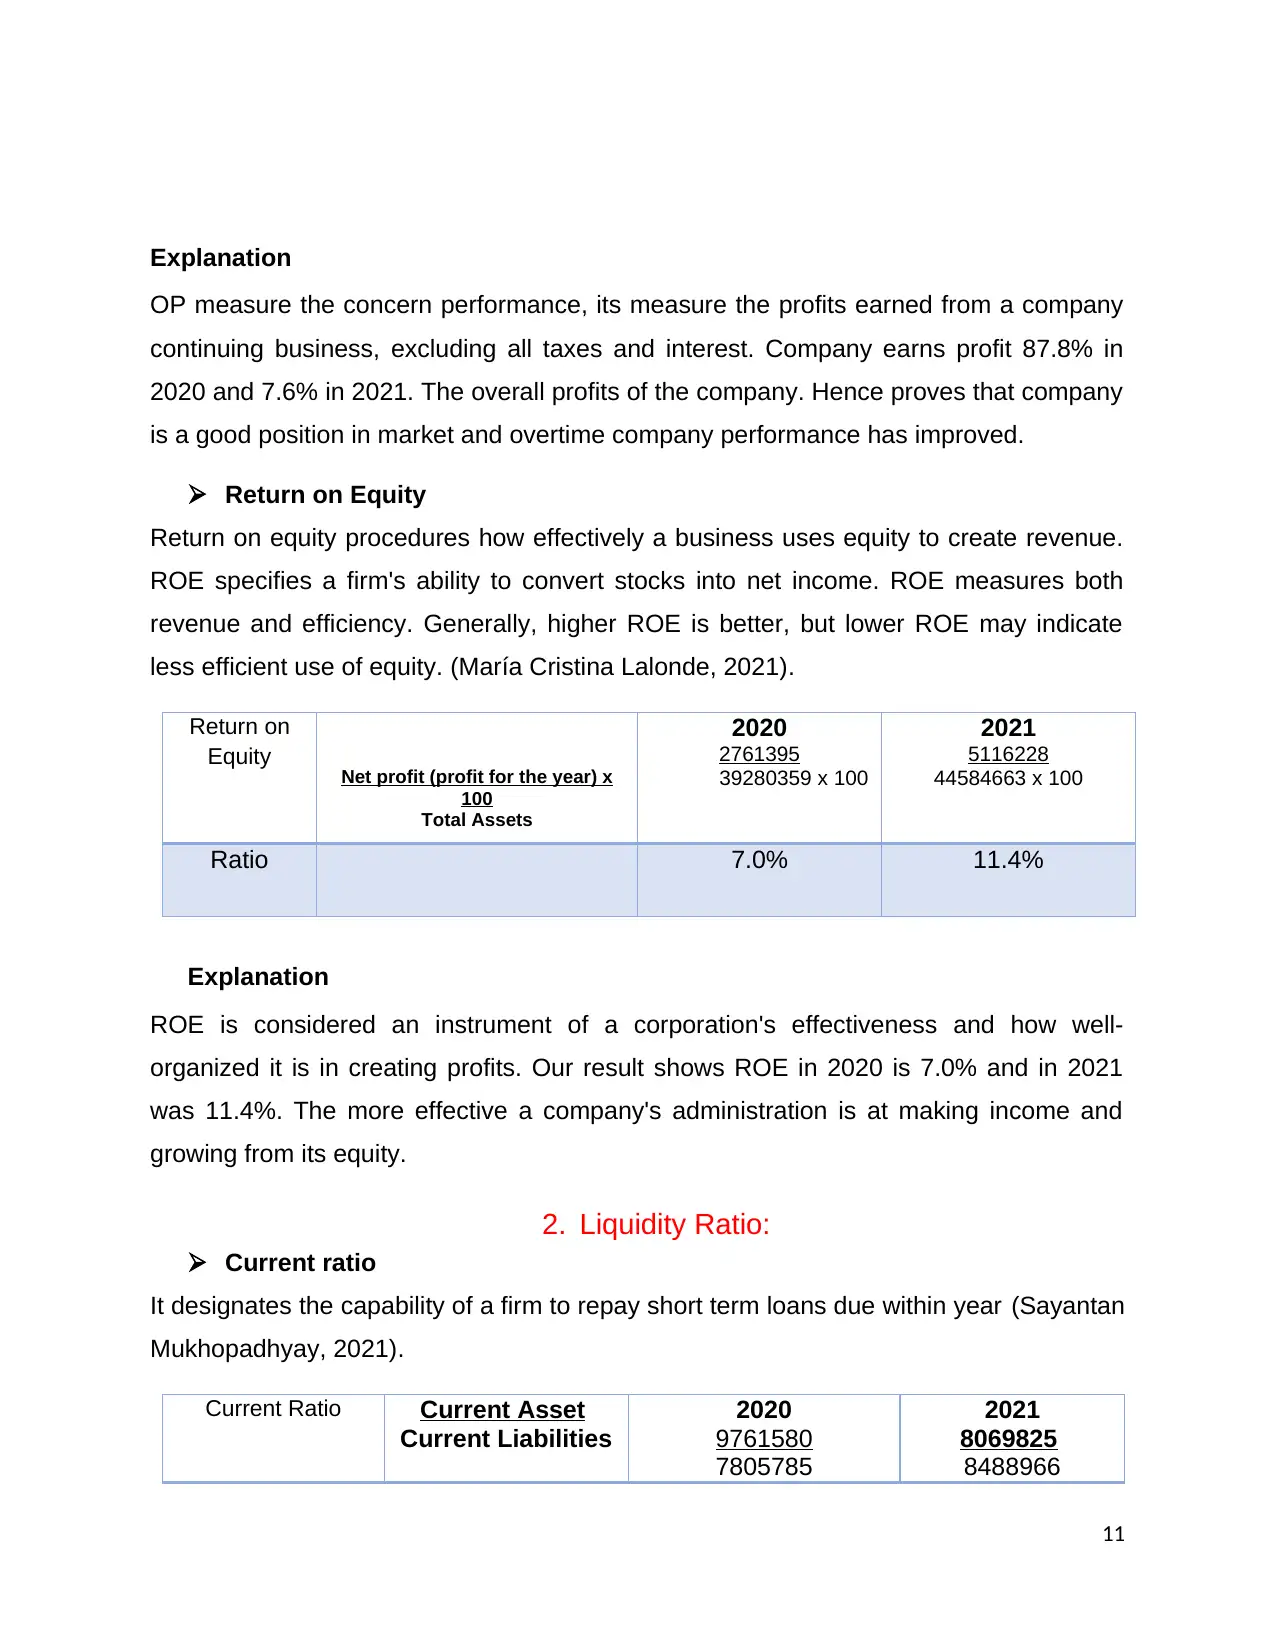
Explanation
OP measure the concern performance, its measure the profits earned from a company
continuing business, excluding all taxes and interest. Company earns profit 87.8% in
2020 and 7.6% in 2021. The overall profits of the company. Hence proves that company
is a good position in market and overtime company performance has improved.
Return on Equity
Return on equity procedures how effectively a business uses equity to create revenue.
ROE specifies a firm's ability to convert stocks into net income. ROE measures both
revenue and efficiency. Generally, higher ROE is better, but lower ROE may indicate
less efficient use of equity. (María Cristina Lalonde, 2021).
Return on
Equity Net profit (profit for the year) x
100
Total Assets
2020
2761395
39280359 x 100
2021
5116228
44584663 x 100
Ratio 7.0% 11.4%
Explanation
ROE is considered an instrument of a corporation's effectiveness and how well-
organized it is in creating profits. Our result shows ROE in 2020 is 7.0% and in 2021
was 11.4%. The more effective a company's administration is at making income and
growing from its equity.
2. Liquidity Ratio:
Current ratio
It designates the capability of a firm to repay short term loans due within year (Sayantan
Mukhopadhyay, 2021).
Current Ratio Current Asset
Current Liabilities
2020
9761580
7805785
2021
8069825
8488966
11
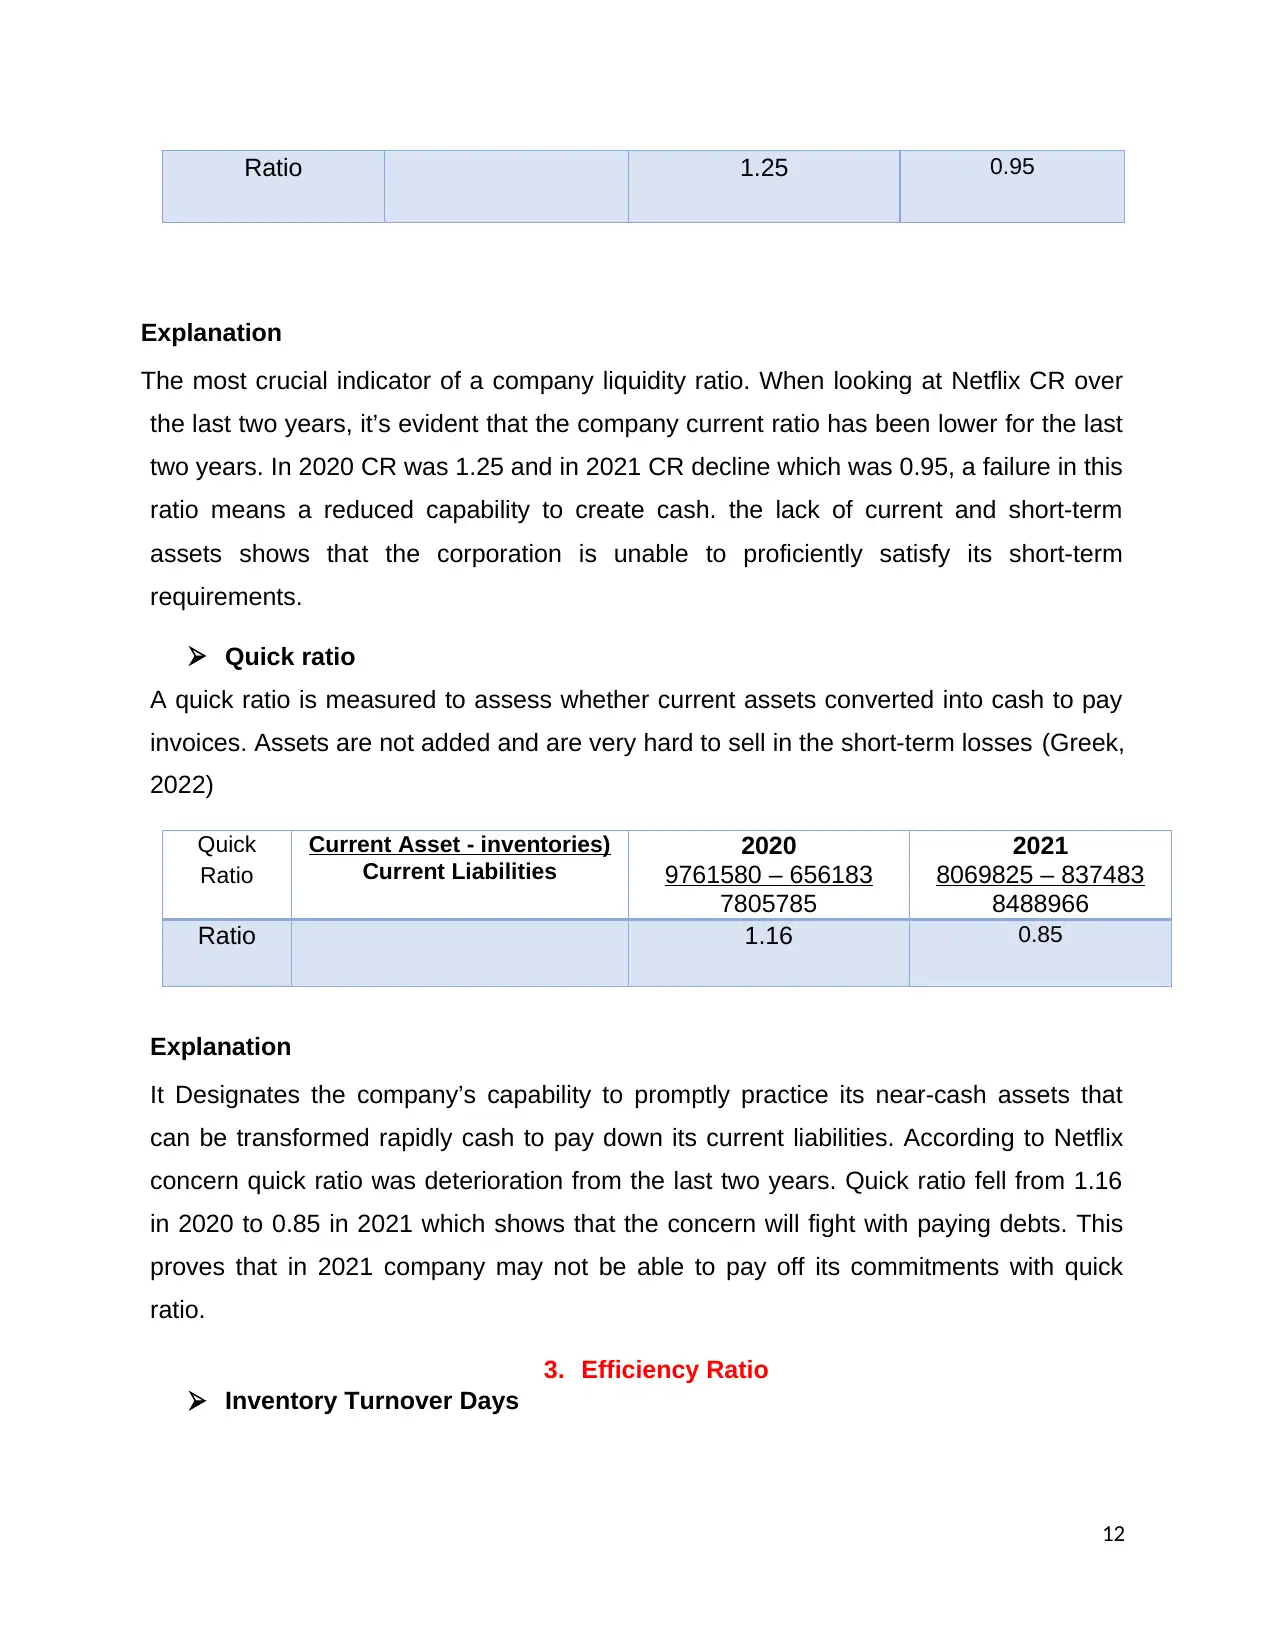
Ratio 1.25 0.95
Explanation
The most crucial indicator of a company liquidity ratio. When looking at Netflix CR over
the last two years, it’s evident that the company current ratio has been lower for the last
two years. In 2020 CR was 1.25 and in 2021 CR decline which was 0.95, a failure in this
ratio means a reduced capability to create cash. the lack of current and short-term
assets shows that the corporation is unable to proficiently satisfy its short-term
requirements.
Quick ratio
A quick ratio is measured to assess whether current assets converted into cash to pay
invoices. Assets are not added and are very hard to sell in the short-term losses (Greek,
2022)
Quick
Ratio
Current Asset - inventories)
Current Liabilities
2020
9761580 – 656183
7805785
2021
8069825 – 837483
8488966
Ratio 1.16 0.85
Explanation
It Designates the company’s capability to promptly practice its near-cash assets that
can be transformed rapidly cash to pay down its current liabilities. According to Netflix
concern quick ratio was deterioration from the last two years. Quick ratio fell from 1.16
in 2020 to 0.85 in 2021 which shows that the concern will fight with paying debts. This
proves that in 2021 company may not be able to pay off its commitments with quick
ratio.
3. Efficiency Ratio
Inventory Turnover Days
12
Explanation
The most crucial indicator of a company liquidity ratio. When looking at Netflix CR over
the last two years, it’s evident that the company current ratio has been lower for the last
two years. In 2020 CR was 1.25 and in 2021 CR decline which was 0.95, a failure in this
ratio means a reduced capability to create cash. the lack of current and short-term
assets shows that the corporation is unable to proficiently satisfy its short-term
requirements.
Quick ratio
A quick ratio is measured to assess whether current assets converted into cash to pay
invoices. Assets are not added and are very hard to sell in the short-term losses (Greek,
2022)
Quick
Ratio
Current Asset - inventories)
Current Liabilities
2020
9761580 – 656183
7805785
2021
8069825 – 837483
8488966
Ratio 1.16 0.85
Explanation
It Designates the company’s capability to promptly practice its near-cash assets that
can be transformed rapidly cash to pay down its current liabilities. According to Netflix
concern quick ratio was deterioration from the last two years. Quick ratio fell from 1.16
in 2020 to 0.85 in 2021 which shows that the concern will fight with paying debts. This
proves that in 2021 company may not be able to pay off its commitments with quick
ratio.
3. Efficiency Ratio
Inventory Turnover Days
12
⊘ This is a preview!⊘
Do you want full access?
Subscribe today to unlock all pages.
Trusted by 1+ million students worldwide
1 out of 20
Related Documents


Your All-in-One AI-Powered Toolkit for Academic Success.
+13062052269
info@desklib.com
Available 24*7 on WhatsApp / Email
![[object Object]](/_next/static/media/star-bottom.7253800d.svg)
Unlock your academic potential
Copyright © 2020–2026 A2Z Services. All Rights Reserved. Developed and managed by ZUCOL.