Netflix Subscribers Growth (2003-2021): Data Analysis in MS Excel

Verified

Added on  2023/06/11

|11
|529
|81
Report
AI Summary
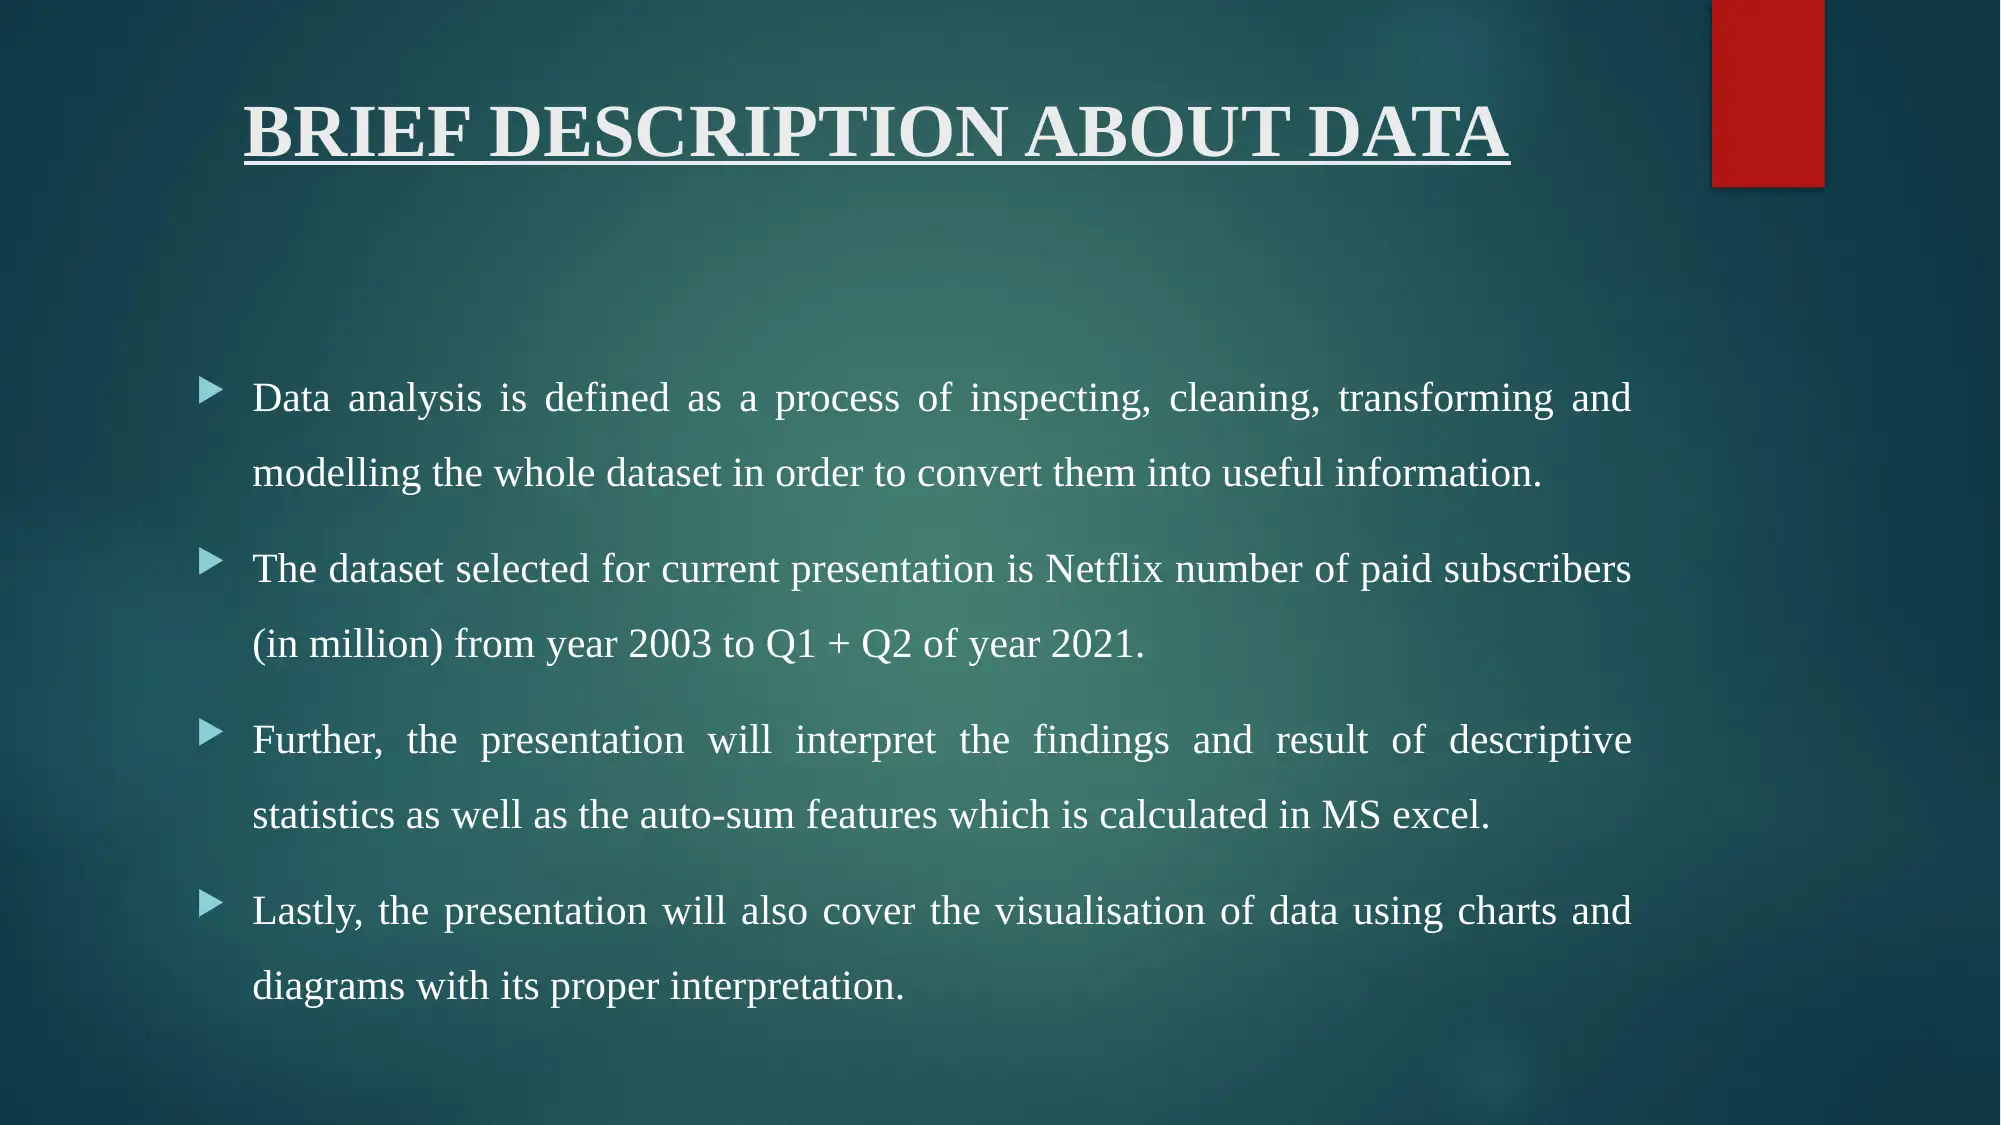
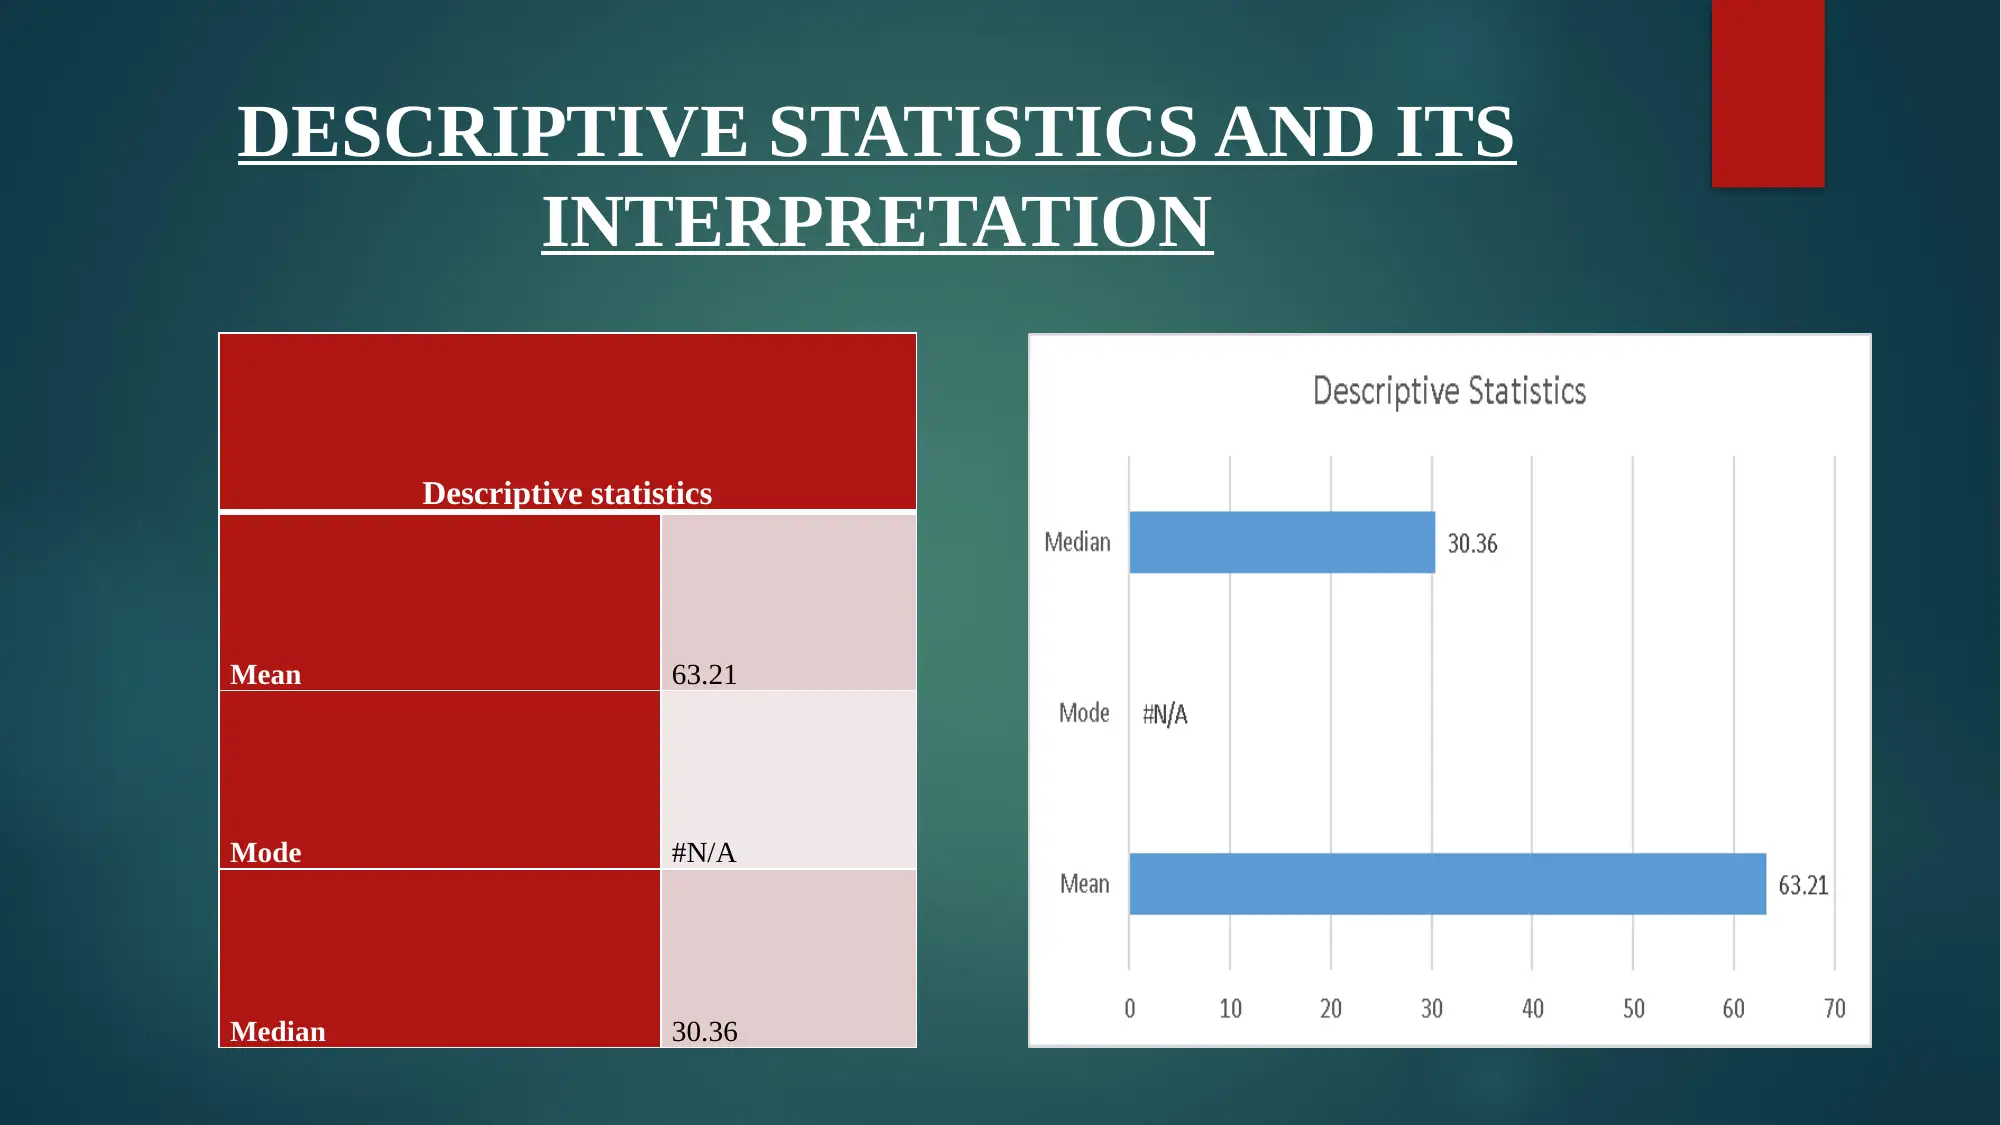
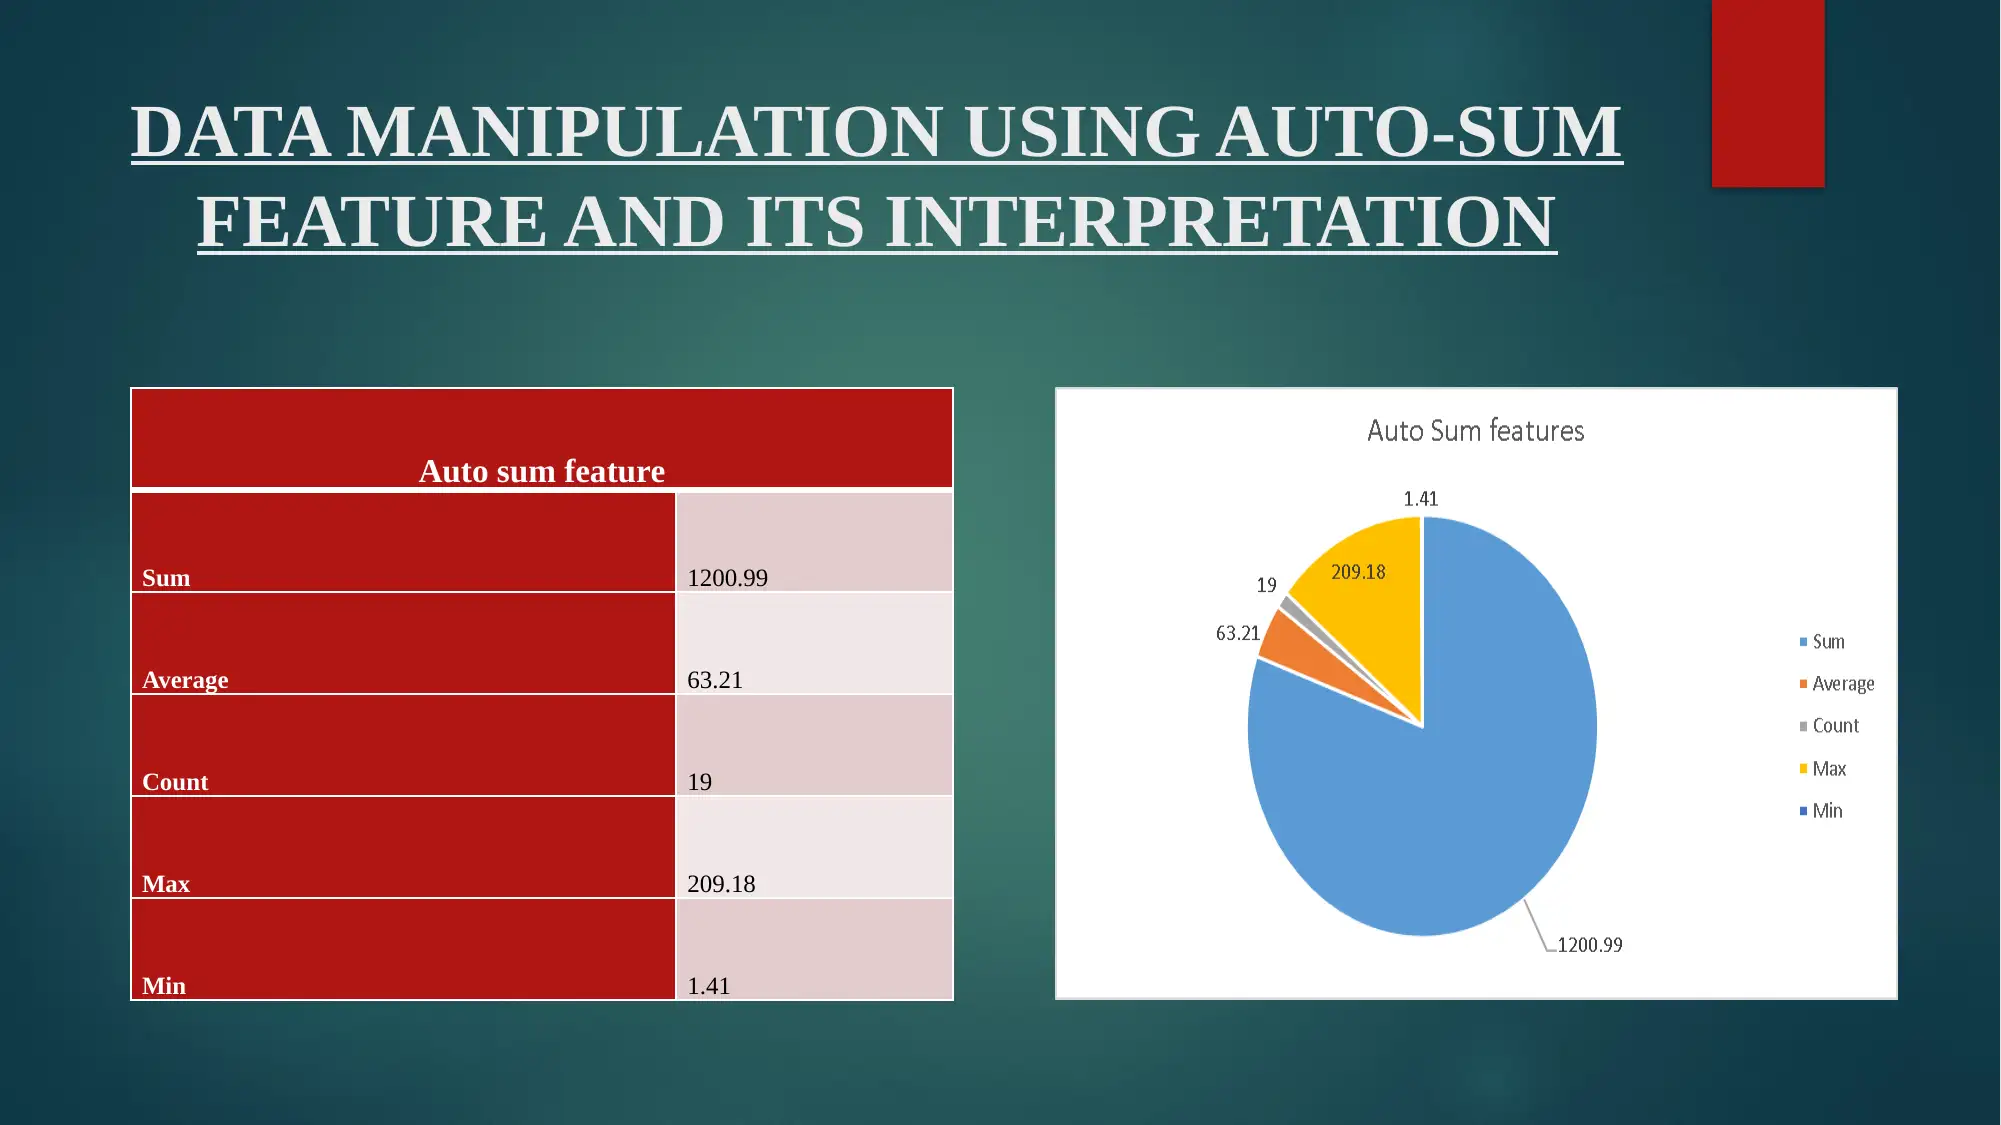
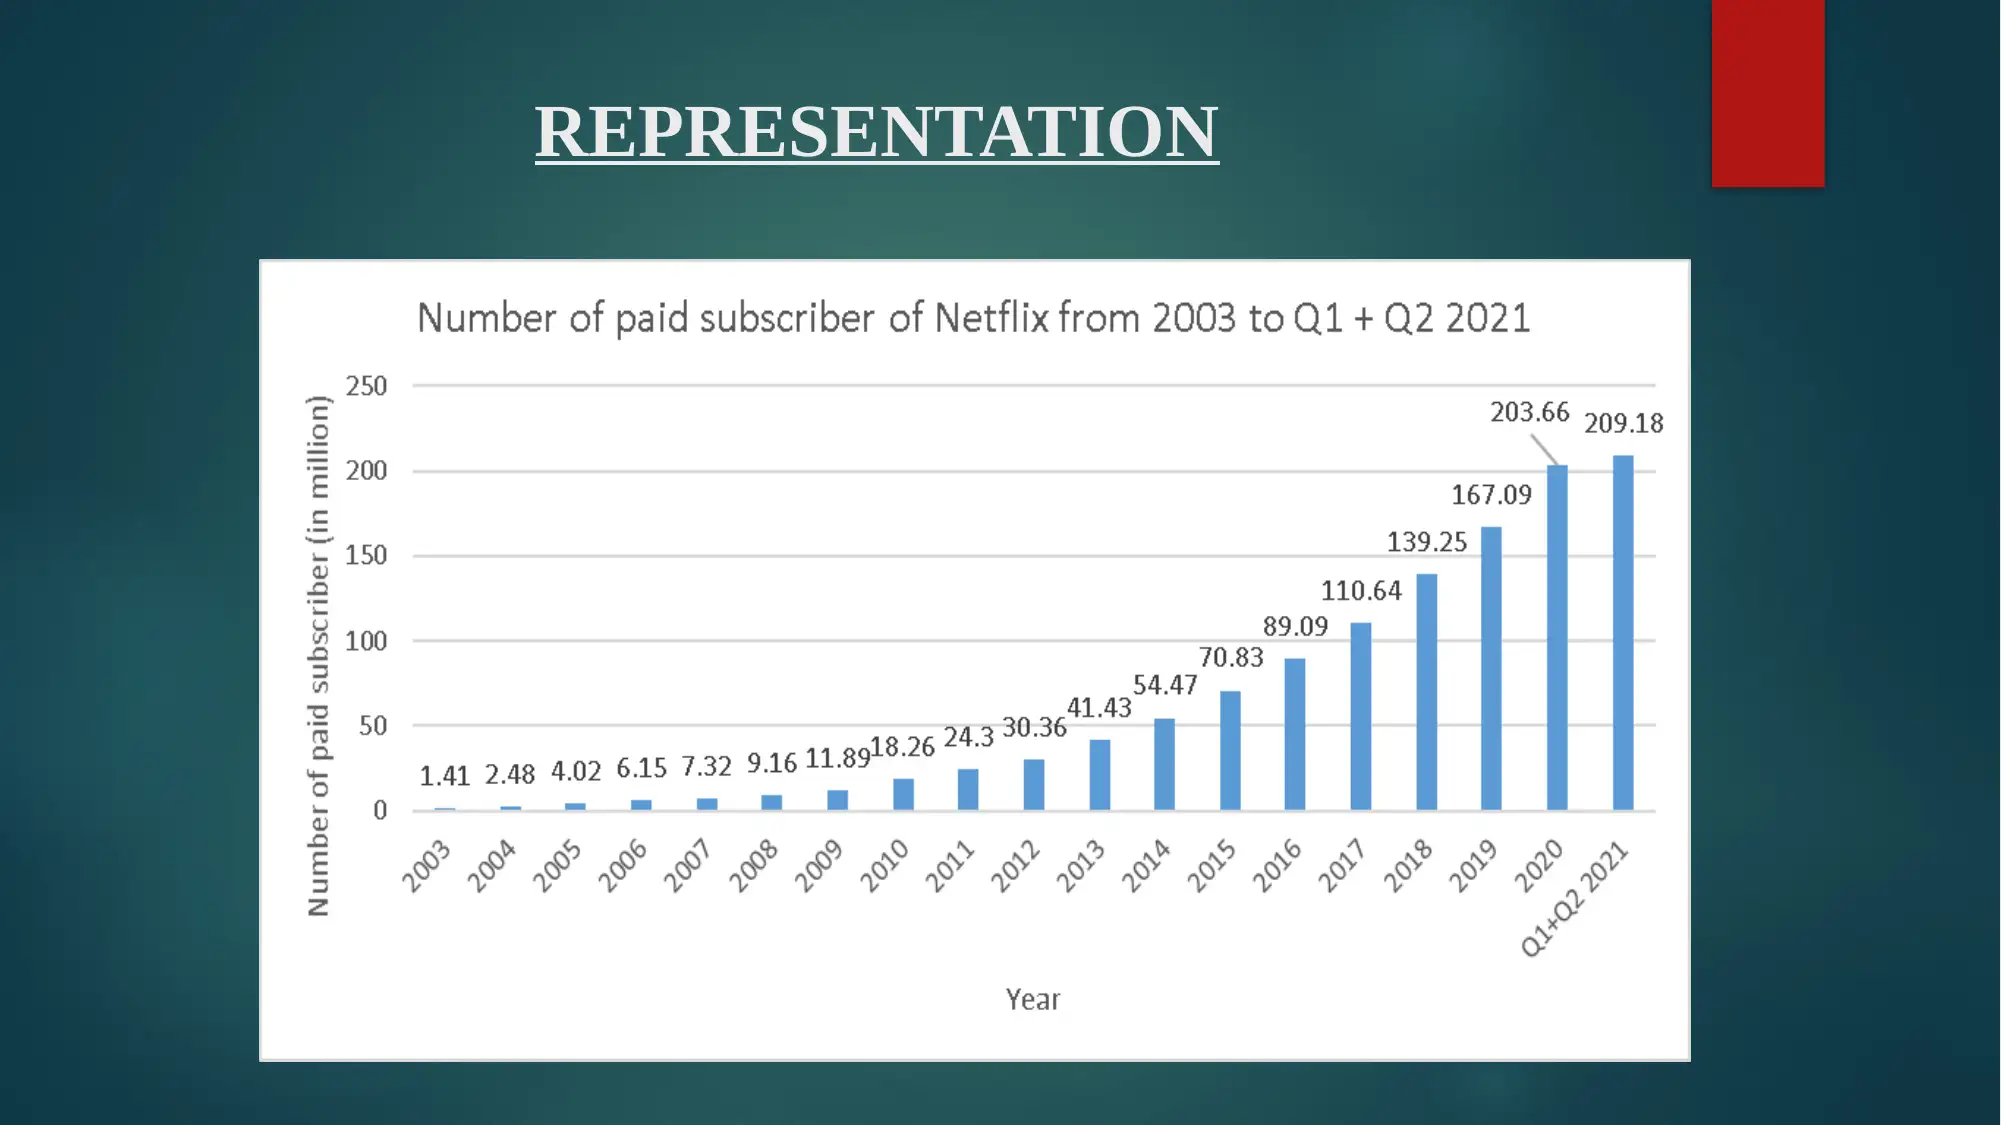
This report presents an analysis of Netflix's paid subscriber data from 2003 to 2021 using MS Excel. The analysis includes raw data presentation, descriptive statistics (mean, mode, median), data manipulation using the auto-sum feature (sum, average, count, max, min), and growth percentage calculations. The report interprets these findings to demonstrate the upward trend in Netflix subscriber numbers over the specified period. Visual representations of the data, such as charts and graphs, are also discussed. The conclusion highlights the increasing number of Netflix paid subscribers and summarizes the key findings from the descriptive statistics, auto-sum features, and data visualizations. References to relevant research on data analysis and interpretation are also included.
Document Page
2- MS EXCEL TASK
NETFLIX
tabler-icon-diamond-filled.svg

Secure Best Marks with AI Grader

Need help grading? Try our AI Grader for instant feedback on your assignments.
Document Page
TABLE OF CONTENT
Brief description about data
Raw data presentation
Descriptive statistics and its interpretation
Data Manipulation using auto-sum feature and its interpretation
Manipulation of data using Growth percenatge
Representation
Conclusion
References
Document Page
BRIEF DESCRIPTION ABOUT DATA
Data analysis is defined as a process of inspecting, cleaning, transforming and
modelling the whole dataset in order to convert them into useful information.
The dataset selected for current presentation is Netflix number of paid subscribers
(in million) from year 2003 to Q1 + Q2 of year 2021.
Further, the presentation will interpret the findings and result of descriptive
statistics as well as the auto-sum features which is calculated in MS excel.
Lastly, the presentation will also cover the visualisation of data using charts and
diagrams with its proper interpretation.
Document Page
RAW DATA PRESENTATION
Year Number of paid subscribers (in millions)
2003 1.41
2004 2.48
2005 4.02
2006 6.15
2007 7.32
2008 9.16
2009 11.89
2010 18.26
2011 24.3
2012 30.36
2013 41.43
2014 54.47
2015 70.83
2016 89.09
2017 110.64
2018 139.25
2019 167.09
2020 203.66
Q1+Q2 2021 209.18
tabler-icon-diamond-filled.svg

Secure Best Marks with AI Grader

Need help grading? Try our AI Grader for instant feedback on your assignments.
Document Page
DESCRIPTIVE STATISTICS AND ITS
INTERPRETATION
Descriptive statistics
Mean 63.21
Mode #N/A
Median 30.36
Document Page
DATA MANIPULATION USING AUTO-SUM
FEATURE AND ITS INTERPRETATION
Auto sum feature
Sum 1200.99
Average 63.21
Count 19
Max 209.18
Min 1.41
Document Page
MANIPULATION OF DATA USING
GROWTH PERCENTAGE
tabler-icon-diamond-filled.svg

Paraphrase This Document

Need a fresh take? Get an instant paraphrase of this document with our AI Paraphraser
Document Page
REPRESENTATION
Document Page
CONCLUSION
After summing up the above information, it has been concluded that the number
of Netflix paid subscriber has increased or moved to upward direction from 2003
to 2021.
The data has been selected for the current presentation is number of paid
subscriber of Netflix with total number of observation of 19 years.
The presentation has interpreted the number of result of descriptive statistic and
auto-sum feature which is calculated in MS excel.
Lastly, the presentation has also interpreted the charts and graphs of the data set.
Document Page
REFERENCES
Peter Rosenfeld, J. and Olson, J. M., 2021. Bayesian Data Analysis: A Fresh Approach to
Power Issues and Null Hypothesis Interpretation. Applied Psychophysiology and
Biofeedback. 46(2). pp.135-140.
Kanthiya, S., Mangkhemthong, N. and Morley, C. K., 2019. Structural interpretation of
Mae Suai Basin, Chiang Rai Province, based on gravity data analysis and
modelling. Heliyon. 5(2). p.e01232.
Gasperini, L., Ligi, M. and Stanghellini, G., 2021. Pseudo-3D techniques for analysis and
interpretation of high-resolution marine seismic reflection data. Boll. Geofis. Teor. Appl. 62.
pp.599-614.
Kothawade, M. S., 2020. Methodology and Data Analysis and Interpretation of Cane Juice
Centrifugation. Forest Chemicals Review, pp.06-10.
Allison, T. M. and et.al., 2020. Software requirements for the analysis and interpretation of
native ion mobility mass spectrometry data. Analytical Chemistry. 92(16). pp.10881-10890.
tabler-icon-diamond-filled.svg

Secure Best Marks with AI Grader

Need help grading? Try our AI Grader for instant feedback on your assignments.
Document Page
THANK YOU
chevron_up_icon
1 out of 11
circle_padding
hide_on_mobile
zoom_out_icon
logo.png

Your All-in-One AI-Powered Toolkit for Academic Success.

Available 24*7 on WhatsApp / Email

[object Object]