Netflix Financial and Business Analysis: Industry and Ratio Analysis
VerifiedAdded on 2020/07/23
|24
|5174
|119
Report
AI Summary
This report provides a comprehensive financial and business analysis of Netflix, a leading entertainment company. The analysis begins with an executive summary and then delves into industry analysis using Porter's Five Forces model to assess competitive dynamics. The report then calculates and interprets various financial ratios, including liquidity, solvency, and profitability ratios, over a five-year period to evaluate Netflix's financial health. Furthermore, the report explores valuation techniques, including the Gordon Growth Model and Free Cash Flow valuation, to estimate the company's intrinsic value. The report also includes an analysis of the company's profile, strategy, and the risks it faces, such as exchange rate risk. The analysis includes tables and illustrations to support the findings and concludes with an overall assessment of Netflix's business performance and financial position.
FINANCIAL AND
BUSINESS ANALYSIS
BUSINESS ANALYSIS
Paraphrase This Document
Need a fresh take? Get an instant paraphrase of this document with our AI Paraphraser
TABLE OF CONTENTS
EXECUTIVE SUMMARY.............................................................................................................1
INDUSTRY ANALYSIS................................................................................................................3
Rivalry among existing competitors.......................................................................................4
Threat of new entrants............................................................................................................4
Threat of substitute products..................................................................................................4
Bargaining power of buyers...................................................................................................5
Bargaining power of suppliers................................................................................................5
FINANCIAL RATIOS.....................................................................................................................5
Liquidity ratios.......................................................................................................................5
Solvency ratios.......................................................................................................................6
Profitability ratios...................................................................................................................7
Employee count measures......................................................................................................9
Accuracy of the Financial statements...................................................................................10
Absolute Valuation with Gordan Growth Model.................................................................11
Free cash flow valuation.......................................................................................................17
Relative Valuation based on comparable data......................................................................17
REFERENCES..............................................................................................................................19
ILLUSTRATION INDEX
Illustration 1: Revenue on International Platform...........................................................................2
Illustration 2: Porter's five force model...........................................................................................4
Illustration 3: Current ratio..............................................................................................................6
Illustration 4: Debt to equity ratio....................................................................................................7
Illustration 5: Interest coverage ratio...............................................................................................7
Illustration 6: Gross profit ratio.......................................................................................................8
Illustration 7: Operating profit ratio.................................................................................................8
Illustration 8: Net profit ratio...........................................................................................................9
Illustration 9: Revenue per employee............................................................................................10
Illustration 10: Comparison of earning per share..........................................................................14
Index of Tables
Table 1: Calculation of liquidity ratio..............................................................................................5
Table 2: Solvency Ratios.................................................................................................................6
Table 3: Calculation of Profitability ratios......................................................................................7
Table 4: Calculation of Employee count measures..........................................................................9
Table 5: Balance Sheet based accrual ratio....................................................................................10
Table 6: Cash Flow based accrual ratio.........................................................................................11
Table 7: Calculation of operating cash flow to operating income.................................................11
Table 8: Estimated Return on Equity.............................................................................................12
Table 9: Forecasted Net income....................................................................................................12
Table 10: Calculation of Retention rate.........................................................................................13
Table 11: Calculation of Sensitivity Analysis...............................................................................16
Table 12: Free Cash Flow Valuation.............................................................................................17
⊘ This is a preview!⊘
Do you want full access?
Subscribe today to unlock all pages.
Trusted by 1+ million students worldwide
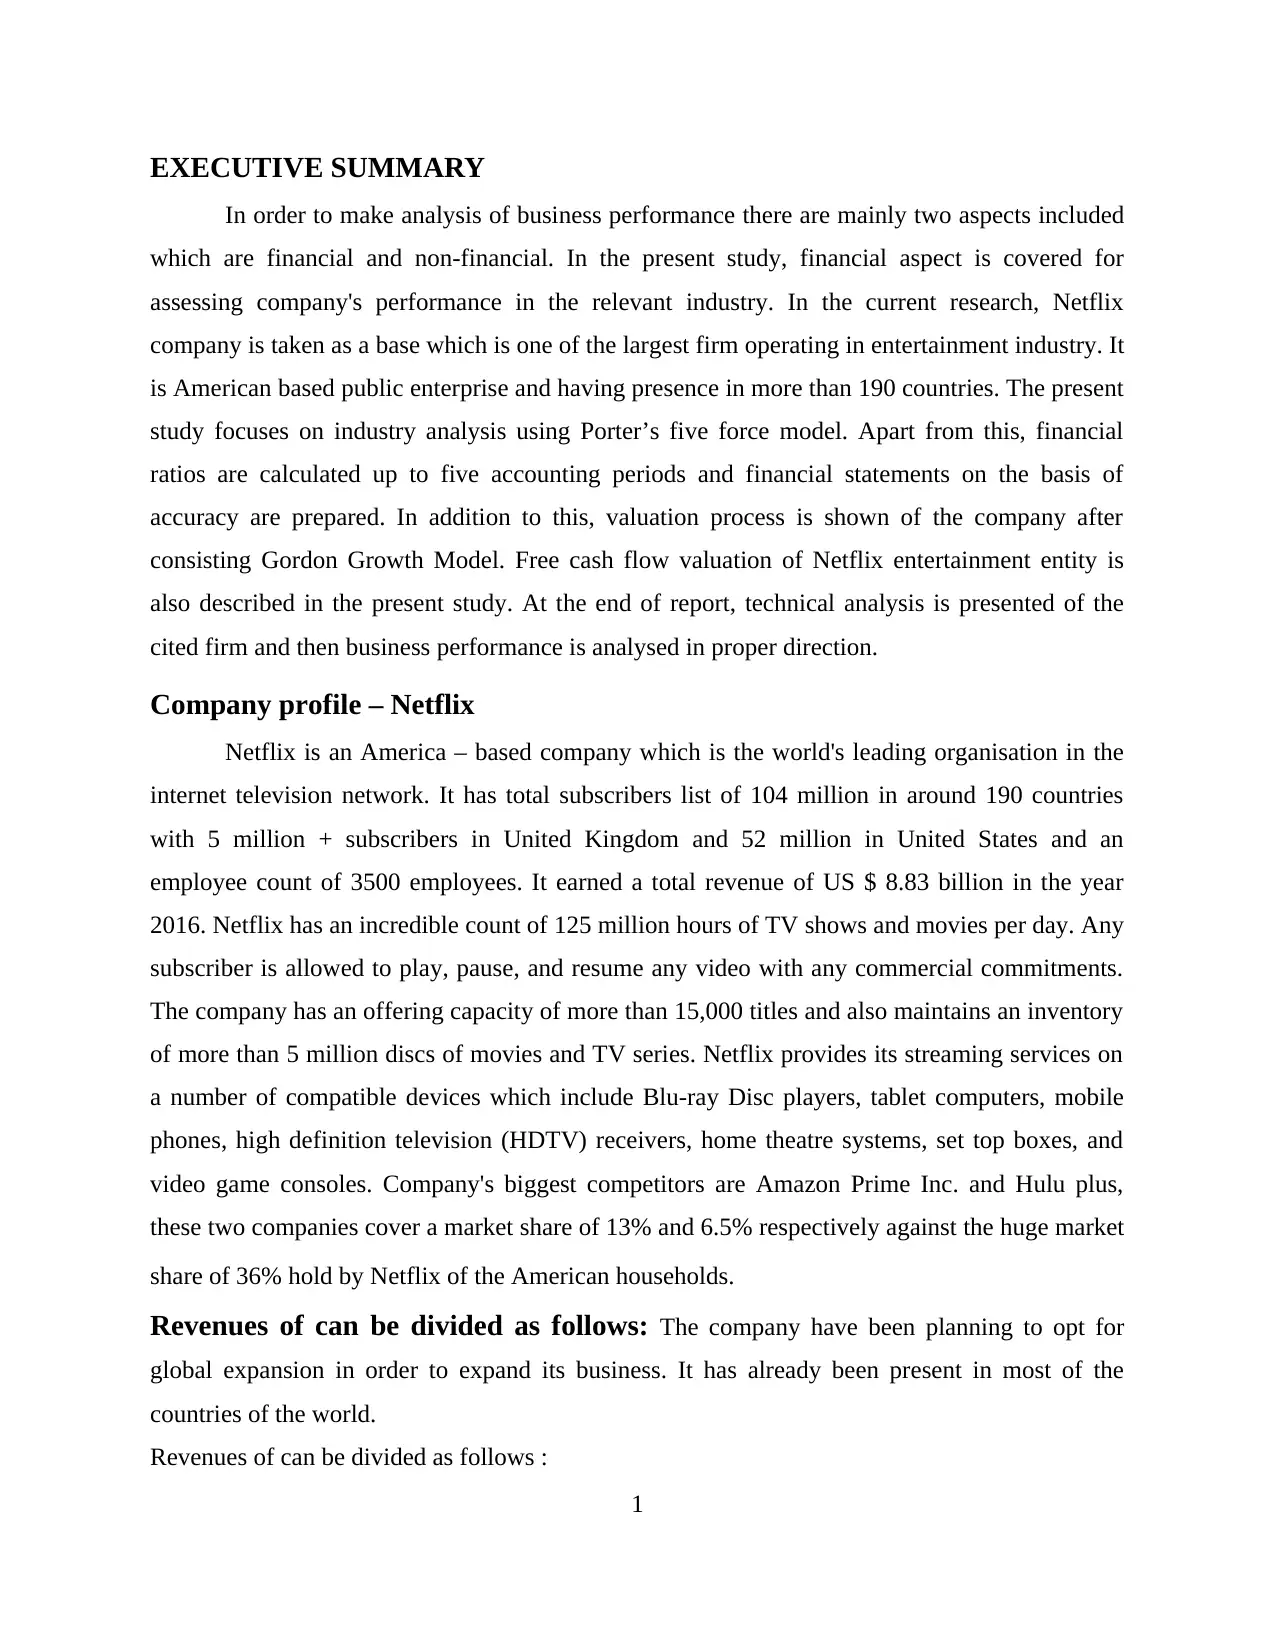
EXECUTIVE SUMMARY
In order to make analysis of business performance there are mainly two aspects included
which are financial and non-financial. In the present study, financial aspect is covered for
assessing company's performance in the relevant industry. In the current research, Netflix
company is taken as a base which is one of the largest firm operating in entertainment industry. It
is American based public enterprise and having presence in more than 190 countries. The present
study focuses on industry analysis using Porter’s five force model. Apart from this, financial
ratios are calculated up to five accounting periods and financial statements on the basis of
accuracy are prepared. In addition to this, valuation process is shown of the company after
consisting Gordon Growth Model. Free cash flow valuation of Netflix entertainment entity is
also described in the present study. At the end of report, technical analysis is presented of the
cited firm and then business performance is analysed in proper direction.
Company profile – Netflix
Netflix is an America – based company which is the world's leading organisation in the
internet television network. It has total subscribers list of 104 million in around 190 countries
with 5 million + subscribers in United Kingdom and 52 million in United States and an
employee count of 3500 employees. It earned a total revenue of US $ 8.83 billion in the year
2016. Netflix has an incredible count of 125 million hours of TV shows and movies per day. Any
subscriber is allowed to play, pause, and resume any video with any commercial commitments.
The company has an offering capacity of more than 15,000 titles and also maintains an inventory
of more than 5 million discs of movies and TV series. Netflix provides its streaming services on
a number of compatible devices which include Blu-ray Disc players, tablet computers, mobile
phones, high definition television (HDTV) receivers, home theatre systems, set top boxes, and
video game consoles. Company's biggest competitors are Amazon Prime Inc. and Hulu plus,
these two companies cover a market share of 13% and 6.5% respectively against the huge market
share of 36% hold by Netflix of the American households.
Revenues of can be divided as follows: The company have been planning to opt for
global expansion in order to expand its business. It has already been present in most of the
countries of the world.
Revenues of can be divided as follows :
1
Paraphrase This Document
Need a fresh take? Get an instant paraphrase of this document with our AI Paraphraser
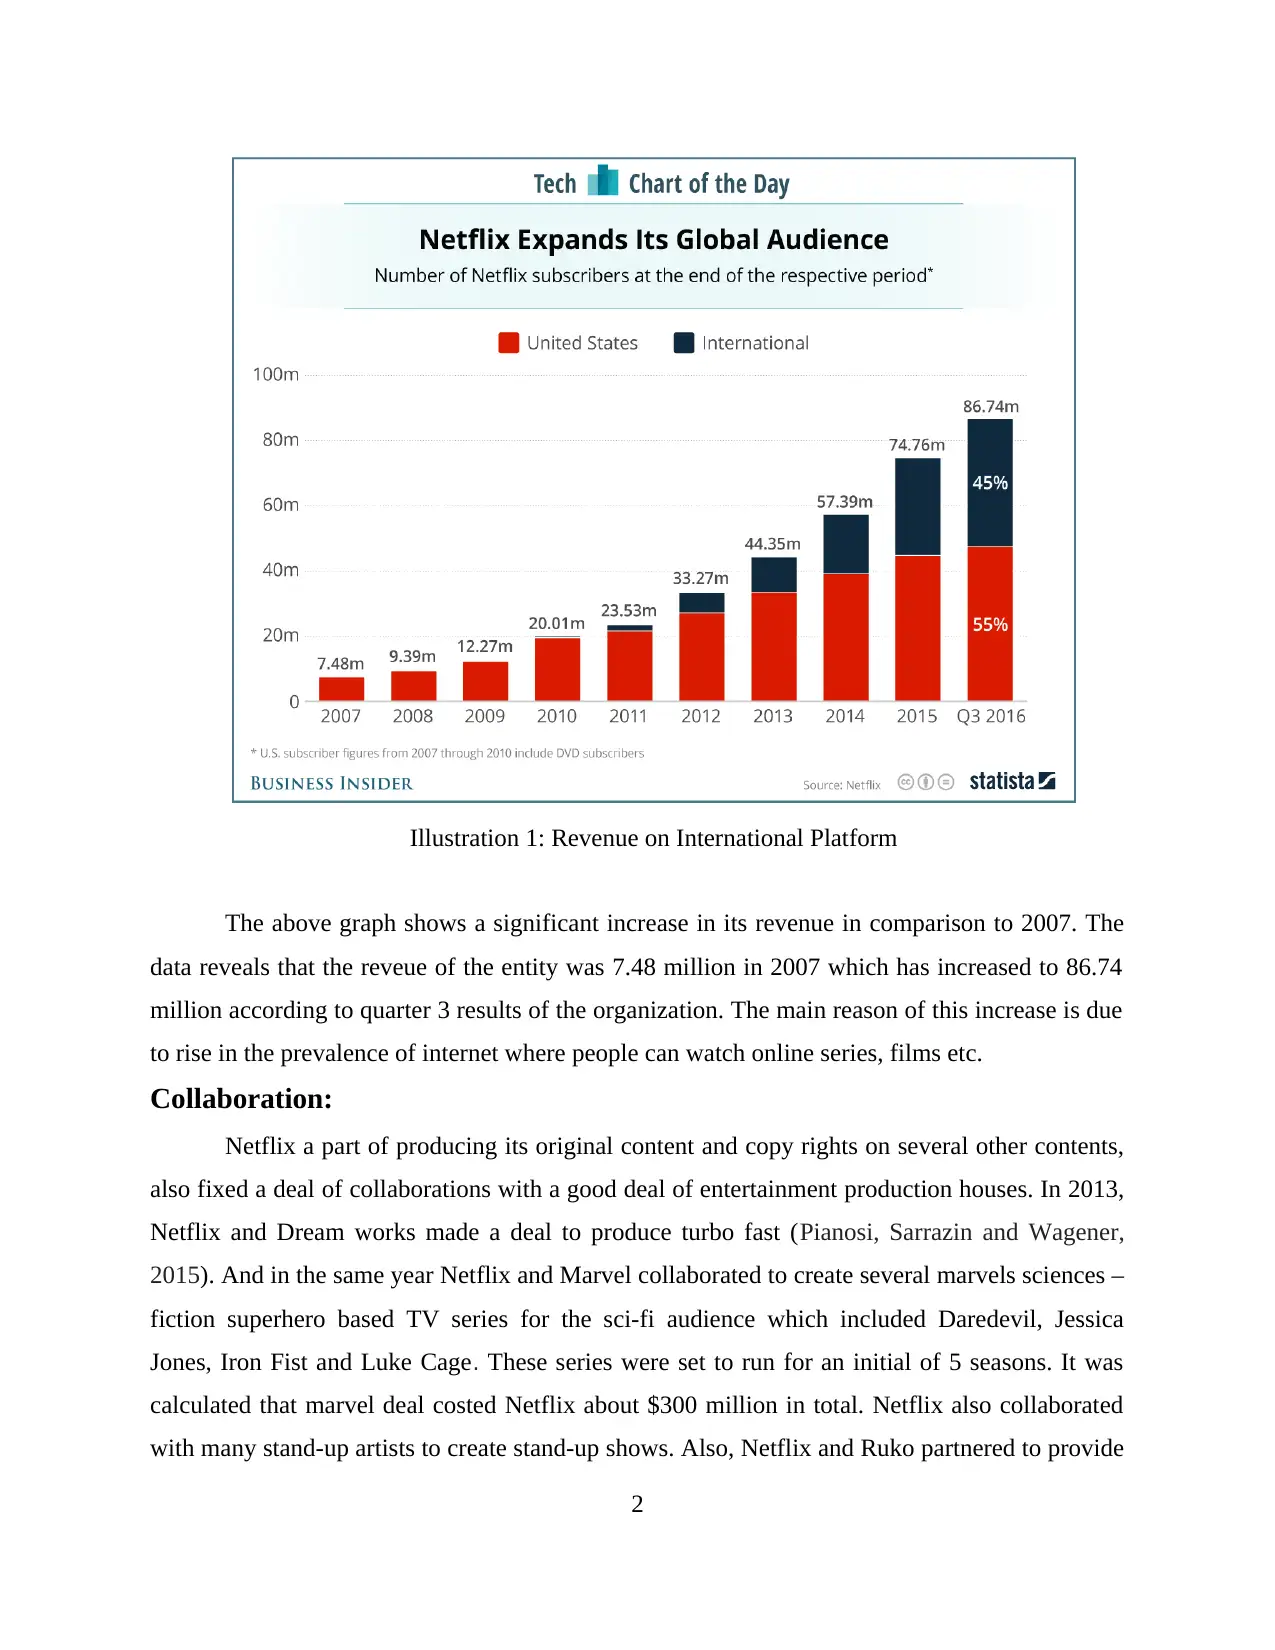
The above graph shows a significant increase in its revenue in comparison to 2007. The
data reveals that the reveue of the entity was 7.48 million in 2007 which has increased to 86.74
million according to quarter 3 results of the organization. The main reason of this increase is due
to rise in the prevalence of internet where people can watch online series, films etc.
Collaboration:
Netflix a part of producing its original content and copy rights on several other contents,
also fixed a deal of collaborations with a good deal of entertainment production houses. In 2013,
Netflix and Dream works made a deal to produce turbo fast (Pianosi, Sarrazin and Wagener,
2015). And in the same year Netflix and Marvel collaborated to create several marvels sciences –
fiction superhero based TV series for the sci-fi audience which included Daredevil, Jessica
Jones, Iron Fist and Luke Cage. These series were set to run for an initial of 5 seasons. It was
calculated that marvel deal costed Netflix about $300 million in total. Netflix also collaborated
with many stand-up artists to create stand-up shows. Also, Netflix and Ruko partnered to provide
2
Illustration 1: Revenue on International Platform
super high definition content to the subscribers. Netflix also have a huge base with a
collaboration made with Leonardo DiCaprio for his documentaries. Deal between Netflix and
Disney was made in 2012 by creation of movies.
Strategy to expand business :
Strategy to expand business:
Netflix opted for an excellent strategy to co produce shows with other entertainment units
whose content was already a success in other sources available giving it a boost to the revenue. It
also gave a decent focus on the R&D activities to keep the content updated and attractive to the
subscribers (Tian, 2013).
Exchange rate risk:
As, Netflix operates in 190 countries it's risk of exchange rate is particularly high. Its
rate risk between United Kingdom and America has been good for the company as it has jumped
for $1.8-1.3 to every one euro. Netflix also shares big risks in the countries like India, China as
the exchange rate is quite high of 0.15 US dollar to one Chinese Yuan and 0.016 US$ to 1 Indian
Rupee.
It is an important driving factor which is considered by Netflix while planning for global
expansion. The currency exchange rate and economy of the country helps in deciding that how
much revenue it can generate from the same. The prices are decided according to the purchasing
power of the company and this is the reason why prices of the entity fluctuates among the
countries.
INDUSTRY ANALYSIS
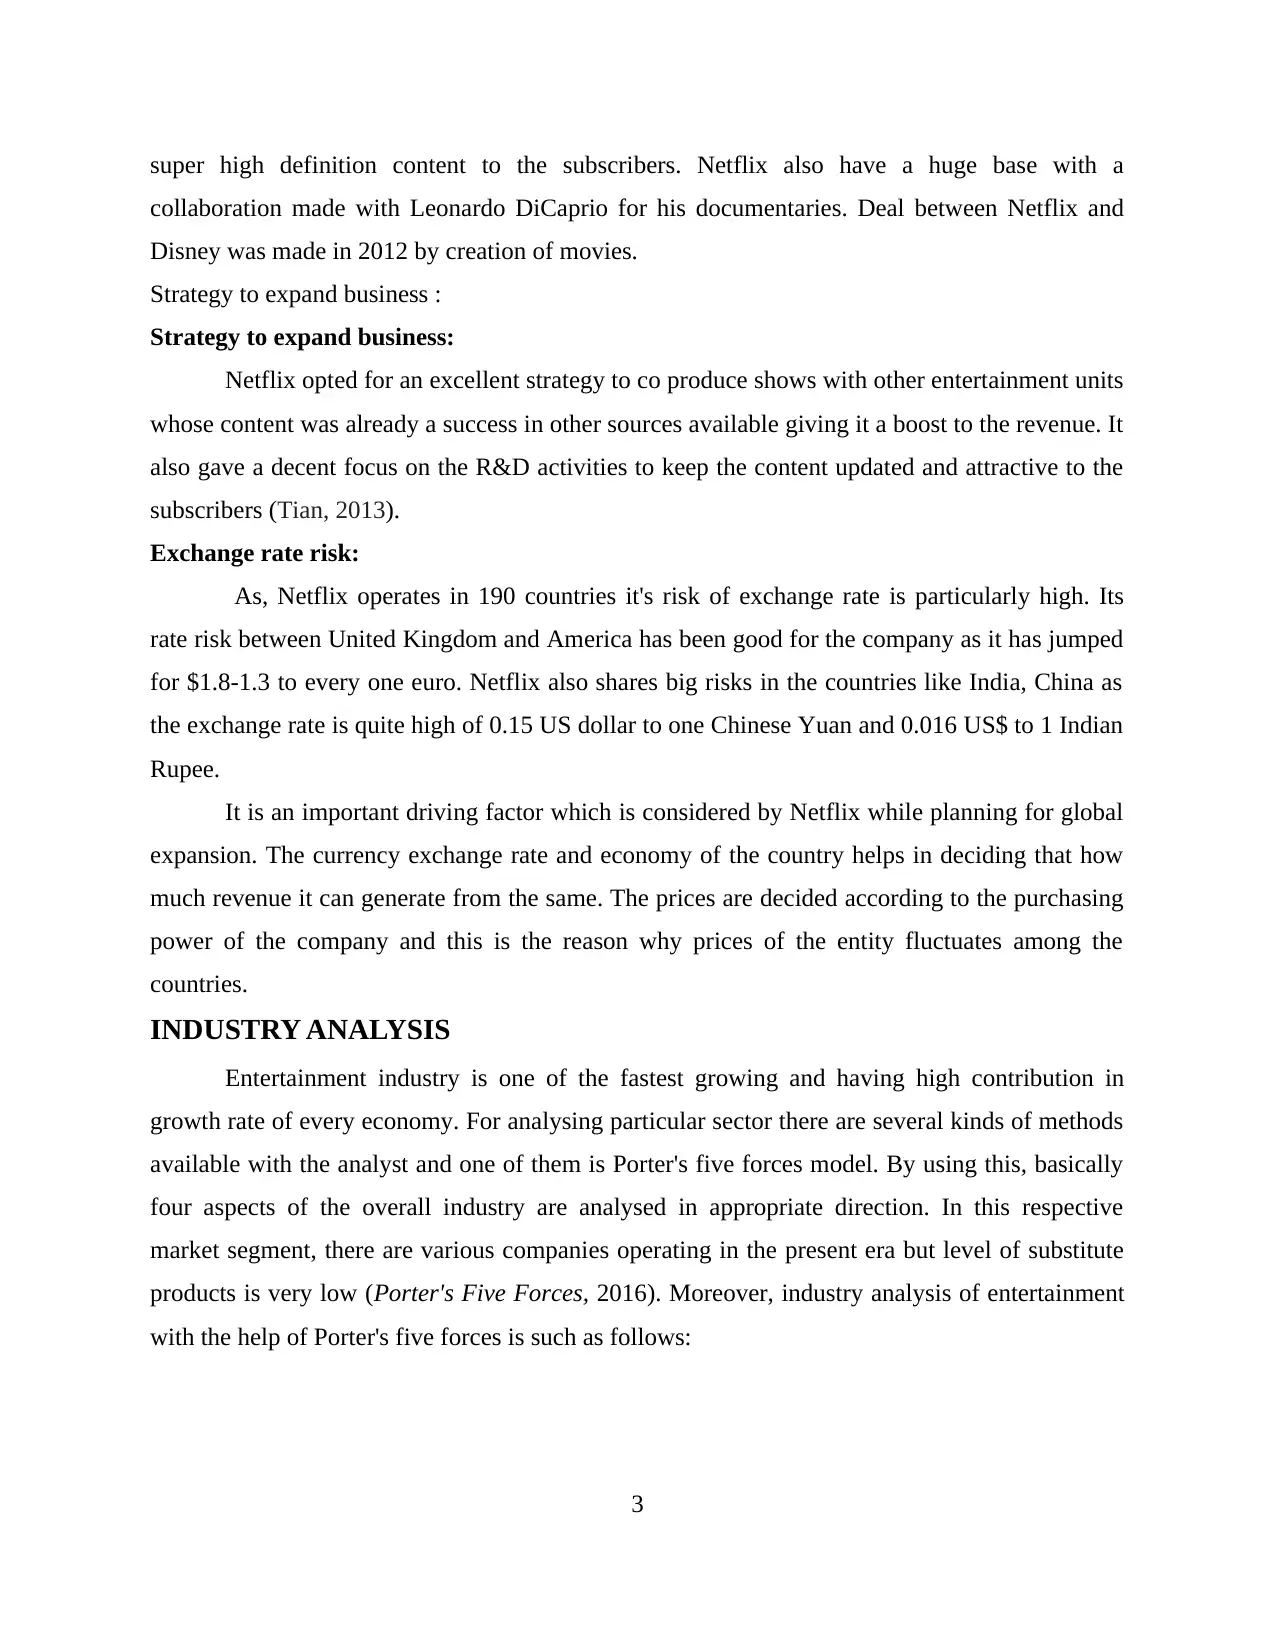
Entertainment industry is one of the fastest growing and having high contribution in
growth rate of every economy. For analysing particular sector there are several kinds of methods
available with the analyst and one of them is Porter's five forces model. By using this, basically
four aspects of the overall industry are analysed in appropriate direction. In this respective
market segment, there are various companies operating in the present era but level of substitute
products is very low (Porter's Five Forces, 2016). Moreover, industry analysis of entertainment
with the help of Porter's five forces is such as follows:
3
collaboration made with Leonardo DiCaprio for his documentaries. Deal between Netflix and
Disney was made in 2012 by creation of movies.
Strategy to expand business :
Strategy to expand business:
Netflix opted for an excellent strategy to co produce shows with other entertainment units
whose content was already a success in other sources available giving it a boost to the revenue. It
also gave a decent focus on the R&D activities to keep the content updated and attractive to the
subscribers (Tian, 2013).
Exchange rate risk:
As, Netflix operates in 190 countries it's risk of exchange rate is particularly high. Its
rate risk between United Kingdom and America has been good for the company as it has jumped
for $1.8-1.3 to every one euro. Netflix also shares big risks in the countries like India, China as
the exchange rate is quite high of 0.15 US dollar to one Chinese Yuan and 0.016 US$ to 1 Indian
Rupee.
It is an important driving factor which is considered by Netflix while planning for global
expansion. The currency exchange rate and economy of the country helps in deciding that how
much revenue it can generate from the same. The prices are decided according to the purchasing
power of the company and this is the reason why prices of the entity fluctuates among the
countries.
INDUSTRY ANALYSIS
Entertainment industry is one of the fastest growing and having high contribution in
growth rate of every economy. For analysing particular sector there are several kinds of methods
available with the analyst and one of them is Porter's five forces model. By using this, basically
four aspects of the overall industry are analysed in appropriate direction. In this respective
market segment, there are various companies operating in the present era but level of substitute
products is very low (Porter's Five Forces, 2016). Moreover, industry analysis of entertainment
with the help of Porter's five forces is such as follows:
3
⊘ This is a preview!⊘
Do you want full access?
Subscribe today to unlock all pages.
Trusted by 1+ million students worldwide
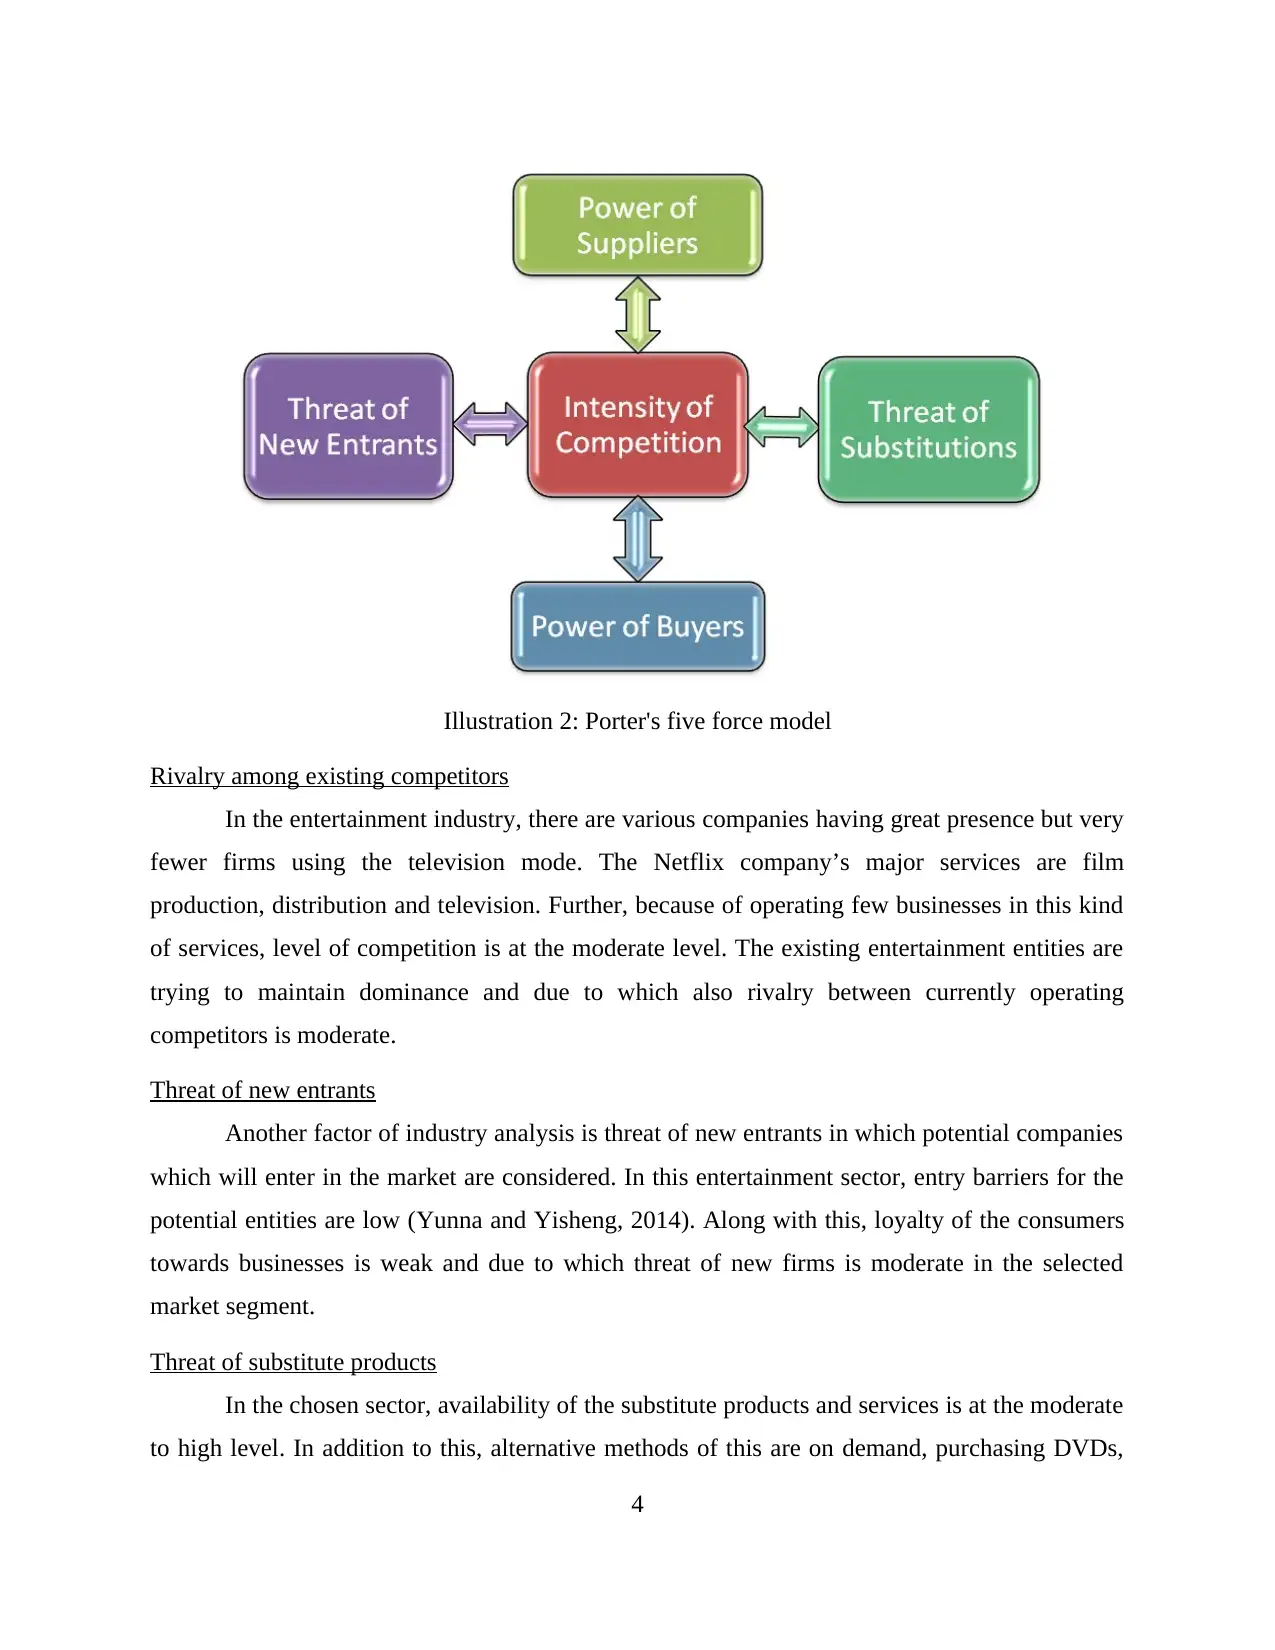
Illustration 2: Porter's five force model
Rivalry among existing competitors
In the entertainment industry, there are various companies having great presence but very
fewer firms using the television mode. The Netflix company’s major services are film
production, distribution and television. Further, because of operating few businesses in this kind
of services, level of competition is at the moderate level. The existing entertainment entities are
trying to maintain dominance and due to which also rivalry between currently operating
competitors is moderate.
Threat of new entrants
Another factor of industry analysis is threat of new entrants in which potential companies
which will enter in the market are considered. In this entertainment sector, entry barriers for the
potential entities are low (Yunna and Yisheng, 2014). Along with this, loyalty of the consumers
towards businesses is weak and due to which threat of new firms is moderate in the selected
market segment.
Threat of substitute products
In the chosen sector, availability of the substitute products and services is at the moderate
to high level. In addition to this, alternative methods of this are on demand, purchasing DVDs,
4
Paraphrase This Document
Need a fresh take? Get an instant paraphrase of this document with our AI Paraphraser
theatres etc. Henceforth, it can be analysed that, threat of substitute items in entertainment
industry is moderate and little high.
Bargaining power of buyers
When talking about bargaining at the time of purchases from the consumers side then it is
high in entertainment sector. Very basic reason of this is that, buyer's loyalty towards the
company is weak. Along with this, revenue generated from customers at the majority level is
included in this segment. Moreover, bargaining power of buyers in entertainment field is high (E.
Dobbs 2014).
Bargaining power of suppliers
The last force through which industry is assessed is similar to bargaining power of
suppliers which is high in the entertainment. There is availability so many legal issues that are to
be dealt with along with licensing deals. Hence, bargaining power of the entertainment
businesses like Netflix is high.
FINANCIAL RATIOS
Method by which performance of the particular company is analysed in proper manner by
considering financial statements is known as financial ratios. It includes several measurements
and in the present study liquidity, solvency, profitability and employee count measures are used
(Babalola and Abiola, 2013). Further, the ratios for Netflix company are stated below:
Liquidity ratios
Table 1: Calculation of liquidity ratio
Liquidity ratios Formula 2012 2013 2014 2015 2016
Current assets Current assets /
current
liabilities
2241 3059 3940 5432 5720
Current liabilities 1676 2154 2663 3530 4587
Current ratio 1.34 : 1 1.42 : 1 1.48 : 1 1.54 : 1 1.25 : 1
5
2012 2013 2014 2015 2016
0.00
0.20
0.40
0.60
0.80
1.00
1.20
1.40
1.60
1.80
1.34 1.42 1.48 1.54
1.25
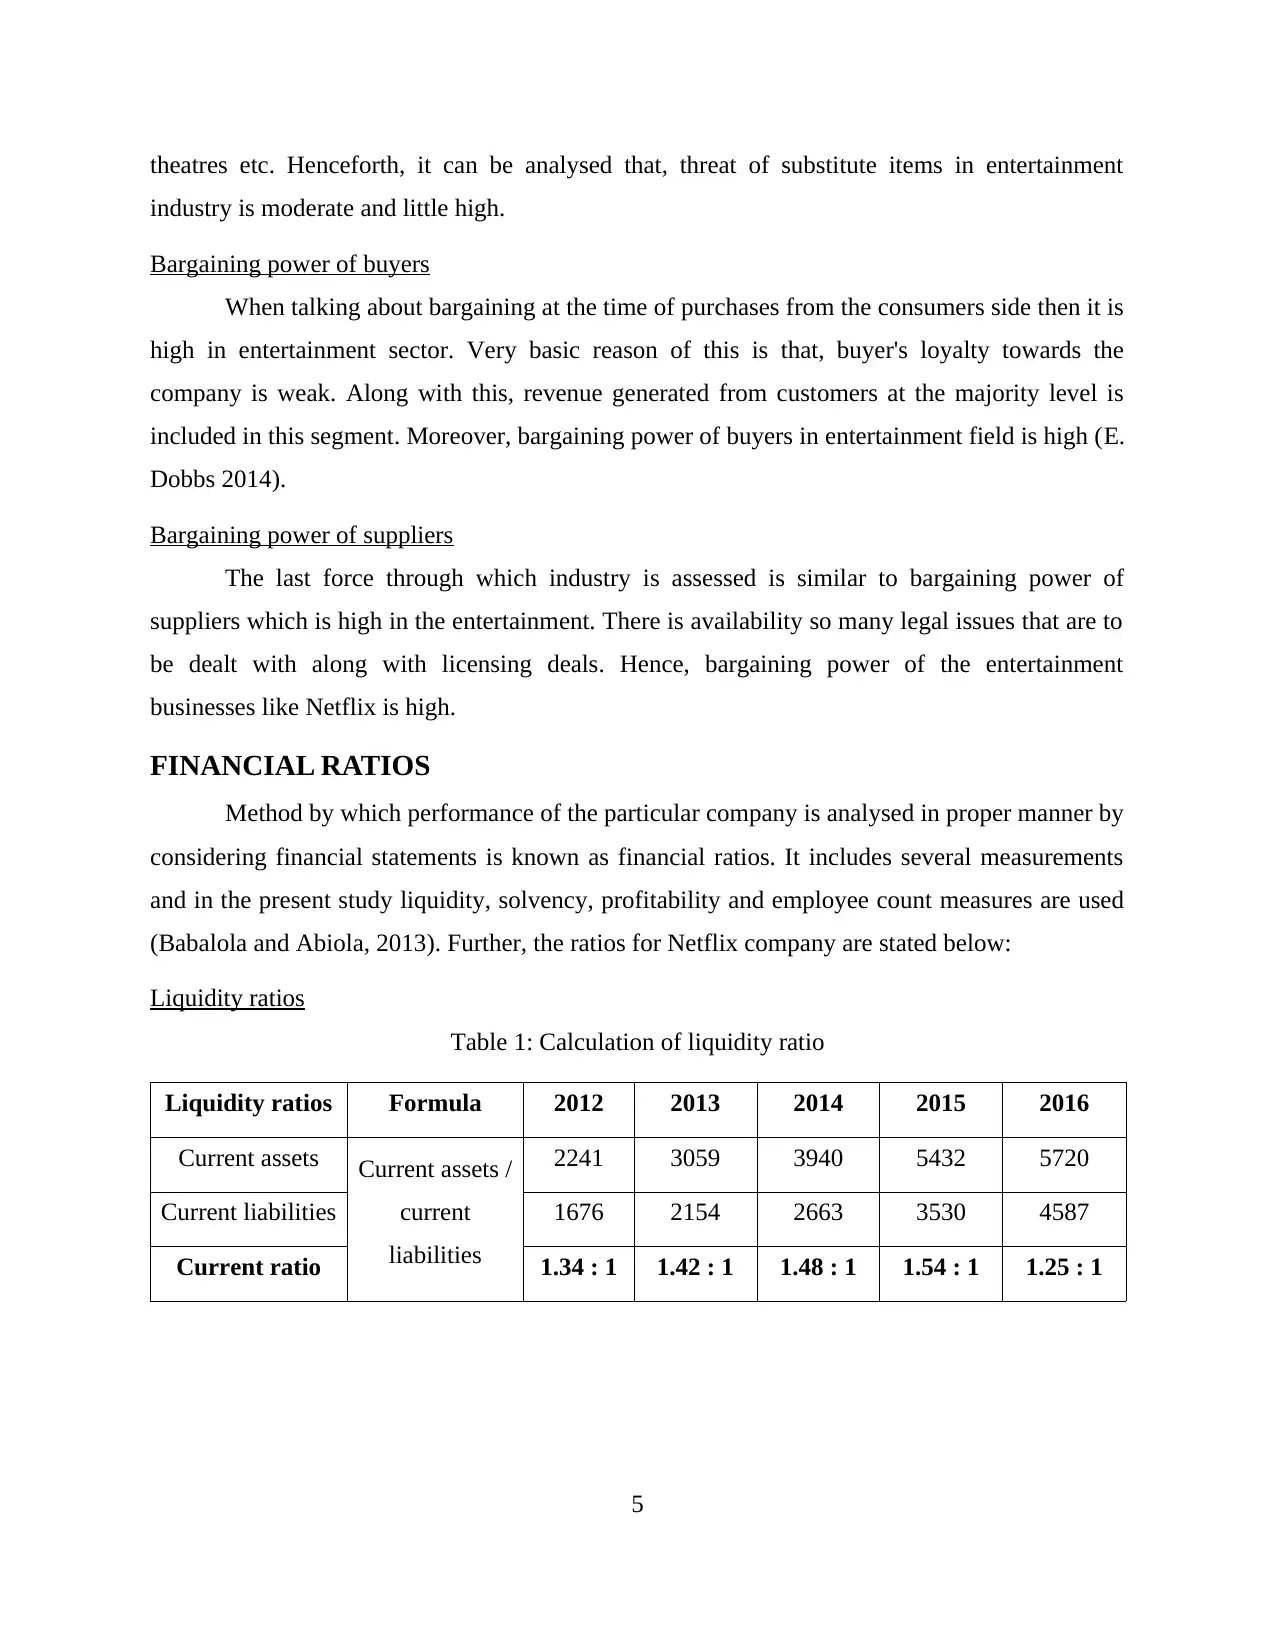
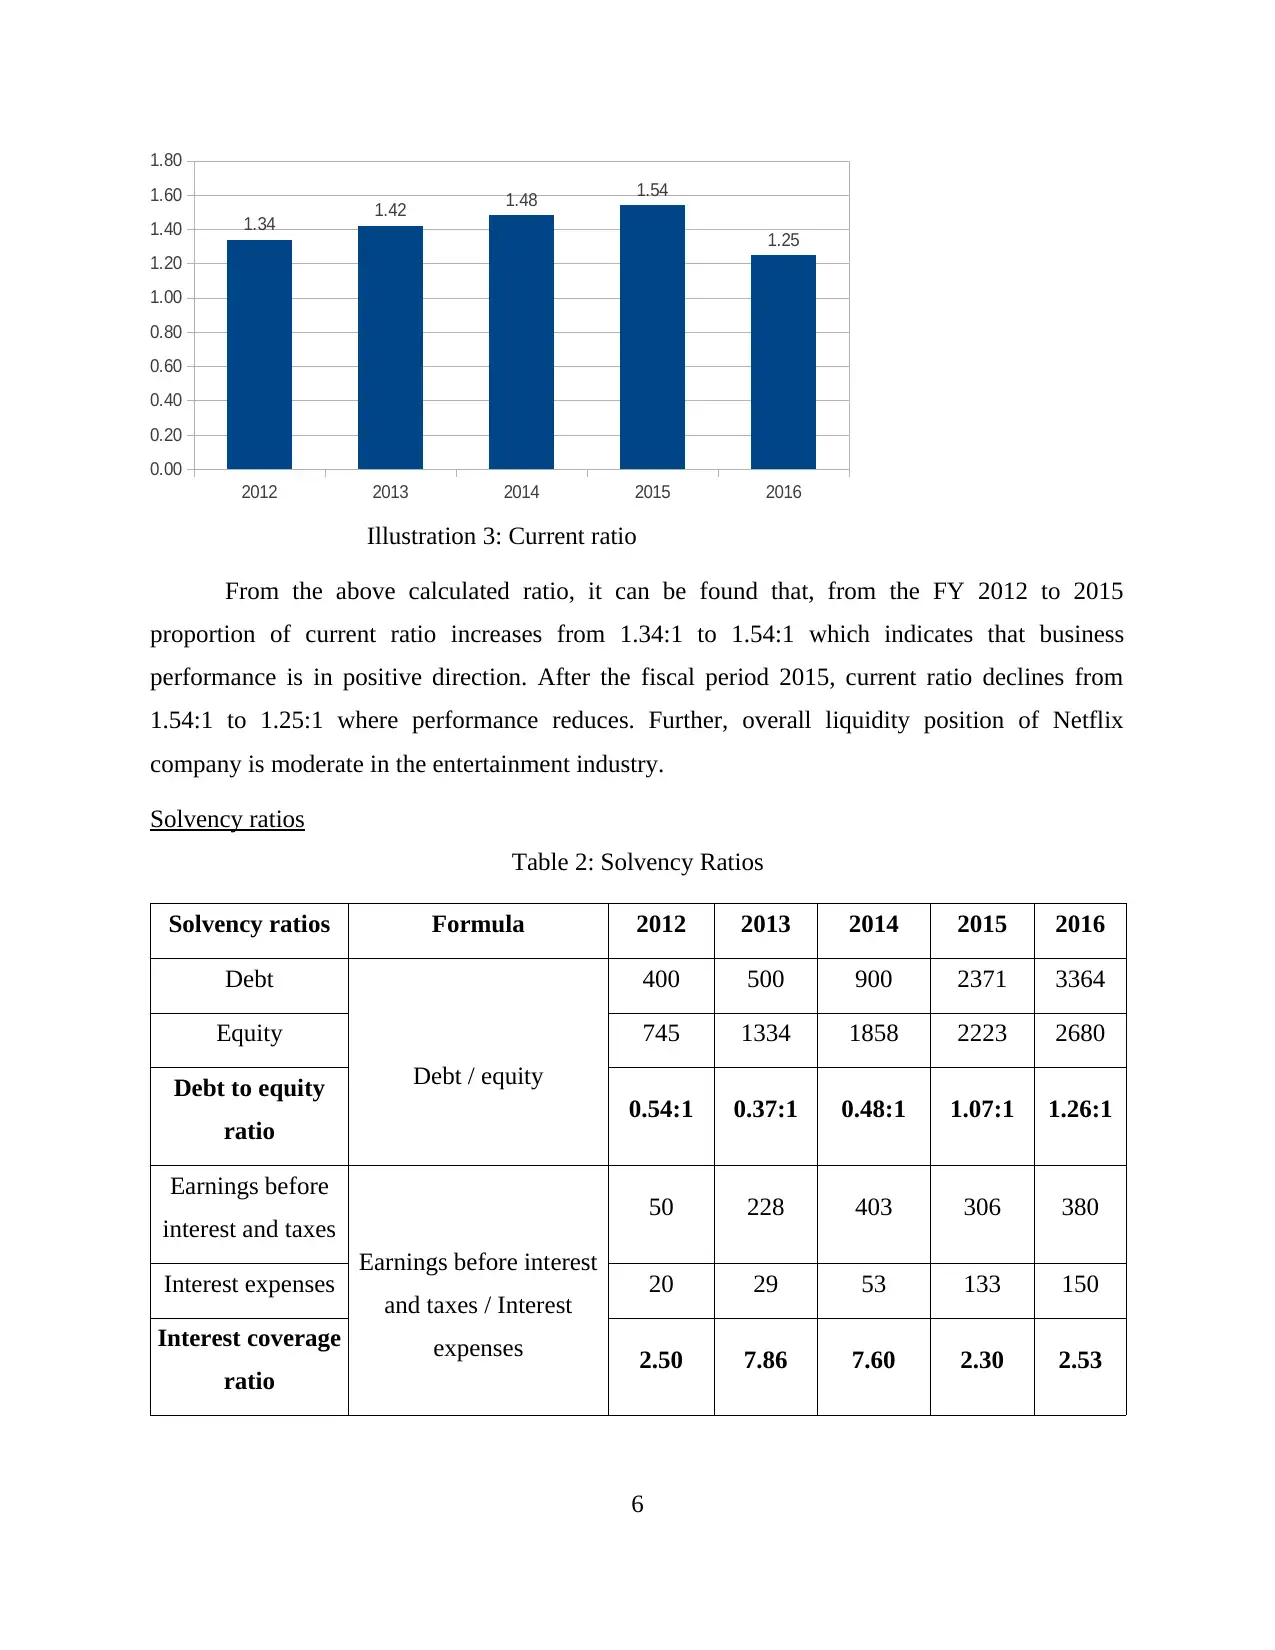
Illustration 3: Current ratio
From the above calculated ratio, it can be found that, from the FY 2012 to 2015
proportion of current ratio increases from 1.34:1 to 1.54:1 which indicates that business
performance is in positive direction. After the fiscal period 2015, current ratio declines from
1.54:1 to 1.25:1 where performance reduces. Further, overall liquidity position of Netflix
company is moderate in the entertainment industry.
Solvency ratios
Table 2: Solvency Ratios
Solvency ratios Formula 2012 2013 2014 2015 2016
Debt
Debt / equity
400 500 900 2371 3364
Equity 745 1334 1858 2223 2680
Debt to equity
ratio 0.54:1 0.37:1 0.48:1 1.07:1 1.26:1
Earnings before
interest and taxes
Earnings before interest
and taxes / Interest
expenses
50 228 403 306 380
Interest expenses 20 29 53 133 150
Interest coverage
ratio 2.50 7.86 7.60 2.30 2.53
6
0.00
0.20
0.40
0.60
0.80
1.00
1.20
1.40
1.60
1.80
1.34 1.42 1.48 1.54
1.25
Illustration 3: Current ratio
From the above calculated ratio, it can be found that, from the FY 2012 to 2015
proportion of current ratio increases from 1.34:1 to 1.54:1 which indicates that business
performance is in positive direction. After the fiscal period 2015, current ratio declines from
1.54:1 to 1.25:1 where performance reduces. Further, overall liquidity position of Netflix
company is moderate in the entertainment industry.
Solvency ratios
Table 2: Solvency Ratios
Solvency ratios Formula 2012 2013 2014 2015 2016
Debt
Debt / equity
400 500 900 2371 3364
Equity 745 1334 1858 2223 2680
Debt to equity
ratio 0.54:1 0.37:1 0.48:1 1.07:1 1.26:1
Earnings before
interest and taxes
Earnings before interest
and taxes / Interest
expenses
50 228 403 306 380
Interest expenses 20 29 53 133 150
Interest coverage
ratio 2.50 7.86 7.60 2.30 2.53
6
⊘ This is a preview!⊘
Do you want full access?
Subscribe today to unlock all pages.
Trusted by 1+ million students worldwide
2012 2013 2014 2015 2016
0.00
0.20
0.40
0.60
0.80
1.00
1.20
1.40
0.54
0.37
0.48
1.07
1.26
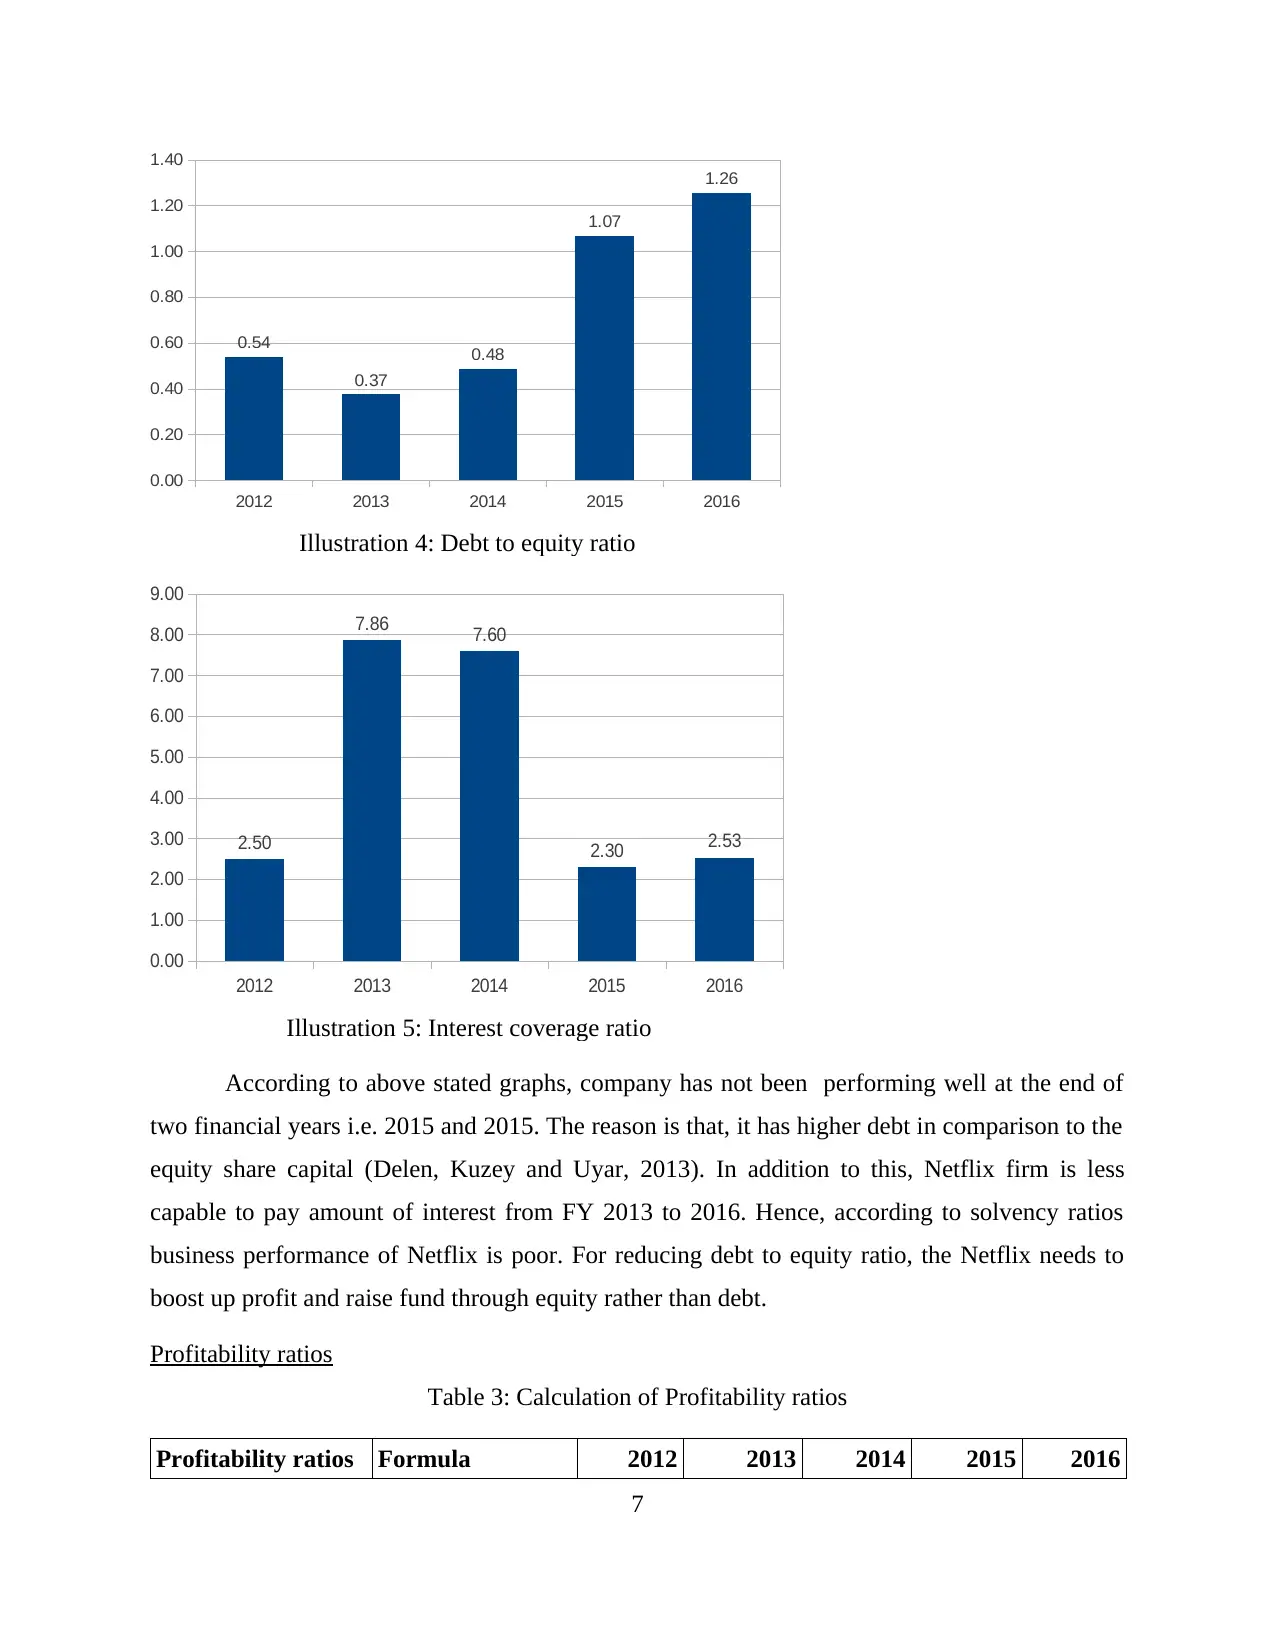
Illustration 4: Debt to equity ratio
2012 2013 2014 2015 2016
0.00
1.00
2.00
3.00
4.00
5.00
6.00
7.00
8.00
9.00
2.50
7.86 7.60
2.30 2.53
Illustration 5: Interest coverage ratio
According to above stated graphs, company has not been performing well at the end of
two financial years i.e. 2015 and 2015. The reason is that, it has higher debt in comparison to the
equity share capital (Delen, Kuzey and Uyar, 2013). In addition to this, Netflix firm is less
capable to pay amount of interest from FY 2013 to 2016. Hence, according to solvency ratios
business performance of Netflix is poor. For reducing debt to equity ratio, the Netflix needs to
boost up profit and raise fund through equity rather than debt.
Profitability ratios
Table 3: Calculation of Profitability ratios
Profitability ratios Formula 2012 2013 2014 2015 2016
7
0.00
0.20
0.40
0.60
0.80
1.00
1.20
1.40
0.54
0.37
0.48
1.07
1.26
Illustration 4: Debt to equity ratio
2012 2013 2014 2015 2016
0.00
1.00
2.00
3.00
4.00
5.00
6.00
7.00
8.00
9.00
2.50
7.86 7.60
2.30 2.53
Illustration 5: Interest coverage ratio
According to above stated graphs, company has not been performing well at the end of
two financial years i.e. 2015 and 2015. The reason is that, it has higher debt in comparison to the
equity share capital (Delen, Kuzey and Uyar, 2013). In addition to this, Netflix firm is less
capable to pay amount of interest from FY 2013 to 2016. Hence, according to solvency ratios
business performance of Netflix is poor. For reducing debt to equity ratio, the Netflix needs to
boost up profit and raise fund through equity rather than debt.
Profitability ratios
Table 3: Calculation of Profitability ratios
Profitability ratios Formula 2012 2013 2014 2015 2016
7
Paraphrase This Document
Need a fresh take? Get an instant paraphrase of this document with our AI Paraphraser
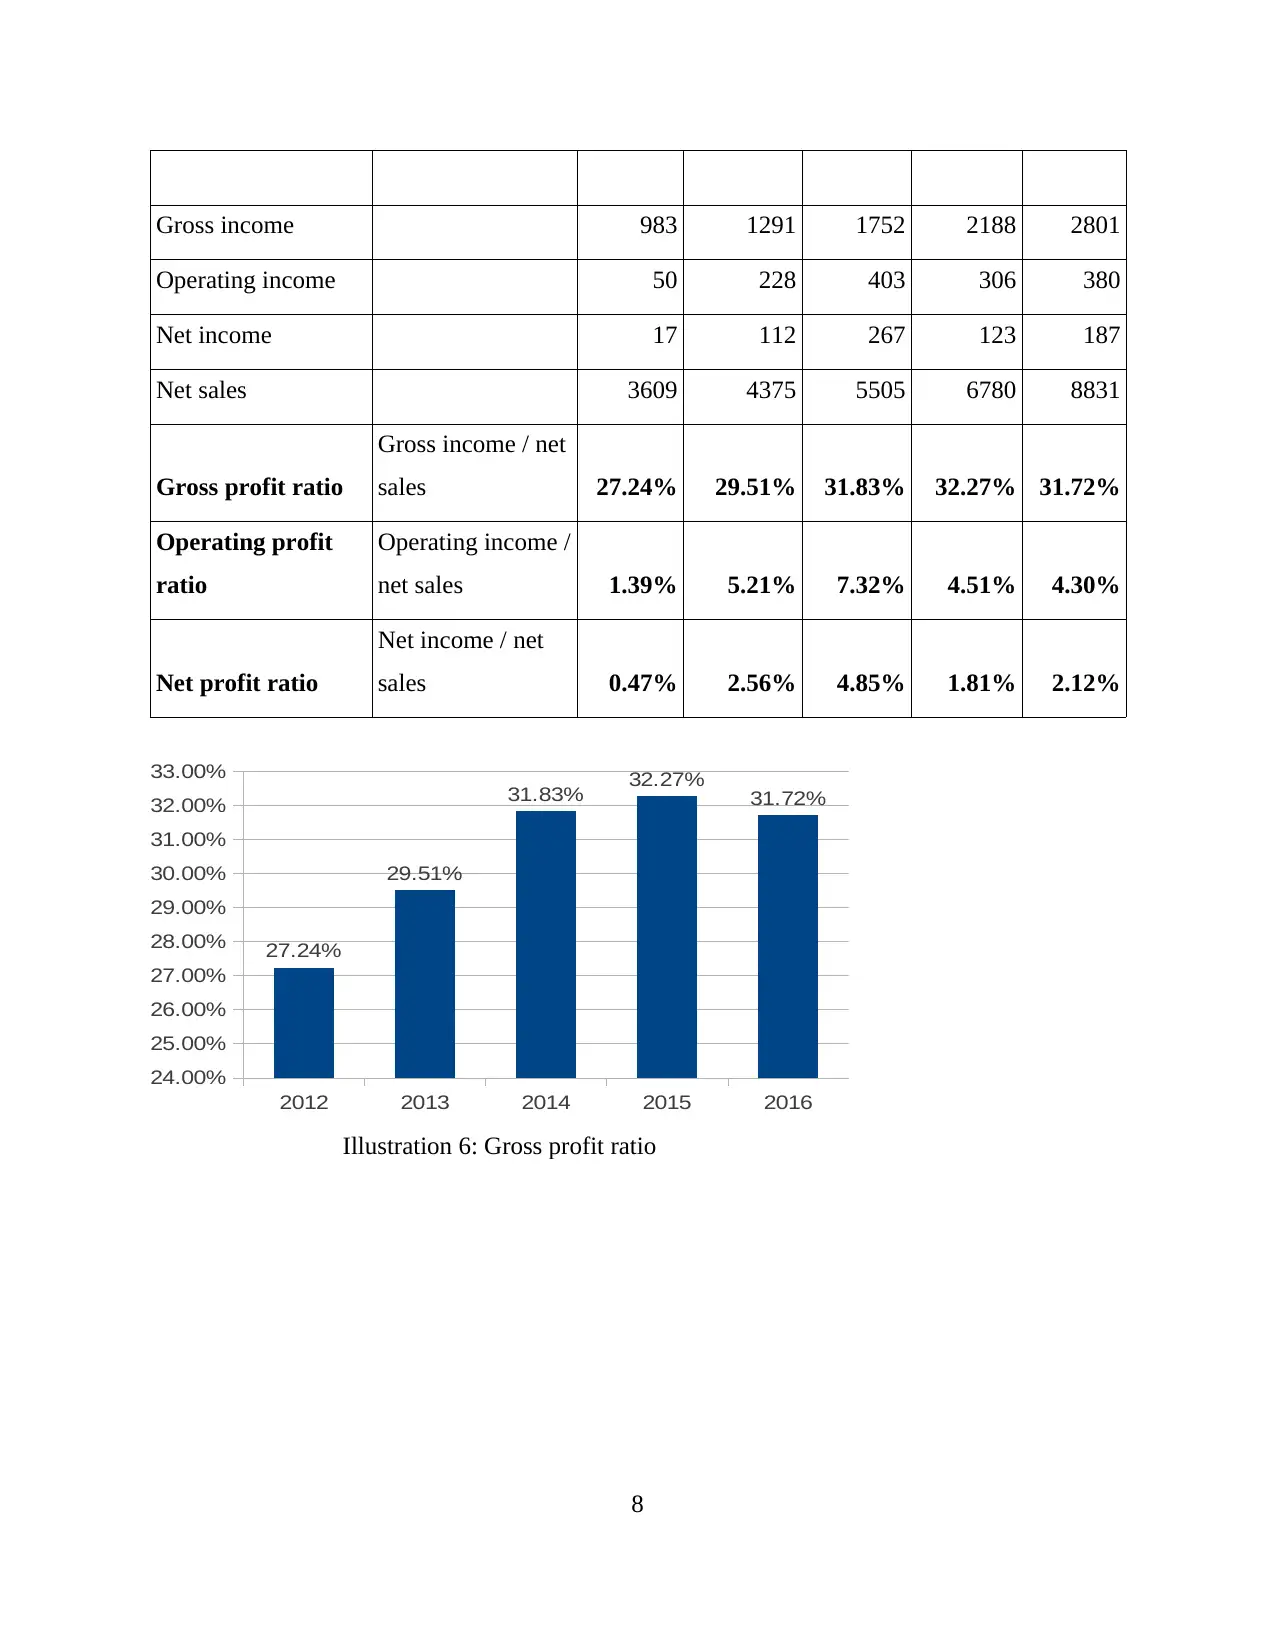
Gross income 983 1291 1752 2188 2801
Operating income 50 228 403 306 380
Net income 17 112 267 123 187
Net sales 3609 4375 5505 6780 8831
Gross profit ratio
Gross income / net
sales 27.24% 29.51% 31.83% 32.27% 31.72%
Operating profit
ratio
Operating income /
net sales 1.39% 5.21% 7.32% 4.51% 4.30%
Net profit ratio
Net income / net
sales 0.47% 2.56% 4.85% 1.81% 2.12%
2012 2013 2014 2015 2016
24.00%
25.00%
26.00%
27.00%
28.00%
29.00%
30.00%
31.00%
32.00%
33.00%
27.24%
29.51%
31.83% 32.27% 31.72%
Illustration 6: Gross profit ratio
8
2012 2013 2014 2015 2016
0.00%
1.00%
2.00%
3.00%
4.00%
5.00%
6.00%
7.00%
8.00%
1.39%
5.21%
7.32%
4.51% 4.30%
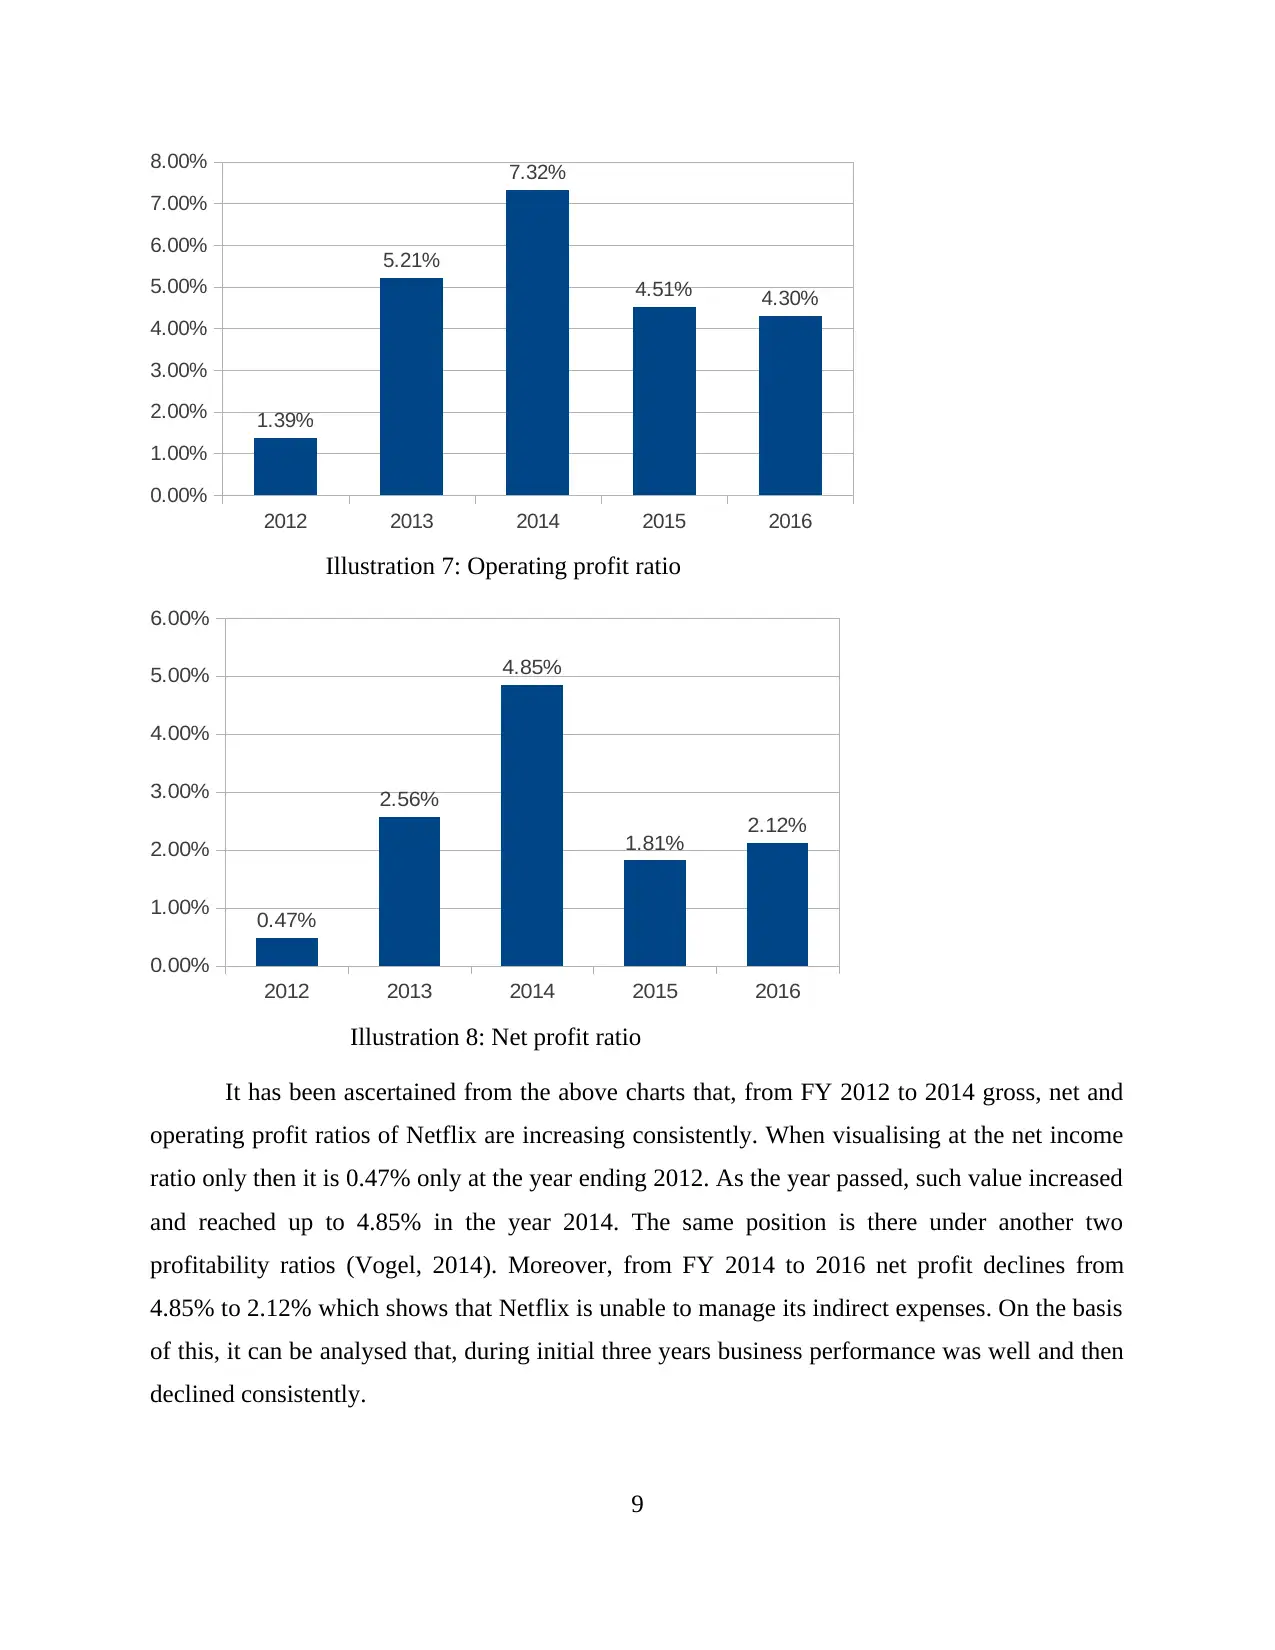
Illustration 7: Operating profit ratio
2012 2013 2014 2015 2016
0.00%
1.00%
2.00%
3.00%
4.00%
5.00%
6.00%
0.47%
2.56%
4.85%
1.81% 2.12%
Illustration 8: Net profit ratio
It has been ascertained from the above charts that, from FY 2012 to 2014 gross, net and
operating profit ratios of Netflix are increasing consistently. When visualising at the net income
ratio only then it is 0.47% only at the year ending 2012. As the year passed, such value increased
and reached up to 4.85% in the year 2014. The same position is there under another two
profitability ratios (Vogel, 2014). Moreover, from FY 2014 to 2016 net profit declines from
4.85% to 2.12% which shows that Netflix is unable to manage its indirect expenses. On the basis
of this, it can be analysed that, during initial three years business performance was well and then
declined consistently.
9
0.00%
1.00%
2.00%
3.00%
4.00%
5.00%
6.00%
7.00%
8.00%
1.39%
5.21%
7.32%
4.51% 4.30%
Illustration 7: Operating profit ratio
2012 2013 2014 2015 2016
0.00%
1.00%
2.00%
3.00%
4.00%
5.00%
6.00%
0.47%
2.56%
4.85%
1.81% 2.12%
Illustration 8: Net profit ratio
It has been ascertained from the above charts that, from FY 2012 to 2014 gross, net and
operating profit ratios of Netflix are increasing consistently. When visualising at the net income
ratio only then it is 0.47% only at the year ending 2012. As the year passed, such value increased
and reached up to 4.85% in the year 2014. The same position is there under another two
profitability ratios (Vogel, 2014). Moreover, from FY 2014 to 2016 net profit declines from
4.85% to 2.12% which shows that Netflix is unable to manage its indirect expenses. On the basis
of this, it can be analysed that, during initial three years business performance was well and then
declined consistently.
9
⊘ This is a preview!⊘
Do you want full access?
Subscribe today to unlock all pages.
Trusted by 1+ million students worldwide
1 out of 24
Related Documents


Your All-in-One AI-Powered Toolkit for Academic Success.
+13062052269
info@desklib.com
Available 24*7 on WhatsApp / Email
![[object Object]](/_next/static/media/star-bottom.7253800d.svg)
Unlock your academic potential
Copyright © 2020–2026 A2Z Services. All Rights Reserved. Developed and managed by ZUCOL.