Netflix Performance Analysis: MS Excel Task and Data Interpretation
VerifiedAdded on 2023/06/08
|12
|2151
|459
Practical Assignment
AI Summary
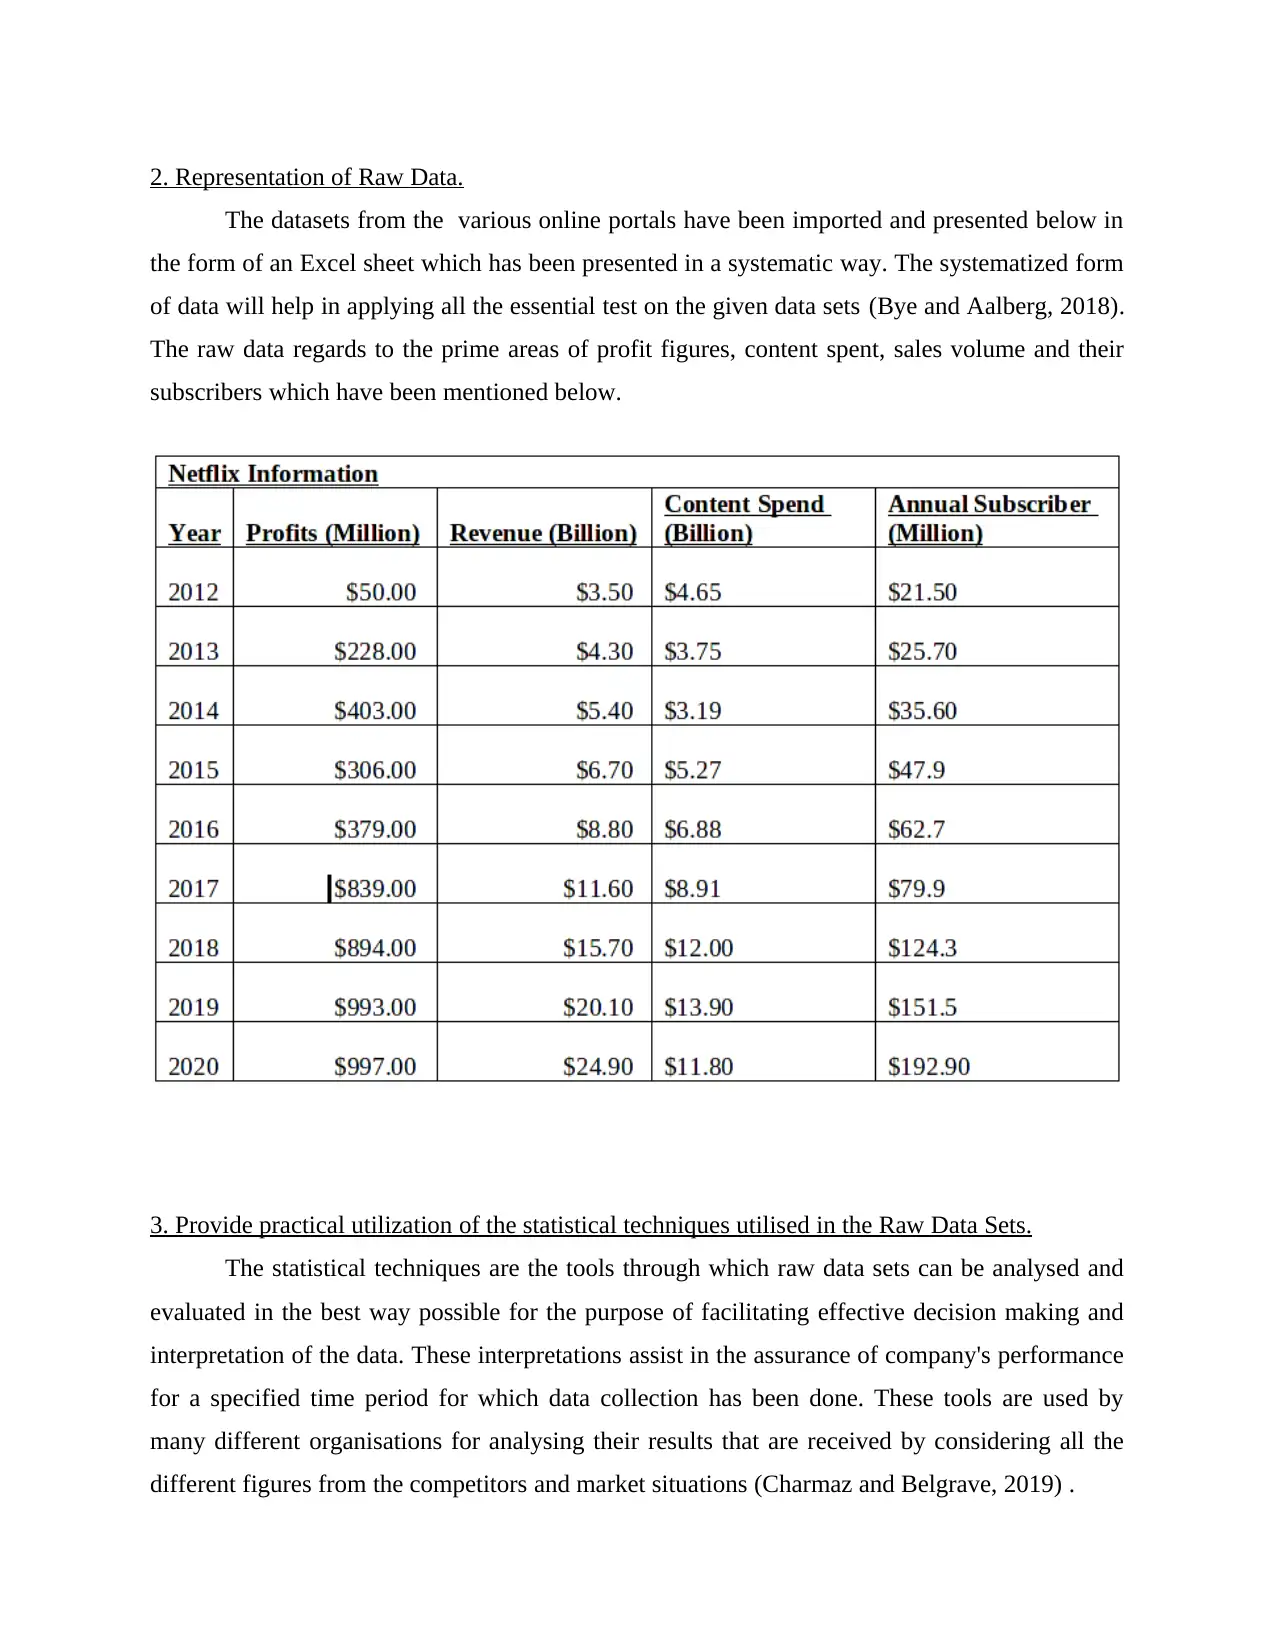
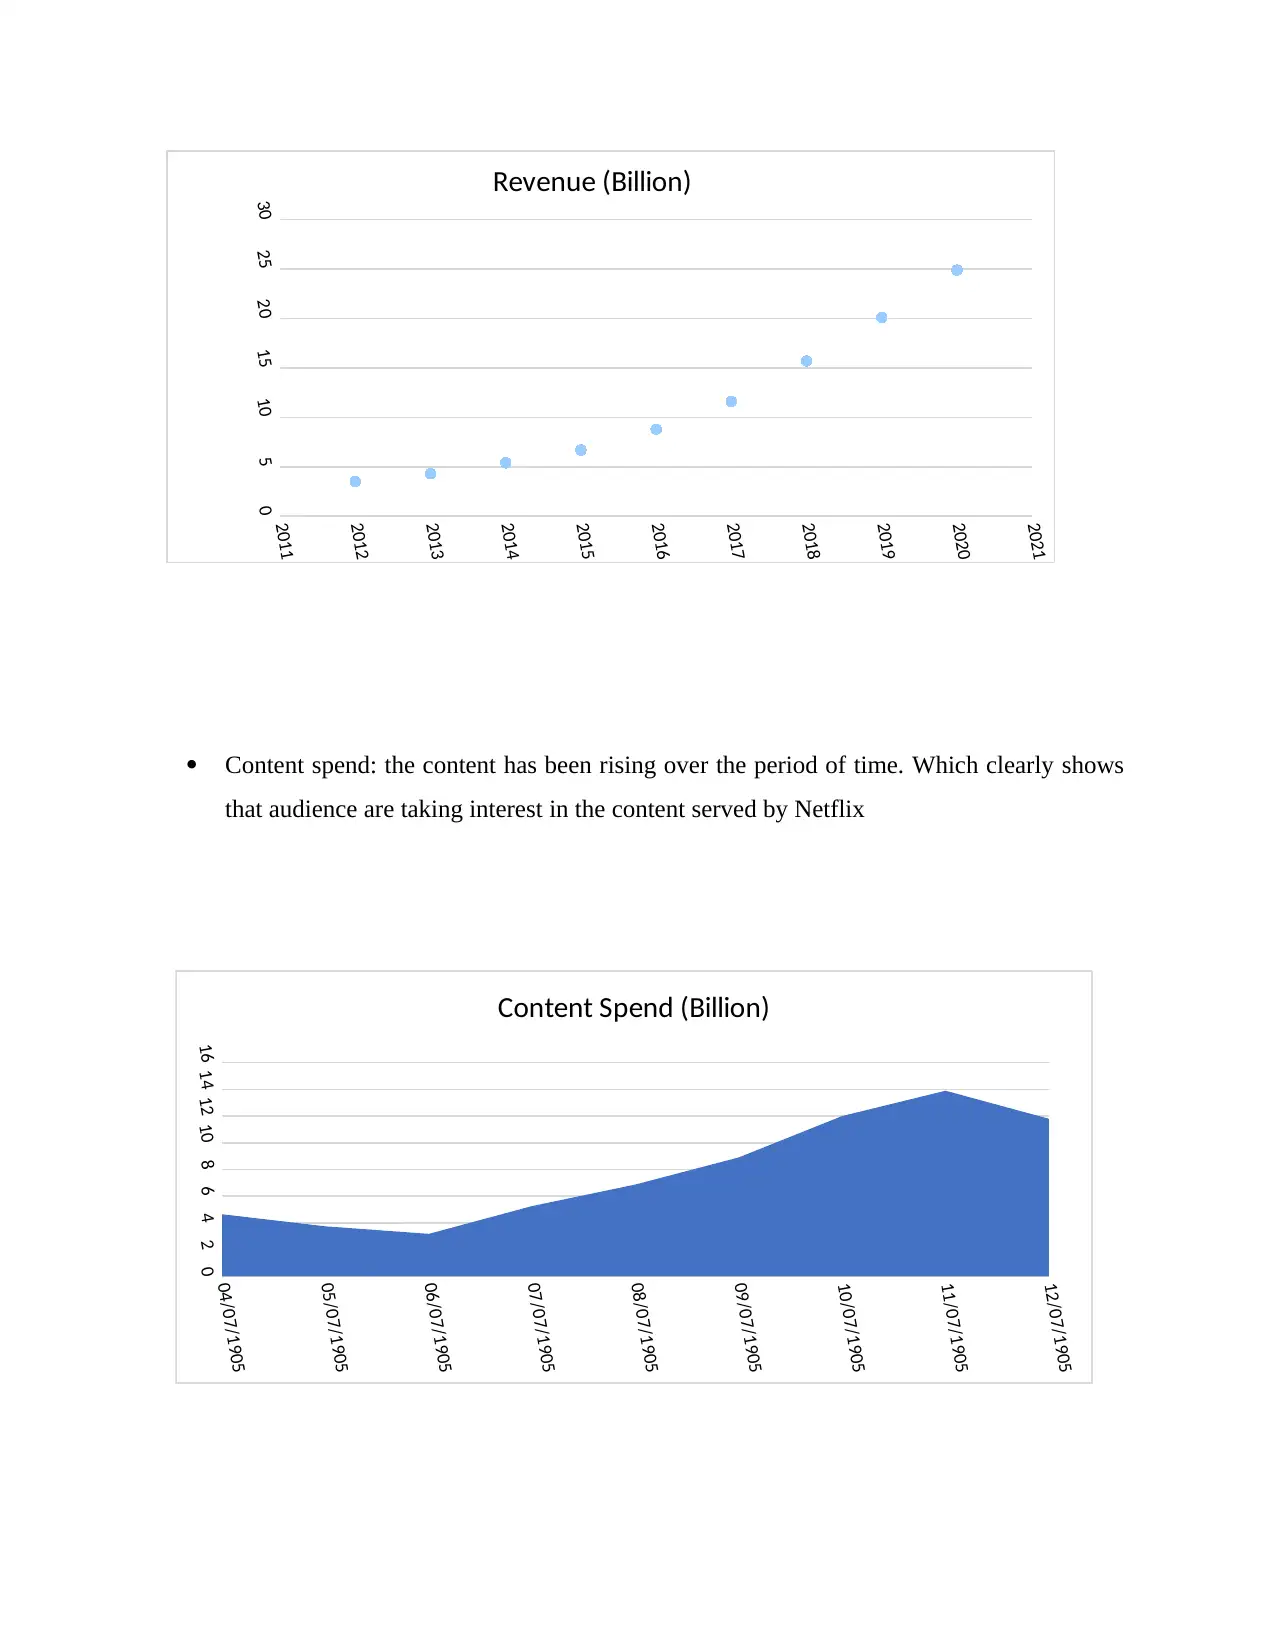
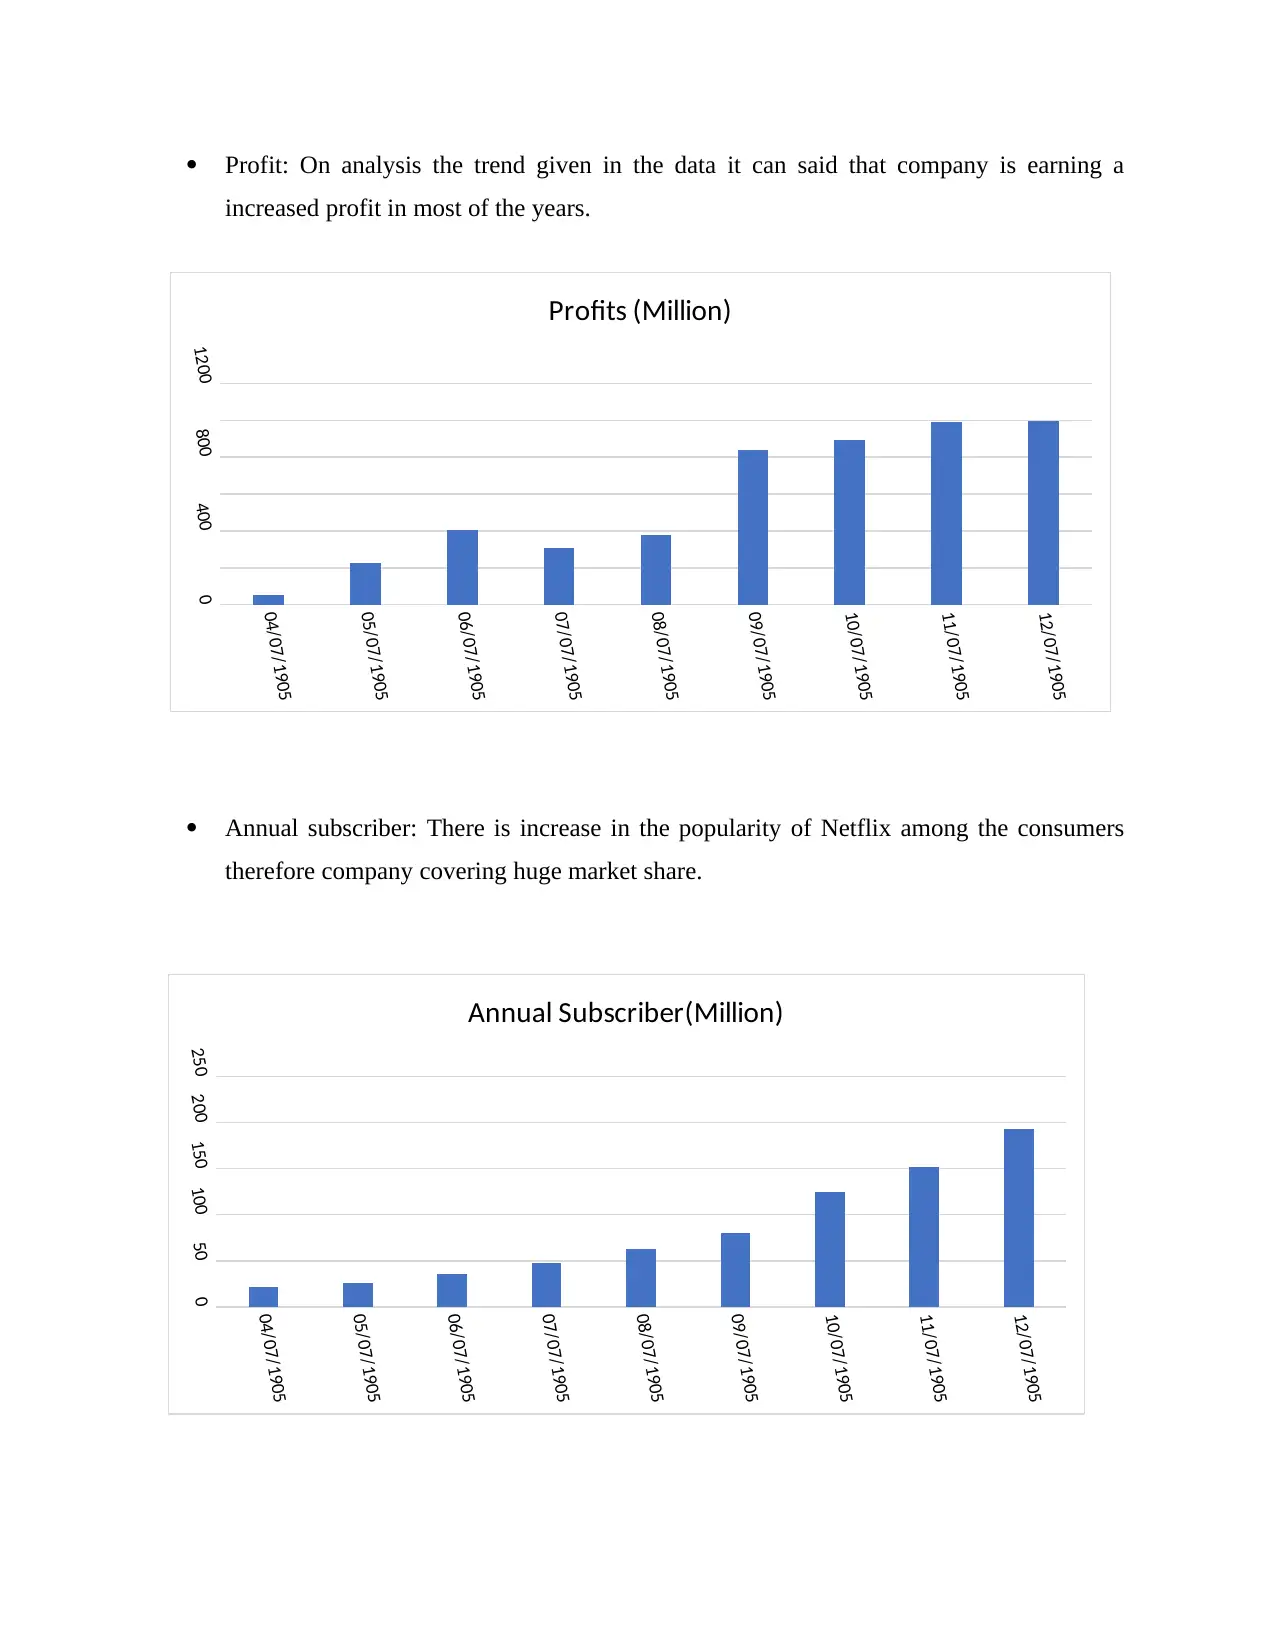
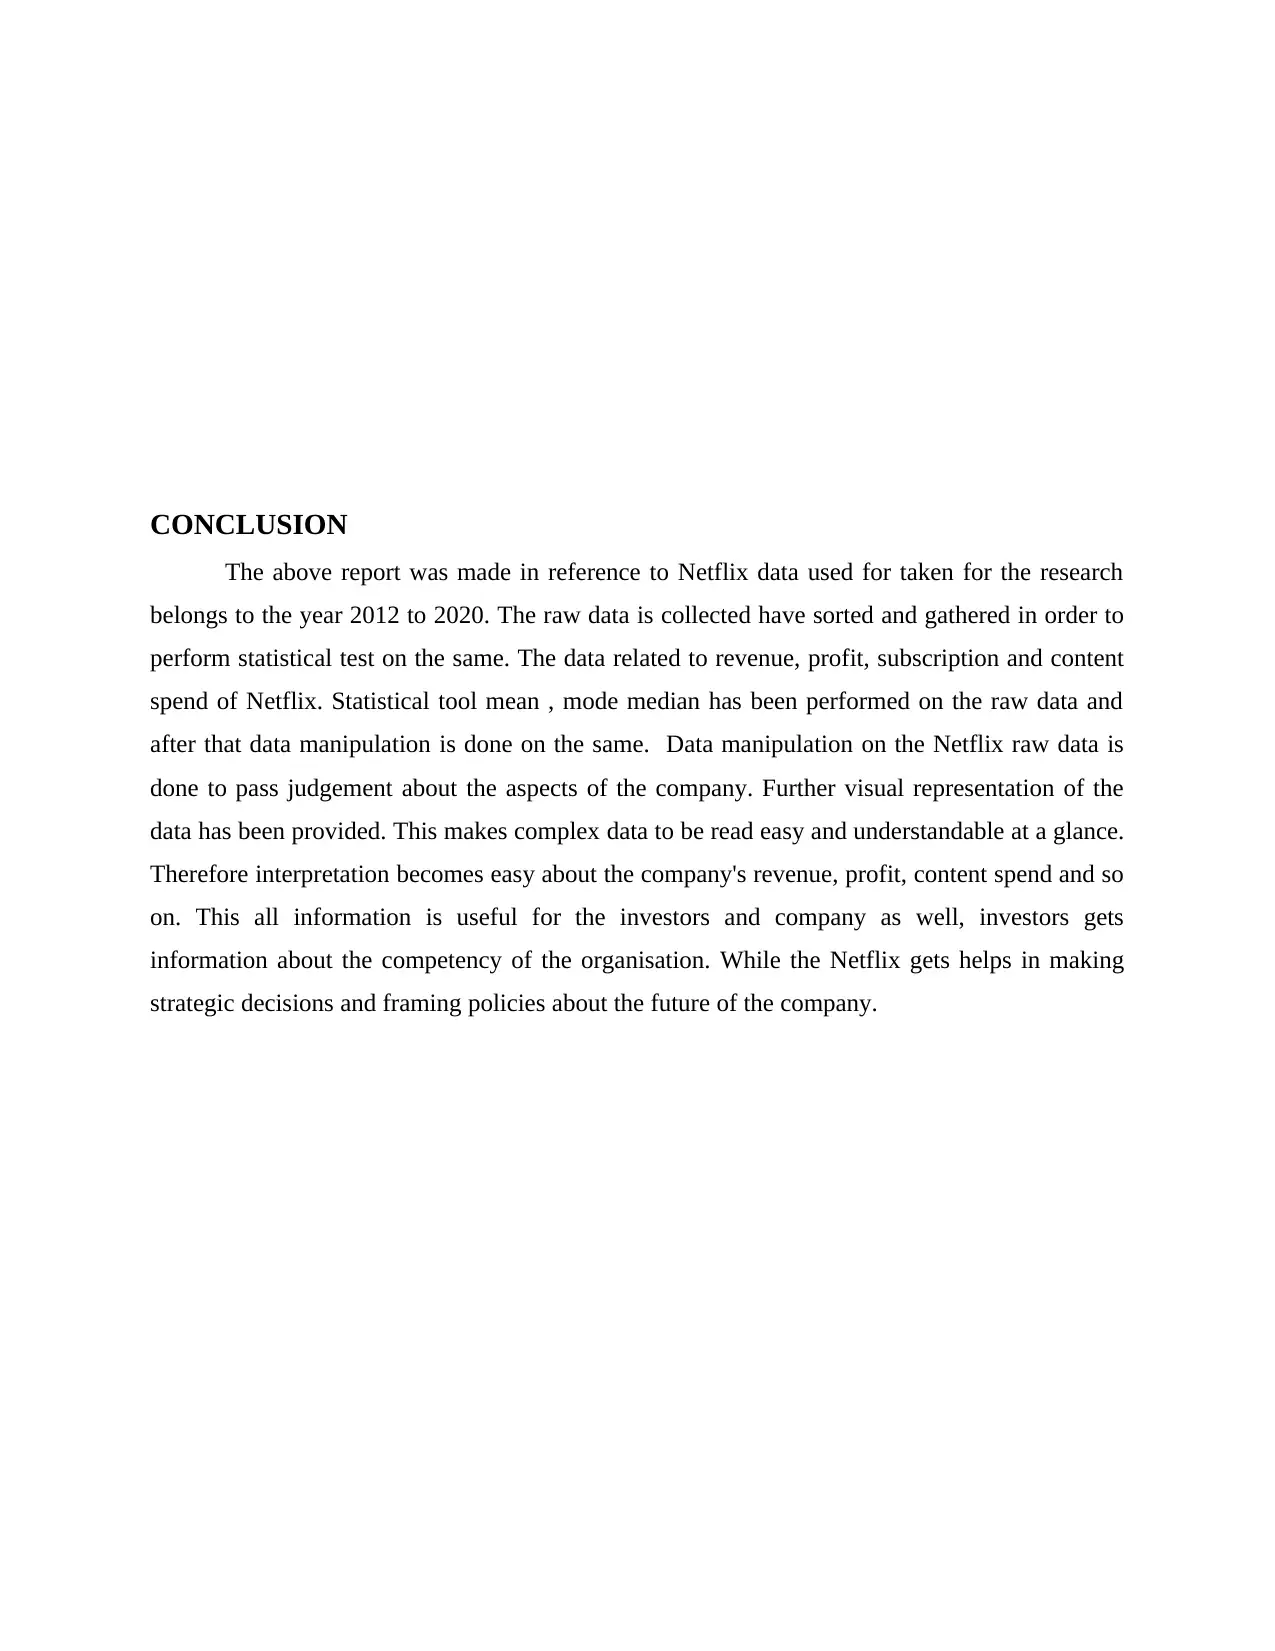
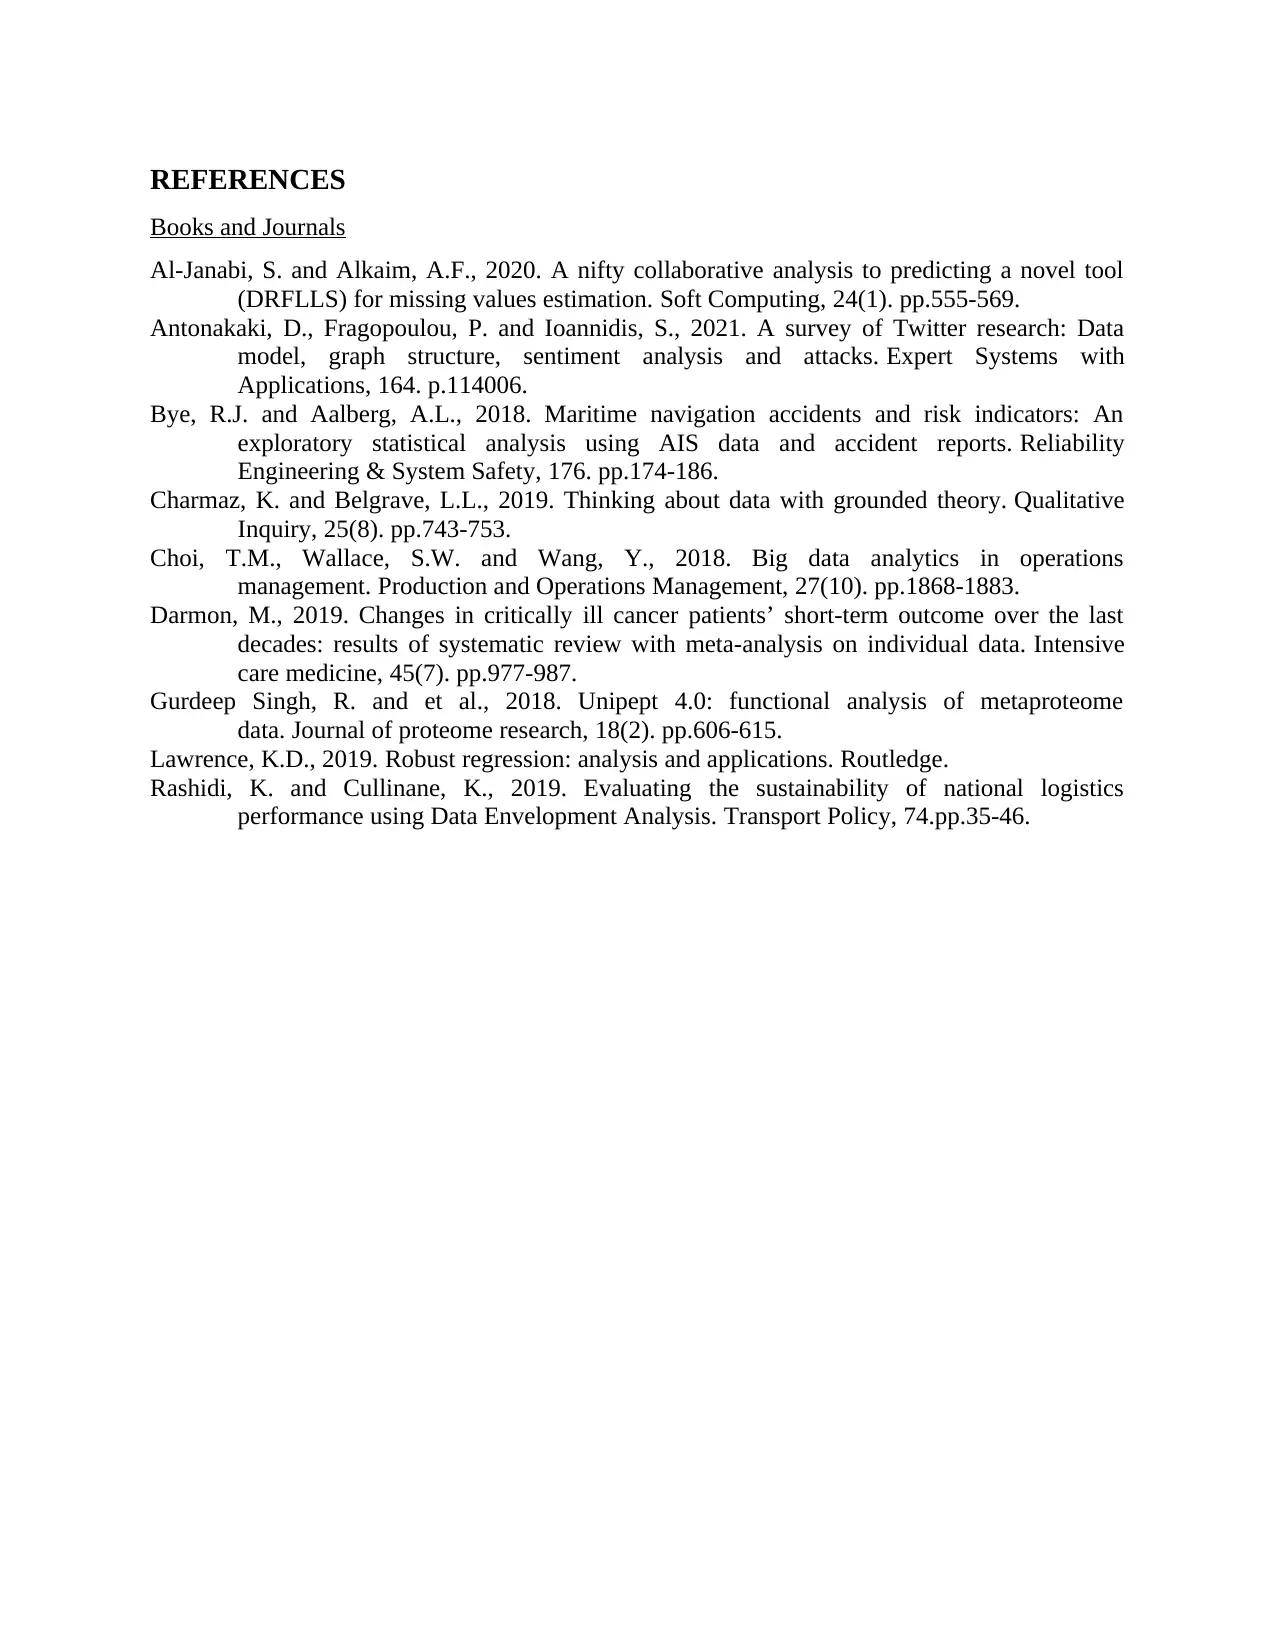
This report analyzes Netflix's financial and subscriber data from 2012 to 2020 using MS Excel. The introduction provides context, focusing on the company's revenue, subscribers, and profits. The main body begins with a definition of the research subject, followed by the representation of raw data in an Excel sheet. The report then details the practical utilization of statistical techniques like mean, median, and mode to analyze revenue, content spend, and subscriber data. Data manipulation techniques, including sum, average, count, minimum, and maximum functions, are discussed. The report also includes visual representations of the data with charts and graphs to illustrate trends in revenue, content spending, profit, and subscriber growth over time. The conclusion summarizes the findings, highlighting the insights gained from the data analysis, and the references section lists the sources used in the report. The report is aimed at providing an understanding of Netflix's performance and the application of data analysis techniques in MS Excel.

MS EXCEL TASK
Secure Best Marks with AI Grader
Need help grading? Try our AI Grader for instant feedback on your assignments.

Table of Contents
MS EXCEL TASK..........................................................................................................................1
INTRODUCTION ..........................................................................................................................3
MAIN BODY...................................................................................................................................3
1. Briefly define the Research subject.........................................................................................3
2. Representation of Raw Data....................................................................................................4
3. Provide practical utilization of the statistical techniques utilised in the Raw Data Sets.........4
4. Discuss the techniques for Data manipulation:.......................................................................6
5. Show the visual representation of the data set with the help of charts and graphs ................8
CONCLUSION .............................................................................................................................11
REFERENCES..............................................................................................................................12

INTRODUCTION
This report is prepared for OTT platform Netflix, the data collected is raw data
information about the company's revenue, subscriber, profit earned and people got linked to the
organisation (Al-Janabi and Alkaim, 2020) . In this report the data being used and gathered have
been represented in tables and graph to make visual representation understandable easily. Further
statistical tool are used on the data for better evaluation. Mean, mode and median are performed
on the information gathered. Functions such as average, summation and count has also to be
performed. This all tools and statistical techniques are helpful making strategies that is capable
for beating market competition. This report also studies methods of statistical analysis and
implement on the organisation to
MAIN BODY
1. Briefly define the Research subject.
The report formulated acknowledges the various topics of research that are related to
Netflix which is an American subscription streaming service provider. The existence of Netflix
dates back to the month of august in 1997 as a platform for providing diverse varieties such as
television series library and films that were provided with two distinct areas of either the
distribution deals or Netflix own label productions named as Netflix originals (Antonakaki,
Fragopoulou and Ioannidis, 2021). This report consists of the raw data of Netflix that has been
collected from various online sources in the time period of 8 years which is from 2012-2020 that
aims to display the profits that the platform has earned in this time period. The process after the
raw data accumulation utilises various distinctive tools and statistical techniques which assist in
the manipulation of data sets and their interpretation for the purpose of providing data
judgements. In the end, a graphical demonstration of the data has been provided so that the
performance can be measured and evaluated in a particular way.

2. Representation of Raw Data.
The datasets from the various online portals have been imported and presented below in
the form of an Excel sheet which has been presented in a systematic way. The systematized form
of data will help in applying all the essential test on the given data sets (Bye and Aalberg, 2018).
The raw data regards to the prime areas of profit figures, content spent, sales volume and their
subscribers which have been mentioned below.
3. Provide practical utilization of the statistical techniques utilised in the Raw Data Sets.
The statistical techniques are the tools through which raw data sets can be analysed and
evaluated in the best way possible for the purpose of facilitating effective decision making and
interpretation of the data. These interpretations assist in the assurance of company's performance
for a specified time period for which data collection has been done. These tools are used by
many different organisations for analysing their results that are received by considering all the
different figures from the competitors and market situations (Charmaz and Belgrave, 2019) .
Secure Best Marks with AI Grader
Need help grading? Try our AI Grader for instant feedback on your assignments.

Mean: As a measure of central tendency, mean is used to calculate the average of the entire data
set present. For the purpose of calculating mean, the organisation should first apply
summation in the entire data set collected and divide the sum of the entire data with the total
number of units present (Choi, Wallaces and Wang, 2018). In this report, the information of
data set of Netflix is used for calculating the revenue and the o profits of the company that it
generated for a specific time period of 8 years, from 2012 to 2020. it was realised to be
around $ 545.44 Million and $ 11.22 billion respectively for the two years. The mean value
of the yearly subscriber is represented as $ 82.44 million which shows that Netflix has
developed itself as the leader in the streaming industry globally.
Median: It is another measure of central tendency and uses the data information to calculate the
middle value which can portray the information regarding the entire data set. It is defined to
be evaluated with the help of finding the mid element from the Data set present with the
company. For the purpose of computing median, the data set is first sorted in either
ascending or descending order and then the middle value is termed to be the median. The
median calculated for Netflix came to be $8.80, $62.70, $403, $6.88 respectively which
displays the median for content spread, subscriber and revenue
Mode: It refers to the highest frequency which is present in the data set and is repetitive in
nature. It specifically interprets the value which has occurred most number of time in the
data information and for Netflix there exists no value which has highest frequency (Darmon,
2019). Hence the mode for the data set below is N/A which shows that there is no value of
recurring nature in the entire collection of data in any area of content spent, revenue
generated, profits earned or yearly subscribers for 8 years, 2012 to 2020.

The screenshot of the method which has been applied for carrying out statistical techniques has
been stated as under:
4. Discuss the techniques for Data manipulation:
The data manipulation is method of arranging data in such a way that it becomes easier
to understand, interpretative and read (Gurdeep Singh, and et al., 2018). The tools used for data
manipulation is statistical method such as maximum and minimum value, summation of data,
average function and count. These all are used as parameter for interpretation and analysis of the

data. Theses makes final reports easy interpretations to get accurate results. In the report case of
Netflix is discussed data manipulation is used to study the data related to the company. The
technique is implemented for checking the accuracy and reliability of the outcome. The sum
function gives the total figure for the adds. The average function divided the data in two and give
a number that represents the whole data. The count function allows the company to know the
number of observation in data set. The extreme point and lowest point is understood by applying
the minimum and maximum function (Lawrence, 2019). These following methods are used in
the spreadsheet to get the desired result are shown in here by screenshot attached below.
Netflix Information
Year
Profits
(Million)
Revenue
(Billion)
Content Spend
(Billion)
Annual Subscriber
(Million)
2012
$
50.00
$
3.50
$
4.65
$
21.50
2013
$
228.00
$
4.30
$
3.75
$
25.70
2014
$
403.00
$
5.40
$
3.19
$
35.60
2015
$
306.00
$
6.70
$
5.27
$
47.90
2016
$
379.00
$
8.80
$
6.88
$
62.70
2017
$
839.00
$
11.60
$
8.91
$
79.90
2018
$
894.00
$
15.70
$
12.00
$
124.30
2019
$
993.00
$
20.10
$
13.90
$
151.50
2020
$
997.00
$
24.90
$
11.80
$
192.90
Paraphrase This Document
Need a fresh take? Get an instant paraphrase of this document with our AI Paraphraser

Data Manipulation: -
Minimum
$
50.00
$
3.50
$
3.19
$
21.50
Maximum
$
997.00
$
24.90
$
13.90
$
192.90
Sum
$
5,089.00
$
101.00
$
70.35
$
742.00
Average
$
565.44
$
11.22
$
7.82
$
82.44
Count 9 9 9 9
5. Show the visual representation of the data set with the help of charts and graphs
The graph represented below is based on data gathered from the raw sources providing
information about Netflix. This graph represents the performance of the company over a period
of time (Rashidi and Cullinane, 2019).
Revenue: Netflix have became a brand in the market of OTT platform, it is functioning
across the globe. There the company's revenue is going higher by passage of time. It also
depicts that company is making best use of technology and resources available with it.

Content spend: the content has been rising over the period of time. Which clearly shows
that audience are taking interest in the content served by Netflix
2011
2012
2013
2014
2015
2016
2017
2018
2019
2020
2021
051015202530
Revenue (Billion)
04/07/1905
05/07/1905
06/07/1905
07/07/1905
08/07/1905
09/07/1905
10/07/1905
11/07/1905
12/07/1905
0246810121416
Content Spend (Billion)
that audience are taking interest in the content served by Netflix
2011
2012
2013
2014
2015
2016
2017
2018
2019
2020
2021
051015202530
Revenue (Billion)
04/07/1905
05/07/1905
06/07/1905
07/07/1905
08/07/1905
09/07/1905
10/07/1905
11/07/1905
12/07/1905
0246810121416
Content Spend (Billion)

Profit: On analysis the trend given in the data it can said that company is earning a
increased profit in most of the years.
Annual subscriber: There is increase in the popularity of Netflix among the consumers
therefore company covering huge market share.
04/07/1905
05/07/1905
06/07/1905
07/07/1905
08/07/1905
09/07/1905
10/07/1905
11/07/1905
12/07/1905
0
400
800
1200
Profits (Million)
04/07/1905
05/07/1905
06/07/1905
07/07/1905
08/07/1905
09/07/1905
10/07/1905
11/07/1905
12/07/1905
050100150200250
Annual Subscriber(Million)
Secure Best Marks with AI Grader
Need help grading? Try our AI Grader for instant feedback on your assignments.

CONCLUSION
The above report was made in reference to Netflix data used for taken for the research
belongs to the year 2012 to 2020. The raw data is collected have sorted and gathered in order to
perform statistical test on the same. The data related to revenue, profit, subscription and content
spend of Netflix. Statistical tool mean , mode median has been performed on the raw data and
after that data manipulation is done on the same. Data manipulation on the Netflix raw data is
done to pass judgement about the aspects of the company. Further visual representation of the
data has been provided. This makes complex data to be read easy and understandable at a glance.
Therefore interpretation becomes easy about the company's revenue, profit, content spend and so
on. This all information is useful for the investors and company as well, investors gets
information about the competency of the organisation. While the Netflix gets helps in making
strategic decisions and framing policies about the future of the company.

REFERENCES
Books and Journals
Al-Janabi, S. and Alkaim, A.F., 2020. A nifty collaborative analysis to predicting a novel tool
(DRFLLS) for missing values estimation. Soft Computing, 24(1). pp.555-569.
Antonakaki, D., Fragopoulou, P. and Ioannidis, S., 2021. A survey of Twitter research: Data
model, graph structure, sentiment analysis and attacks. Expert Systems with
Applications, 164. p.114006.
Bye, R.J. and Aalberg, A.L., 2018. Maritime navigation accidents and risk indicators: An
exploratory statistical analysis using AIS data and accident reports. Reliability
Engineering & System Safety, 176. pp.174-186.
Charmaz, K. and Belgrave, L.L., 2019. Thinking about data with grounded theory. Qualitative
Inquiry, 25(8). pp.743-753.
Choi, T.M., Wallace, S.W. and Wang, Y., 2018. Big data analytics in operations
management. Production and Operations Management, 27(10). pp.1868-1883.
Darmon, M., 2019. Changes in critically ill cancer patients’ short-term outcome over the last
decades: results of systematic review with meta-analysis on individual data. Intensive
care medicine, 45(7). pp.977-987.
Gurdeep Singh, R. and et al., 2018. Unipept 4.0: functional analysis of metaproteome
data. Journal of proteome research, 18(2). pp.606-615.
Lawrence, K.D., 2019. Robust regression: analysis and applications. Routledge.
Rashidi, K. and Cullinane, K., 2019. Evaluating the sustainability of national logistics
performance using Data Envelopment Analysis. Transport Policy, 74.pp.35-46.
1 out of 12
Related Documents

Your All-in-One AI-Powered Toolkit for Academic Success.
+13062052269
info@desklib.com
Available 24*7 on WhatsApp / Email
Unlock your academic potential
© 2024 | Zucol Services PVT LTD | All rights reserved.