BA30589E - Netflix Performance: A Statistical Analysis and Report
VerifiedAdded on 2023/06/12
|11
|1875
|295
Report
AI Summary
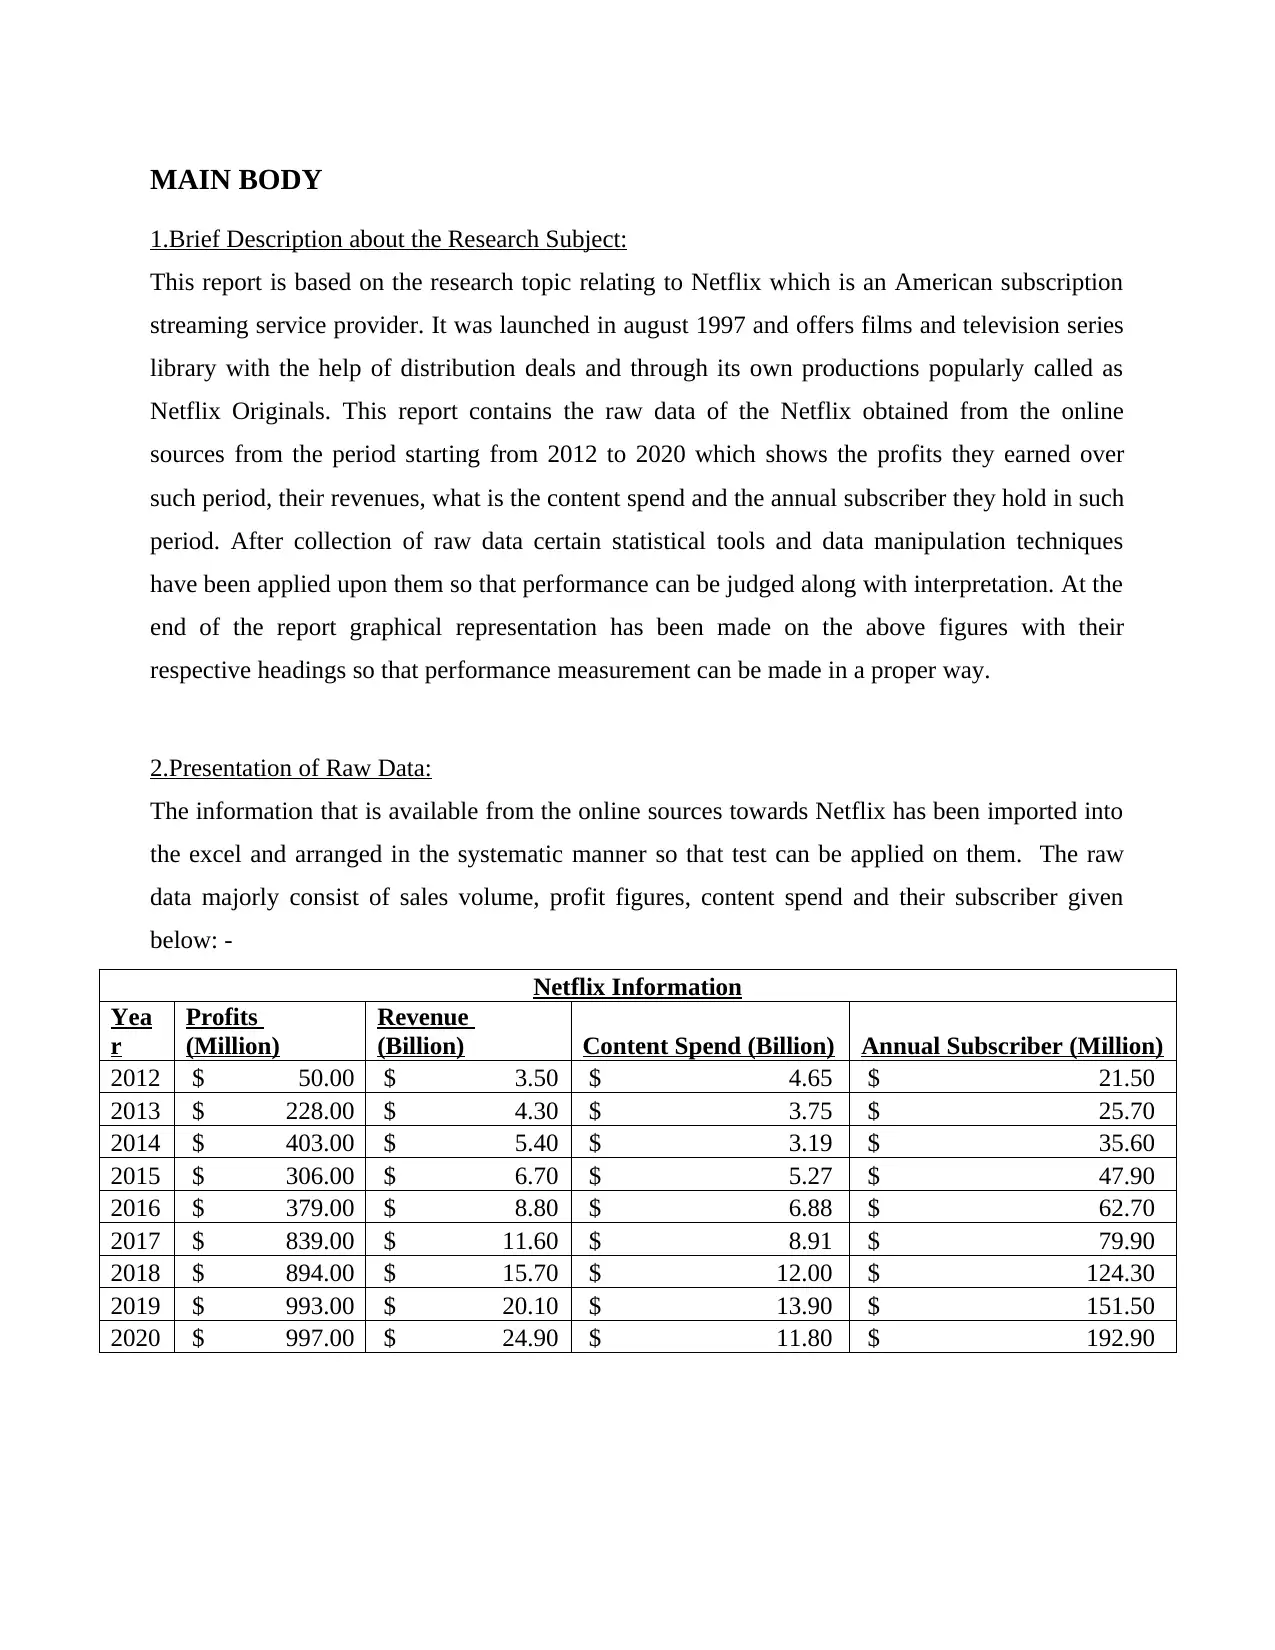
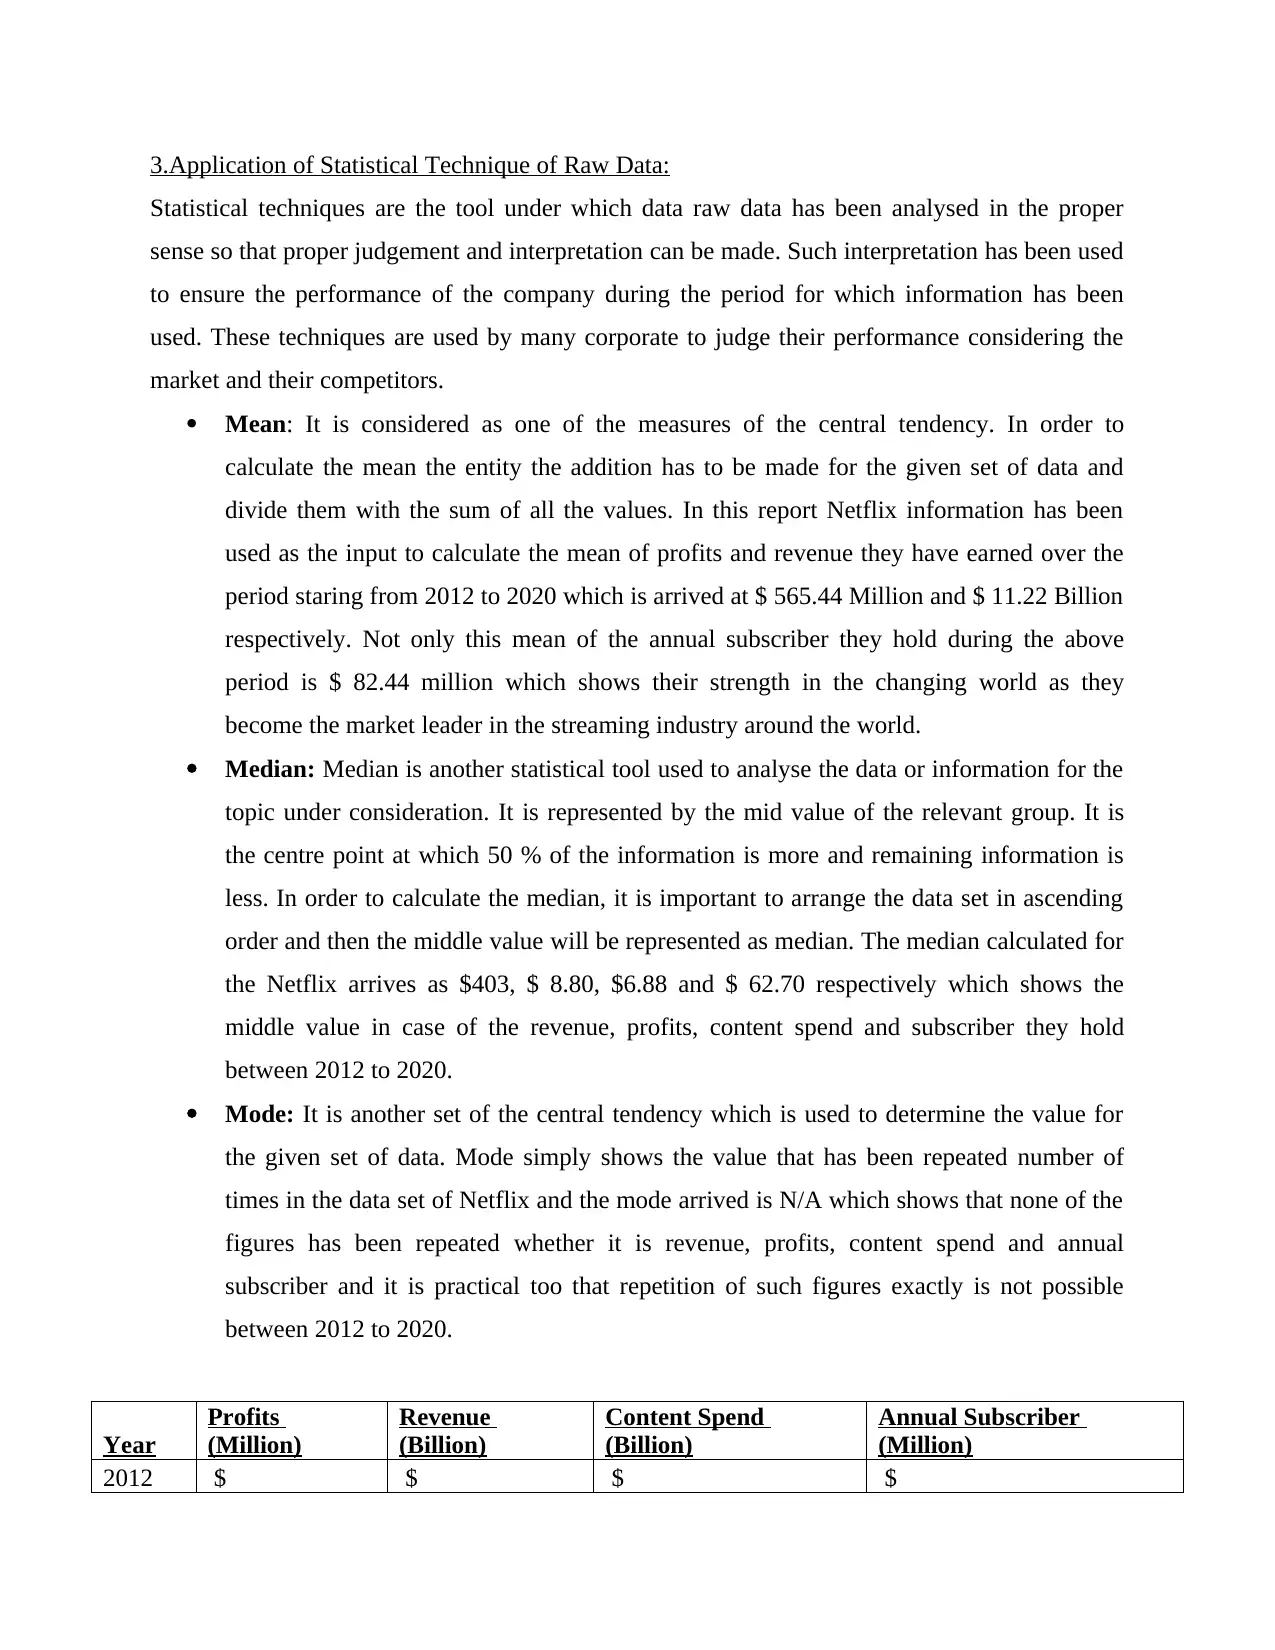
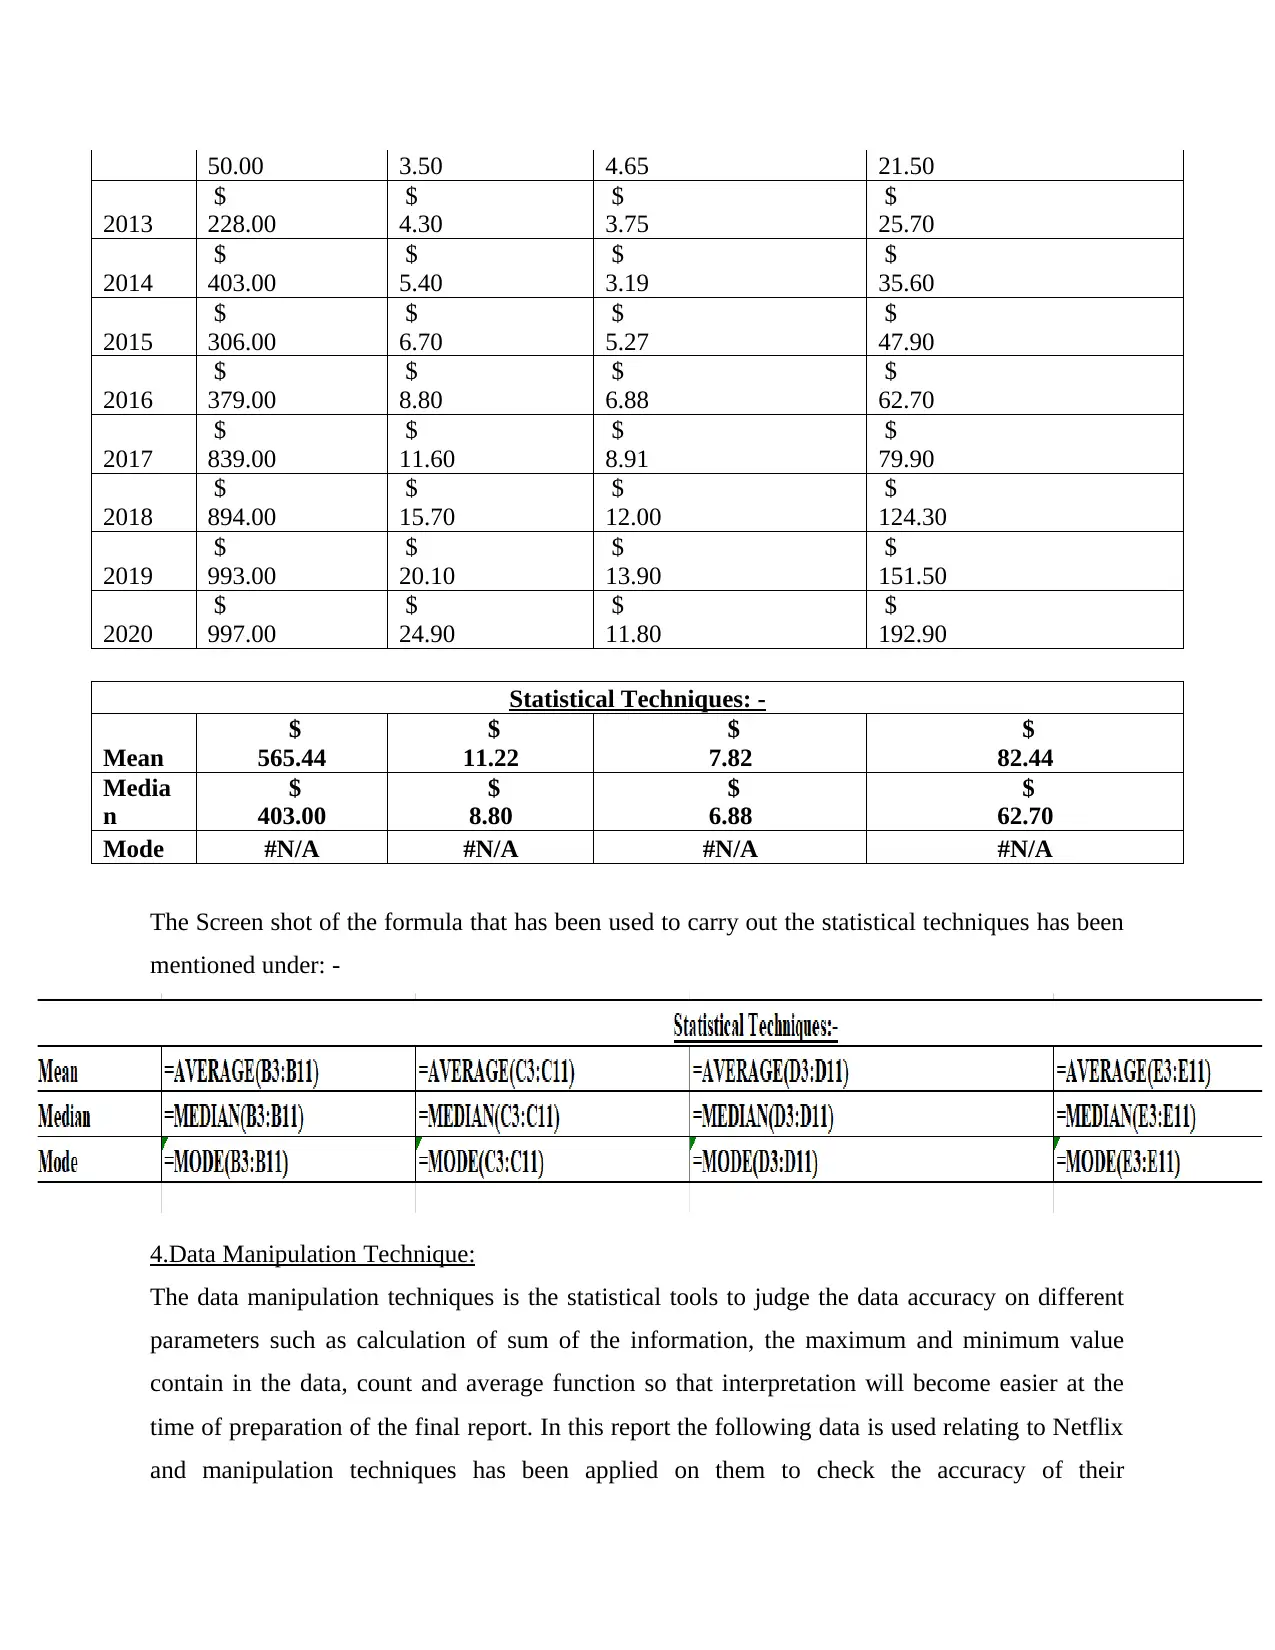
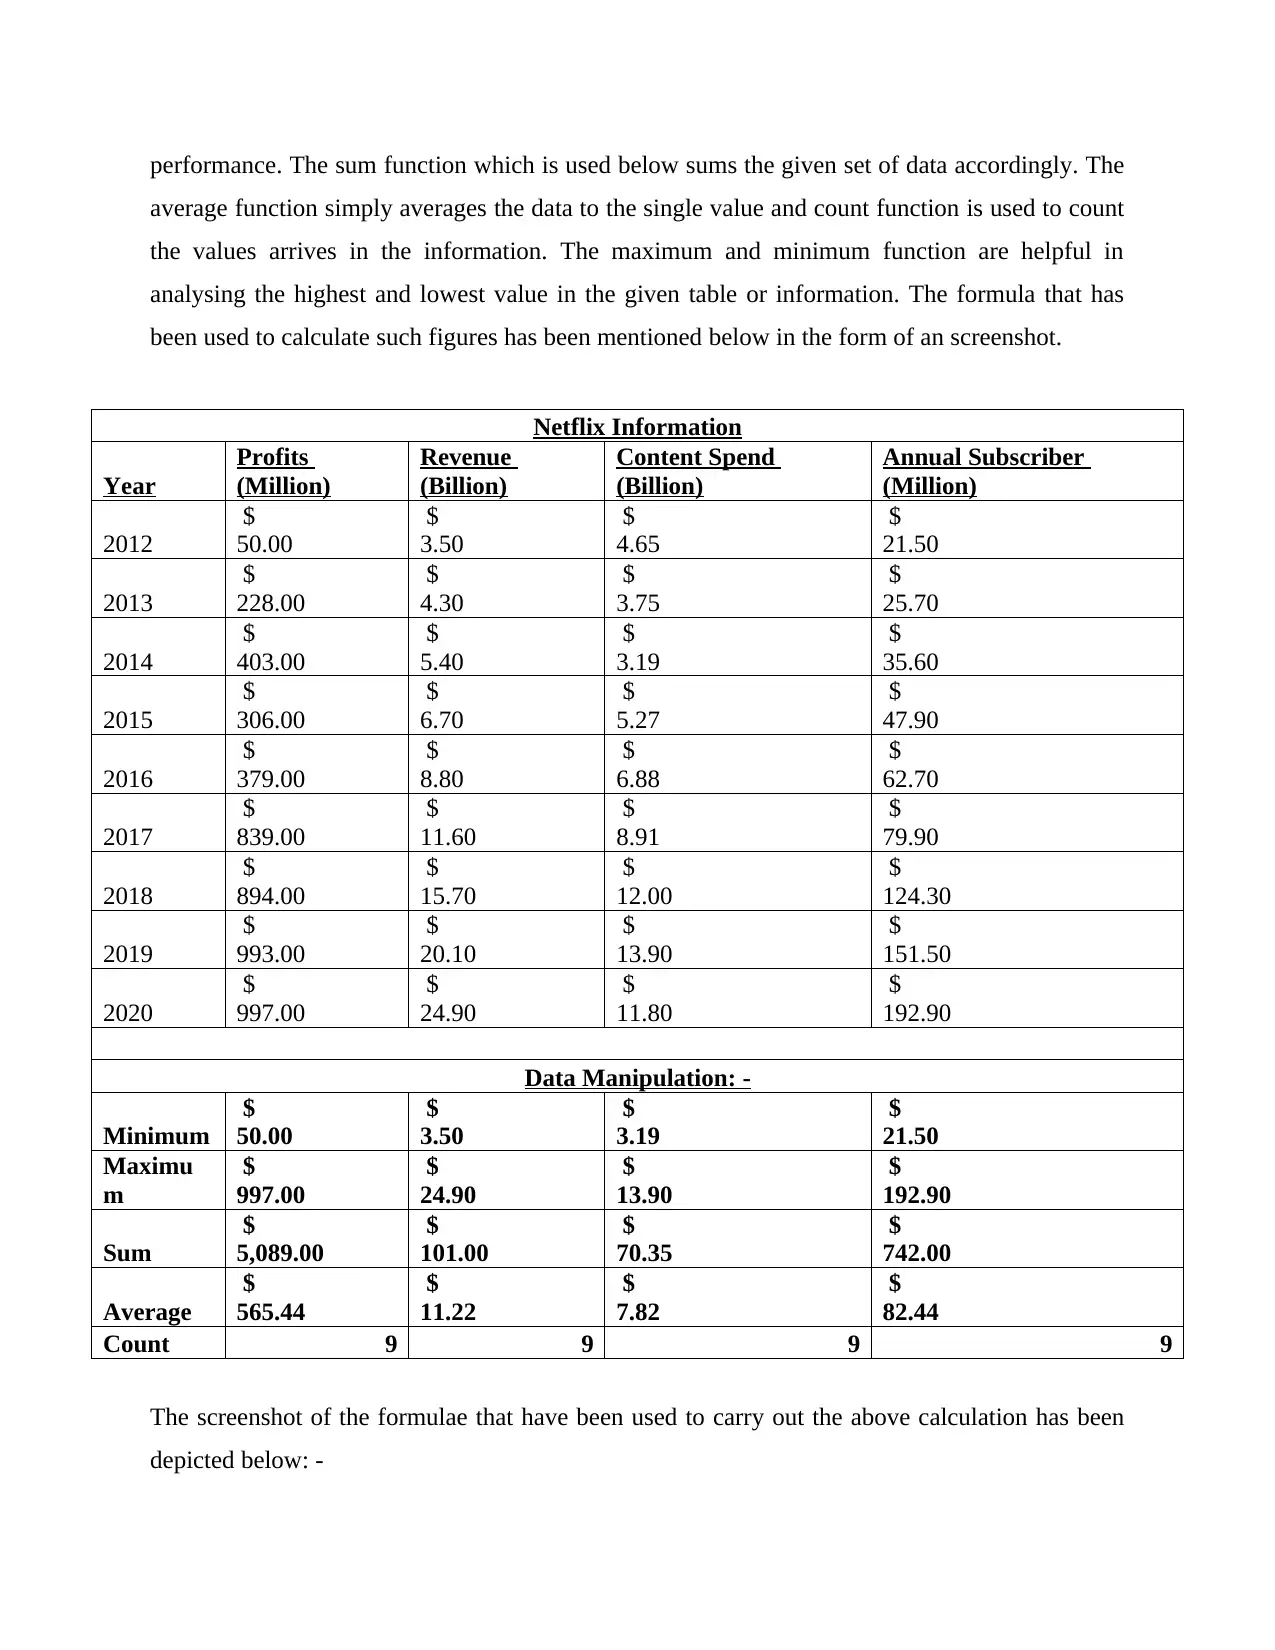
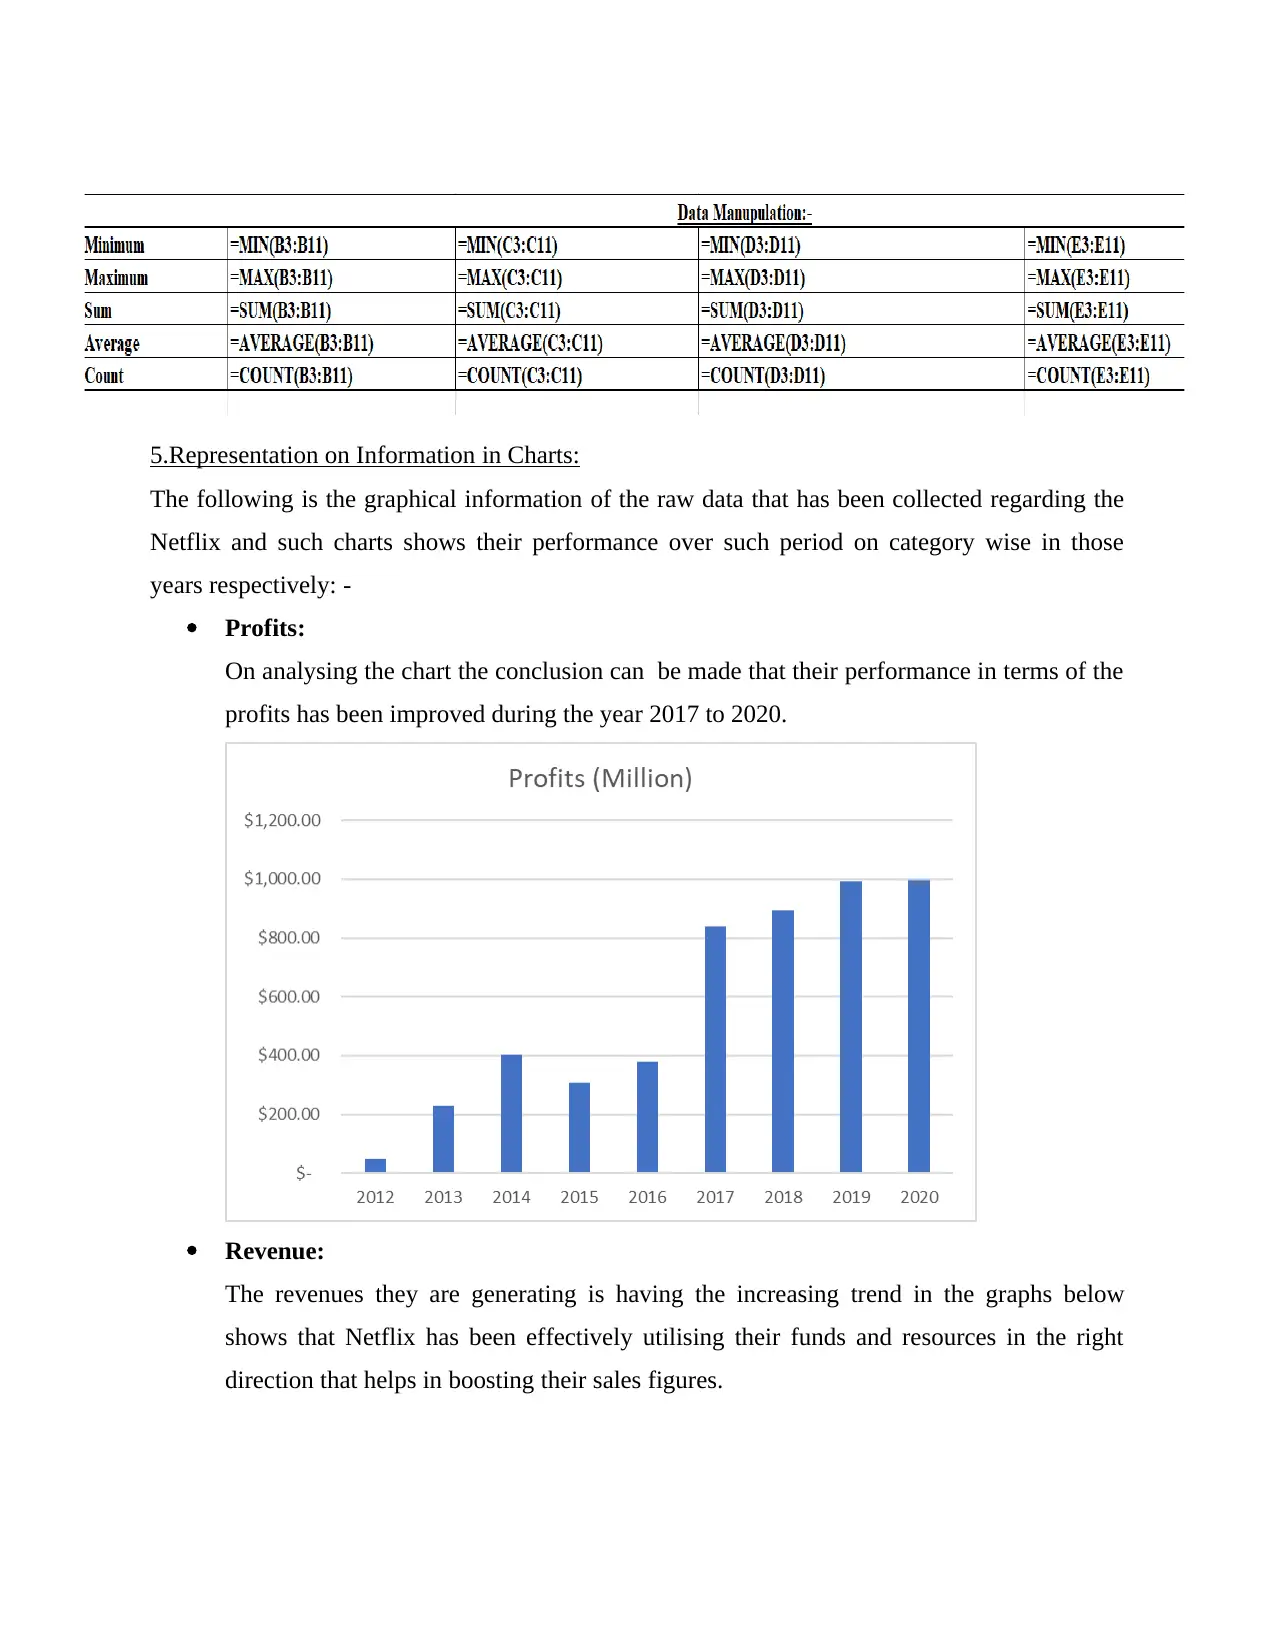
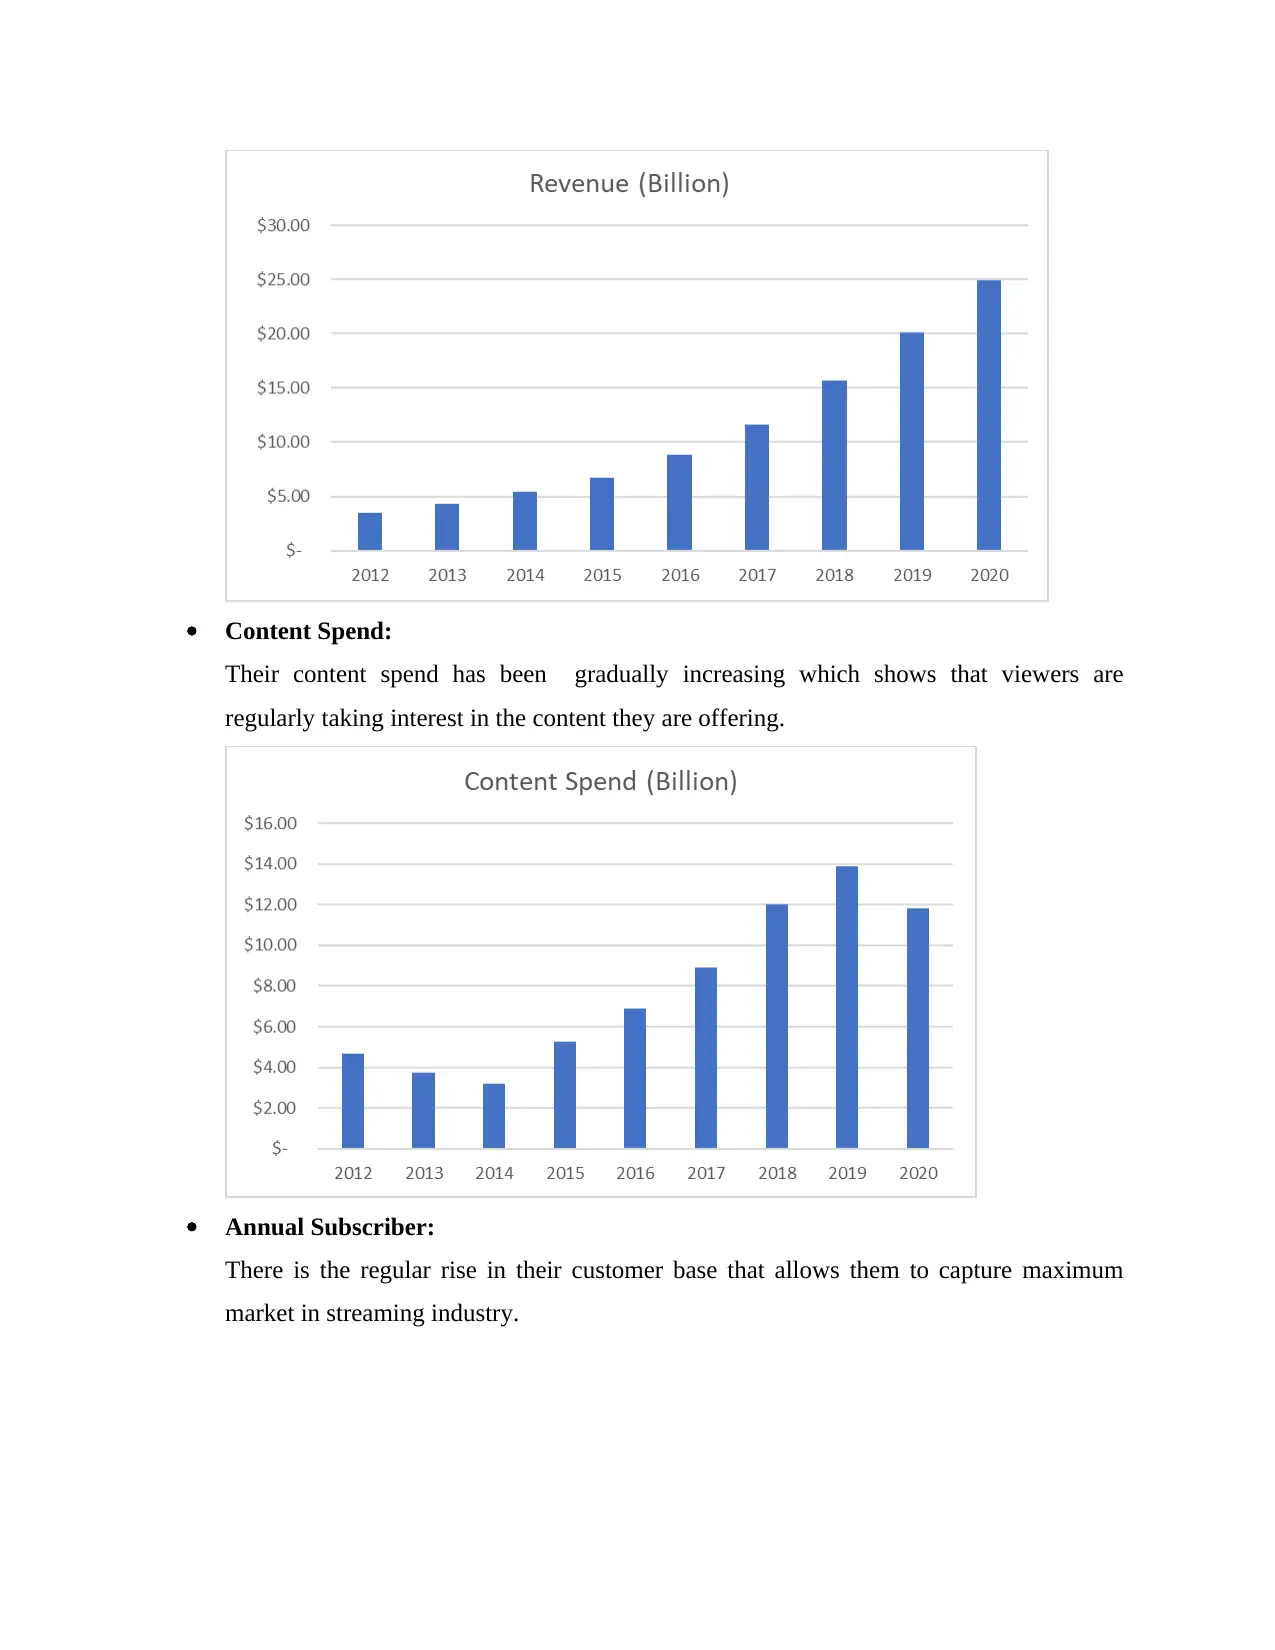
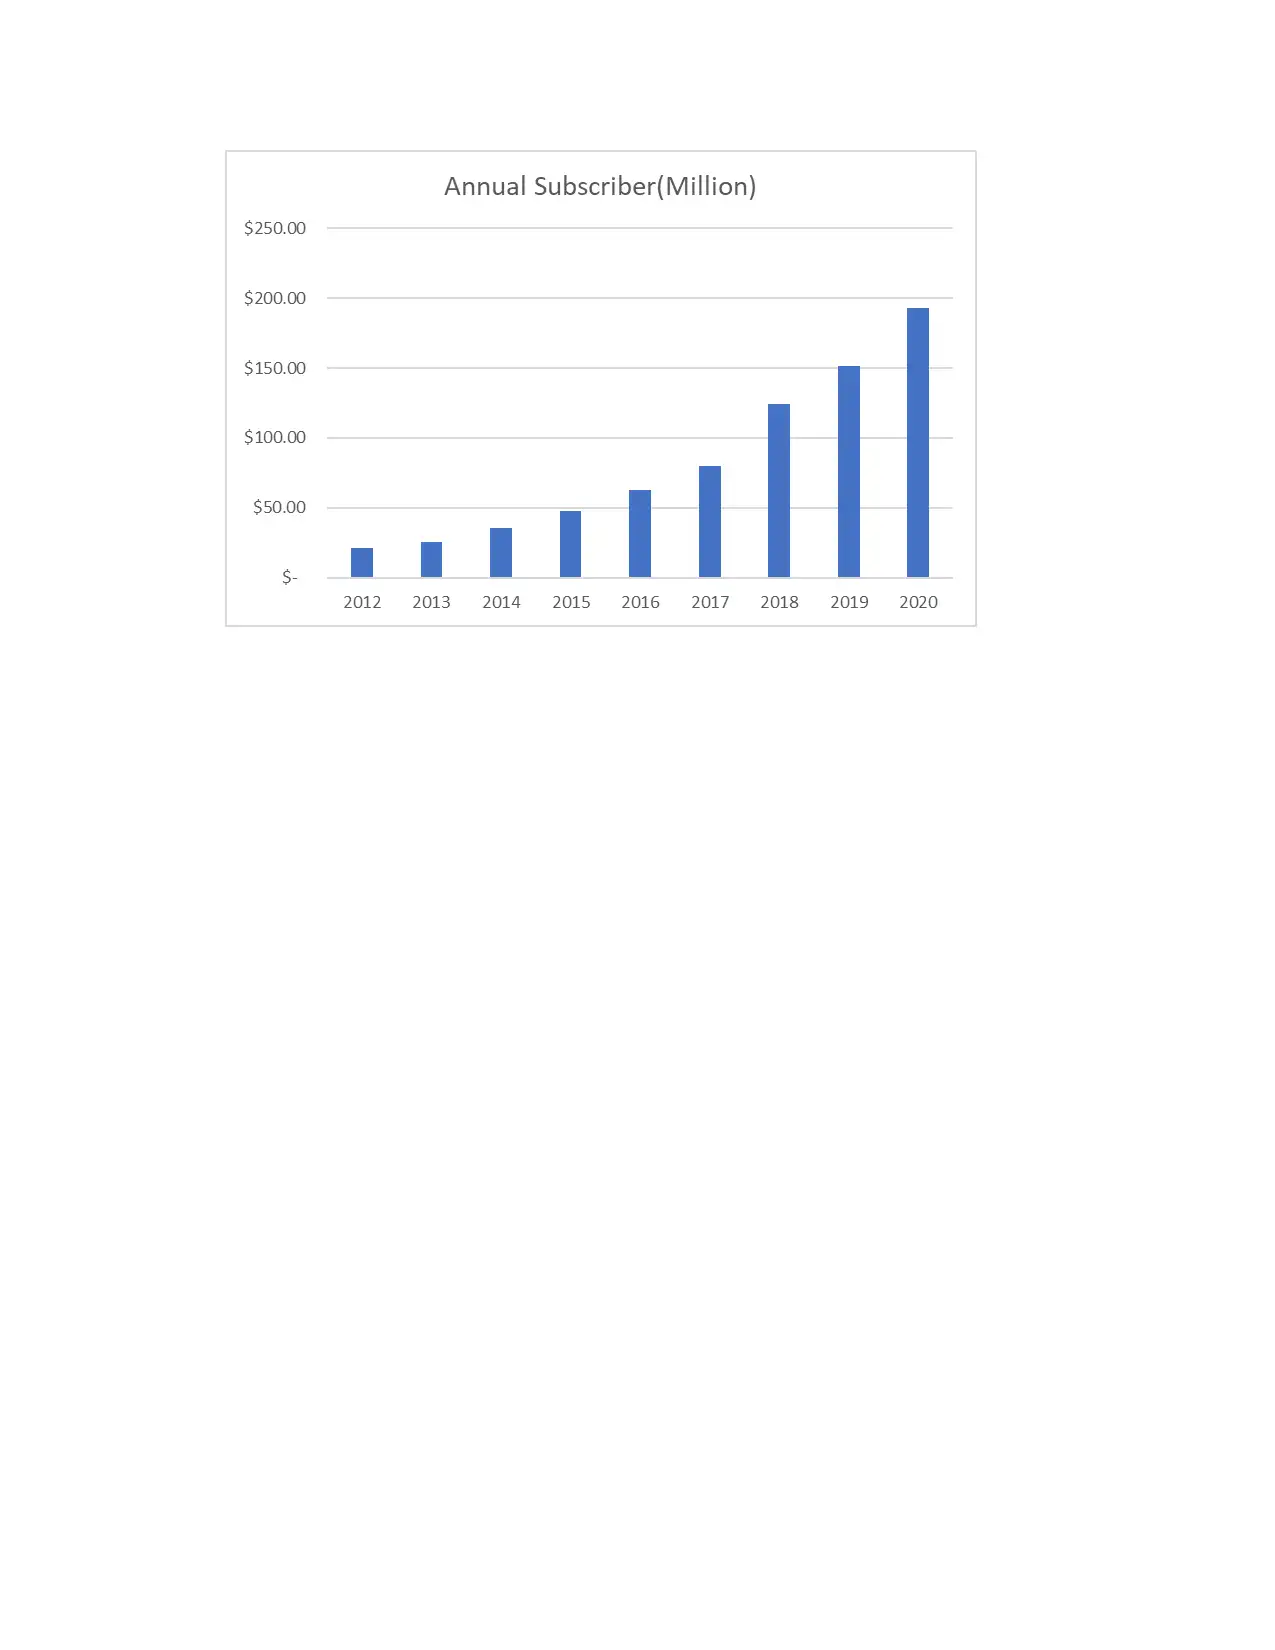
This report provides a statistical analysis of Netflix's performance between 2012 and 2020. Raw data on revenue, profits, content spending, and subscriber numbers was collected and analyzed using statistical techniques such as mean, median, and mode. Data manipulation techniques were applied to assess data accuracy. The findings are presented through charts, illustrating trends in profits, revenue, content spending, and subscriber growth. The analysis indicates improved profitability from 2017-2020, a consistent rise in revenue, increasing content spending reflecting viewer engagement, and a steady expansion of the subscriber base. The report concludes with an assessment of Netflix's market positioning based on the statistical findings.

DHICT BA30589E
Secure Best Marks with AI Grader
Need help grading? Try our AI Grader for instant feedback on your assignments.

Contents
MAIN BODY...................................................................................................................................3
1.Brief Description about the Research Subject:....................................................................3
2.Presentation of Raw Data:...................................................................................................3
3.Application of Statistical Technique of Raw Data:.............................................................4
4.Data Manipulation Technique:............................................................................................5
5.Representation on Information in Charts:...........................................................................7
REFERENCES..............................................................................................................................11

MAIN BODY
1.Brief Description about the Research Subject:
This report is based on the research topic relating to Netflix which is an American subscription
streaming service provider. It was launched in august 1997 and offers films and television series
library with the help of distribution deals and through its own productions popularly called as
Netflix Originals. This report contains the raw data of the Netflix obtained from the online
sources from the period starting from 2012 to 2020 which shows the profits they earned over
such period, their revenues, what is the content spend and the annual subscriber they hold in such
period. After collection of raw data certain statistical tools and data manipulation techniques
have been applied upon them so that performance can be judged along with interpretation. At the
end of the report graphical representation has been made on the above figures with their
respective headings so that performance measurement can be made in a proper way.
2.Presentation of Raw Data:
The information that is available from the online sources towards Netflix has been imported into
the excel and arranged in the systematic manner so that test can be applied on them. The raw
data majorly consist of sales volume, profit figures, content spend and their subscriber given
below: -
Netflix Information
Yea
r
Profits
(Million)
Revenue
(Billion) Content Spend (Billion) Annual Subscriber (Million)
2012 $ 50.00 $ 3.50 $ 4.65 $ 21.50
2013 $ 228.00 $ 4.30 $ 3.75 $ 25.70
2014 $ 403.00 $ 5.40 $ 3.19 $ 35.60
2015 $ 306.00 $ 6.70 $ 5.27 $ 47.90
2016 $ 379.00 $ 8.80 $ 6.88 $ 62.70
2017 $ 839.00 $ 11.60 $ 8.91 $ 79.90
2018 $ 894.00 $ 15.70 $ 12.00 $ 124.30
2019 $ 993.00 $ 20.10 $ 13.90 $ 151.50
2020 $ 997.00 $ 24.90 $ 11.80 $ 192.90

3.Application of Statistical Technique of Raw Data:
Statistical techniques are the tool under which data raw data has been analysed in the proper
sense so that proper judgement and interpretation can be made. Such interpretation has been used
to ensure the performance of the company during the period for which information has been
used. These techniques are used by many corporate to judge their performance considering the
market and their competitors.
Mean: It is considered as one of the measures of the central tendency. In order to
calculate the mean the entity the addition has to be made for the given set of data and
divide them with the sum of all the values. In this report Netflix information has been
used as the input to calculate the mean of profits and revenue they have earned over the
period staring from 2012 to 2020 which is arrived at $ 565.44 Million and $ 11.22 Billion
respectively. Not only this mean of the annual subscriber they hold during the above
period is $ 82.44 million which shows their strength in the changing world as they
become the market leader in the streaming industry around the world.
Median: Median is another statistical tool used to analyse the data or information for the
topic under consideration. It is represented by the mid value of the relevant group. It is
the centre point at which 50 % of the information is more and remaining information is
less. In order to calculate the median, it is important to arrange the data set in ascending
order and then the middle value will be represented as median. The median calculated for
the Netflix arrives as $403, $ 8.80, $6.88 and $ 62.70 respectively which shows the
middle value in case of the revenue, profits, content spend and subscriber they hold
between 2012 to 2020.
Mode: It is another set of the central tendency which is used to determine the value for
the given set of data. Mode simply shows the value that has been repeated number of
times in the data set of Netflix and the mode arrived is N/A which shows that none of the
figures has been repeated whether it is revenue, profits, content spend and annual
subscriber and it is practical too that repetition of such figures exactly is not possible
between 2012 to 2020.
Year
Profits
(Million)
Revenue
(Billion)
Content Spend
(Billion)
Annual Subscriber
(Million)
2012 $ $ $ $
Secure Best Marks with AI Grader
Need help grading? Try our AI Grader for instant feedback on your assignments.

50.00 3.50 4.65 21.50
2013
$
228.00
$
4.30
$
3.75
$
25.70
2014
$
403.00
$
5.40
$
3.19
$
35.60
2015
$
306.00
$
6.70
$
5.27
$
47.90
2016
$
379.00
$
8.80
$
6.88
$
62.70
2017
$
839.00
$
11.60
$
8.91
$
79.90
2018
$
894.00
$
15.70
$
12.00
$
124.30
2019
$
993.00
$
20.10
$
13.90
$
151.50
2020
$
997.00
$
24.90
$
11.80
$
192.90
Statistical Techniques: -
Mean
$
565.44
$
11.22
$
7.82
$
82.44
Media
n
$
403.00
$
8.80
$
6.88
$
62.70
Mode #N/A #N/A #N/A #N/A
The Screen shot of the formula that has been used to carry out the statistical techniques has been
mentioned under: -
4.Data Manipulation Technique:
The data manipulation techniques is the statistical tools to judge the data accuracy on different
parameters such as calculation of sum of the information, the maximum and minimum value
contain in the data, count and average function so that interpretation will become easier at the
time of preparation of the final report. In this report the following data is used relating to Netflix
and manipulation techniques has been applied on them to check the accuracy of their

performance. The sum function which is used below sums the given set of data accordingly. The
average function simply averages the data to the single value and count function is used to count
the values arrives in the information. The maximum and minimum function are helpful in
analysing the highest and lowest value in the given table or information. The formula that has
been used to calculate such figures has been mentioned below in the form of an screenshot.
Netflix Information
Year
Profits
(Million)
Revenue
(Billion)
Content Spend
(Billion)
Annual Subscriber
(Million)
2012
$
50.00
$
3.50
$
4.65
$
21.50
2013
$
228.00
$
4.30
$
3.75
$
25.70
2014
$
403.00
$
5.40
$
3.19
$
35.60
2015
$
306.00
$
6.70
$
5.27
$
47.90
2016
$
379.00
$
8.80
$
6.88
$
62.70
2017
$
839.00
$
11.60
$
8.91
$
79.90
2018
$
894.00
$
15.70
$
12.00
$
124.30
2019
$
993.00
$
20.10
$
13.90
$
151.50
2020
$
997.00
$
24.90
$
11.80
$
192.90
Data Manipulation: -
Minimum
$
50.00
$
3.50
$
3.19
$
21.50
Maximu
m
$
997.00
$
24.90
$
13.90
$
192.90
Sum
$
5,089.00
$
101.00
$
70.35
$
742.00
Average
$
565.44
$
11.22
$
7.82
$
82.44
Count 9 9 9 9
The screenshot of the formulae that have been used to carry out the above calculation has been
depicted below: -

5.Representation on Information in Charts:
The following is the graphical information of the raw data that has been collected regarding the
Netflix and such charts shows their performance over such period on category wise in those
years respectively: -
Profits:
On analysing the chart the conclusion can be made that their performance in terms of the
profits has been improved during the year 2017 to 2020.
Revenue:
The revenues they are generating is having the increasing trend in the graphs below
shows that Netflix has been effectively utilising their funds and resources in the right
direction that helps in boosting their sales figures.
Paraphrase This Document
Need a fresh take? Get an instant paraphrase of this document with our AI Paraphraser

Content Spend:
Their content spend has been gradually increasing which shows that viewers are
regularly taking interest in the content they are offering.
Annual Subscriber:
There is the regular rise in their customer base that allows them to capture maximum
market in streaming industry.
Their content spend has been gradually increasing which shows that viewers are
regularly taking interest in the content they are offering.
Annual Subscriber:
There is the regular rise in their customer base that allows them to capture maximum
market in streaming industry.


CONCLUTION
In this report the Netflix information has been used to carry out the research on their
performance from the period staring from 2012 to 2020. The data or information that has been
collected to carry out the statistical test are their revenues, profits they earned, content spend and
the number of subscribers they are holding during such period. After gathering the raw data from
the online sources, statistical techniques such as mean median and mode has been applied on
such information and after that data manipulation and graphical representation has been made in
the report so that current judgement has been made towards their current performance and
positioning in the market. This report also contain proficiency towards researching the particular
topic and then sorting their raw data so that various statistical techniques has been applied on
them.
Secure Best Marks with AI Grader
Need help grading? Try our AI Grader for instant feedback on your assignments.

REFERENCES
Books and Journals
Castañeda-Miranda, A. and Castaño-Meneses, V.M., 2020. Internet of things for smart farming
and frost intelligent control in greenhouses. Computers and Electronics in
Agriculture, 176, p.105614.
Cohen, A.C. and Whitten, B.J., 2020. Parameter estimation in reliability and life span models.
CRC Press.
Dzuranin, A.C., Jones, J.R. and Olvera, R.M., 2018. Infusing data analytics into the accounting
curriculum: A framework and insights from faculty. Journal of Accounting
Education, 43, pp.24-39.
Eissa, M.S. and Abou Al Alamein, A.M., 2018. Innovative spectrophotometric methods for
simultaneous estimation of the novel two-drug combination: sacubitril/valsartan through
two manipulation approaches and a comparative statistical study. Spectrochimica Acta
Part A: Molecular and Biomolecular Spectroscopy, 193, pp.365-374.
Eseye, A.T., Zhang, J. and Zheng, D., 2018. Short-term photovoltaic solar power forecasting
using a hybrid Wavelet-PSO-SVM model based on SCADA and Meteorological
information. Renewable energy, 118, pp.357-367.
Jahangir, H., Golkar, M.A., and Elkamel, A., 2020. Short-term wind speed forecasting
framework based on stacked denoising auto-encoders with rough ANN. Sustainable
Energy Technologies and Assessments, 38, p.100601.
Potvin, C., 2020. ANOVA: experiments in controlled environments. In Design and analysis of
ecological experiments (pp. 46-68). Chapman and Hall/CRC.
Van de Vijver, F.J. and Leung, K., 2021. Methods and data analysis for cross-cultural
research (Vol. 116). Cambridge University Press.
1 out of 11
Related Documents

Your All-in-One AI-Powered Toolkit for Academic Success.
+13062052269
info@desklib.com
Available 24*7 on WhatsApp / Email
Unlock your academic potential
© 2024 | Zucol Services PVT LTD | All rights reserved.