Data Analysis of Netflix Sales Revenue (2011-2020) Using MS Excel
VerifiedAdded on 2023/06/10
|7
|1235
|239
Practical Assignment
AI Summary
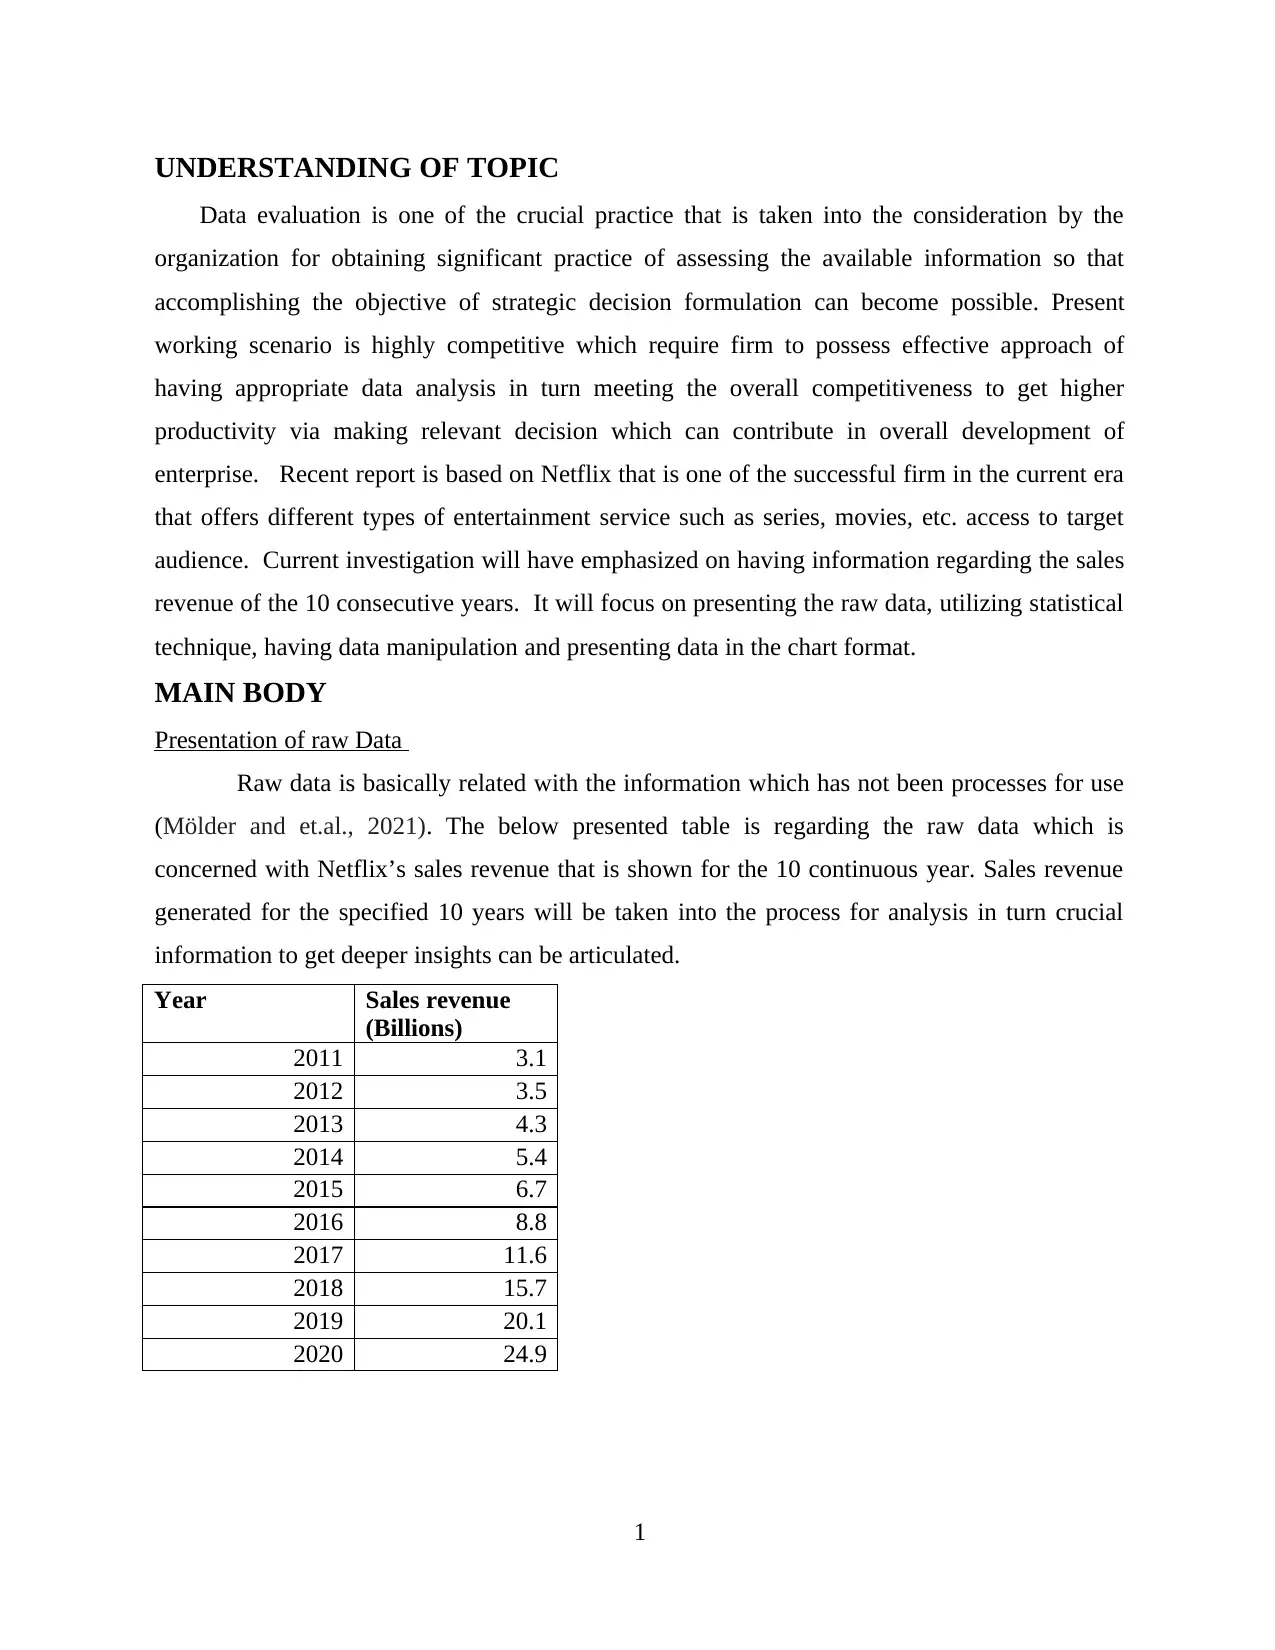
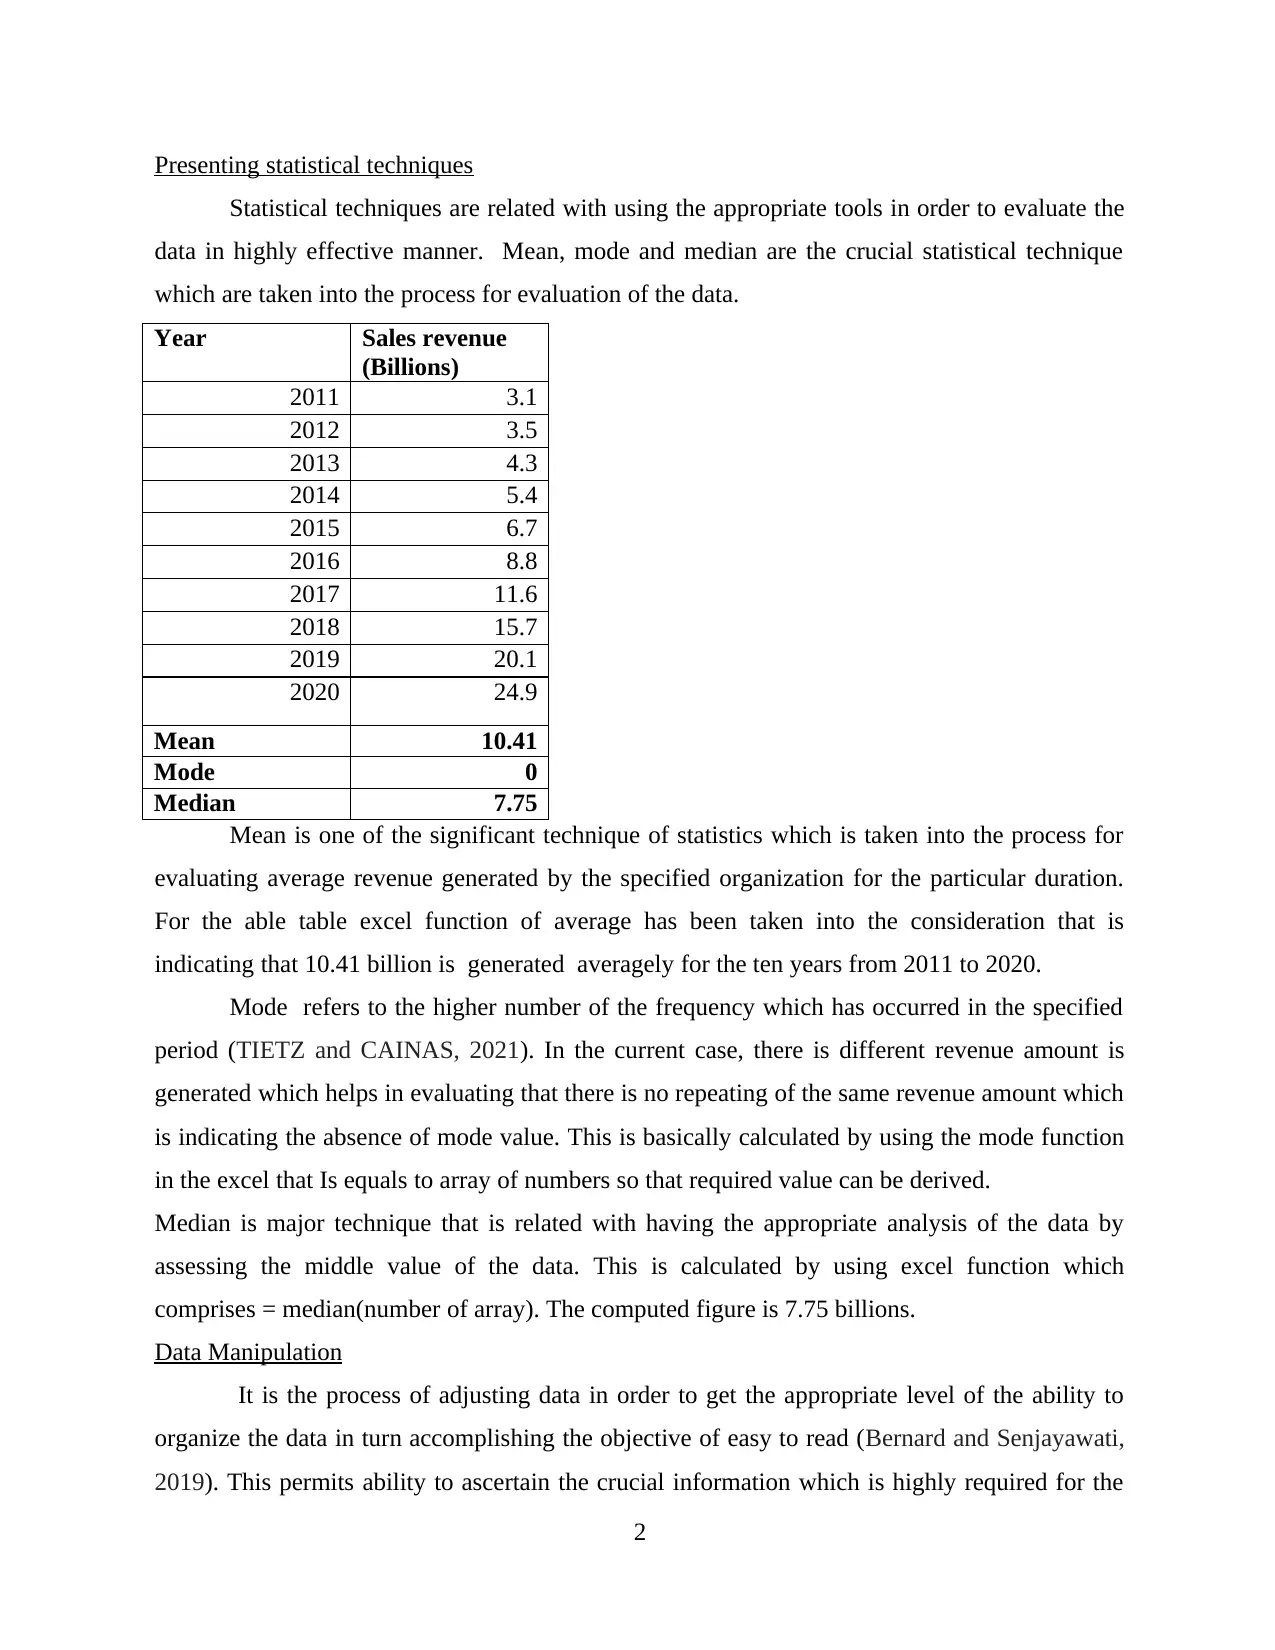
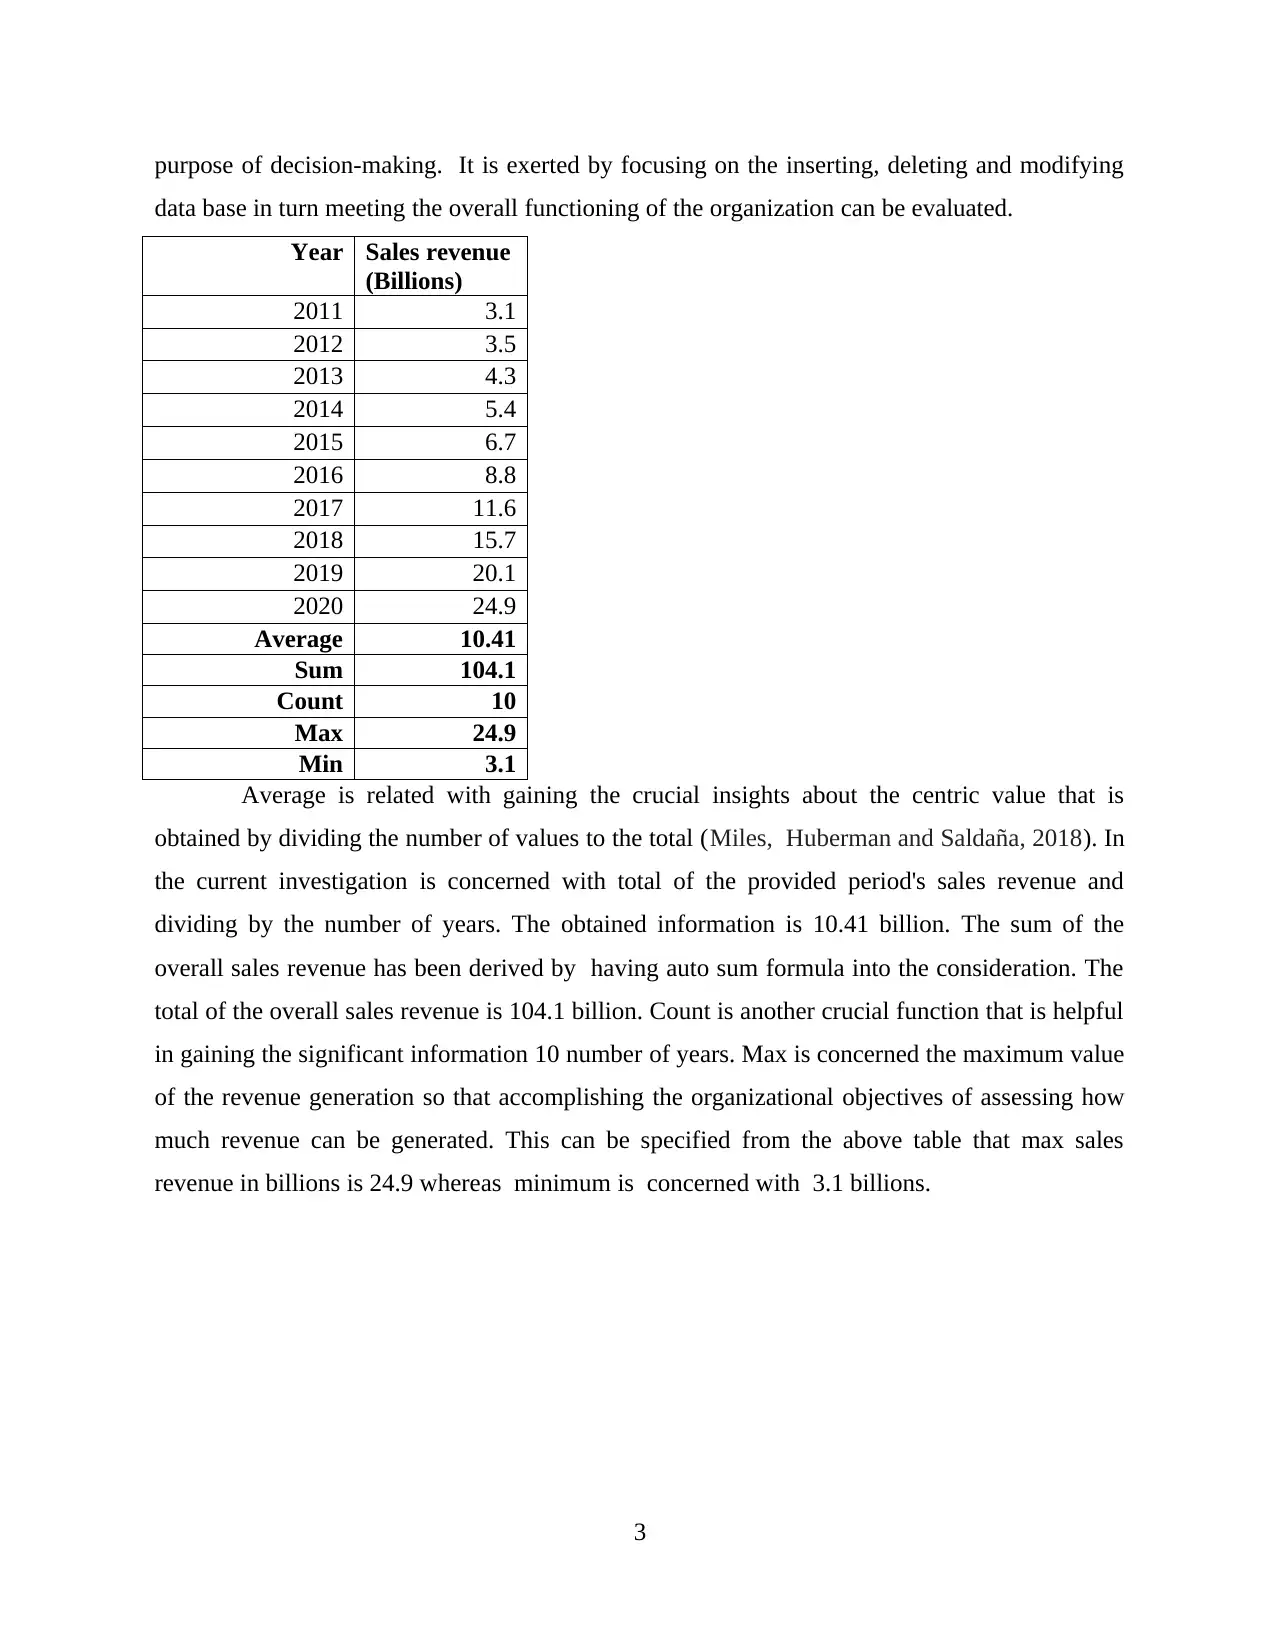
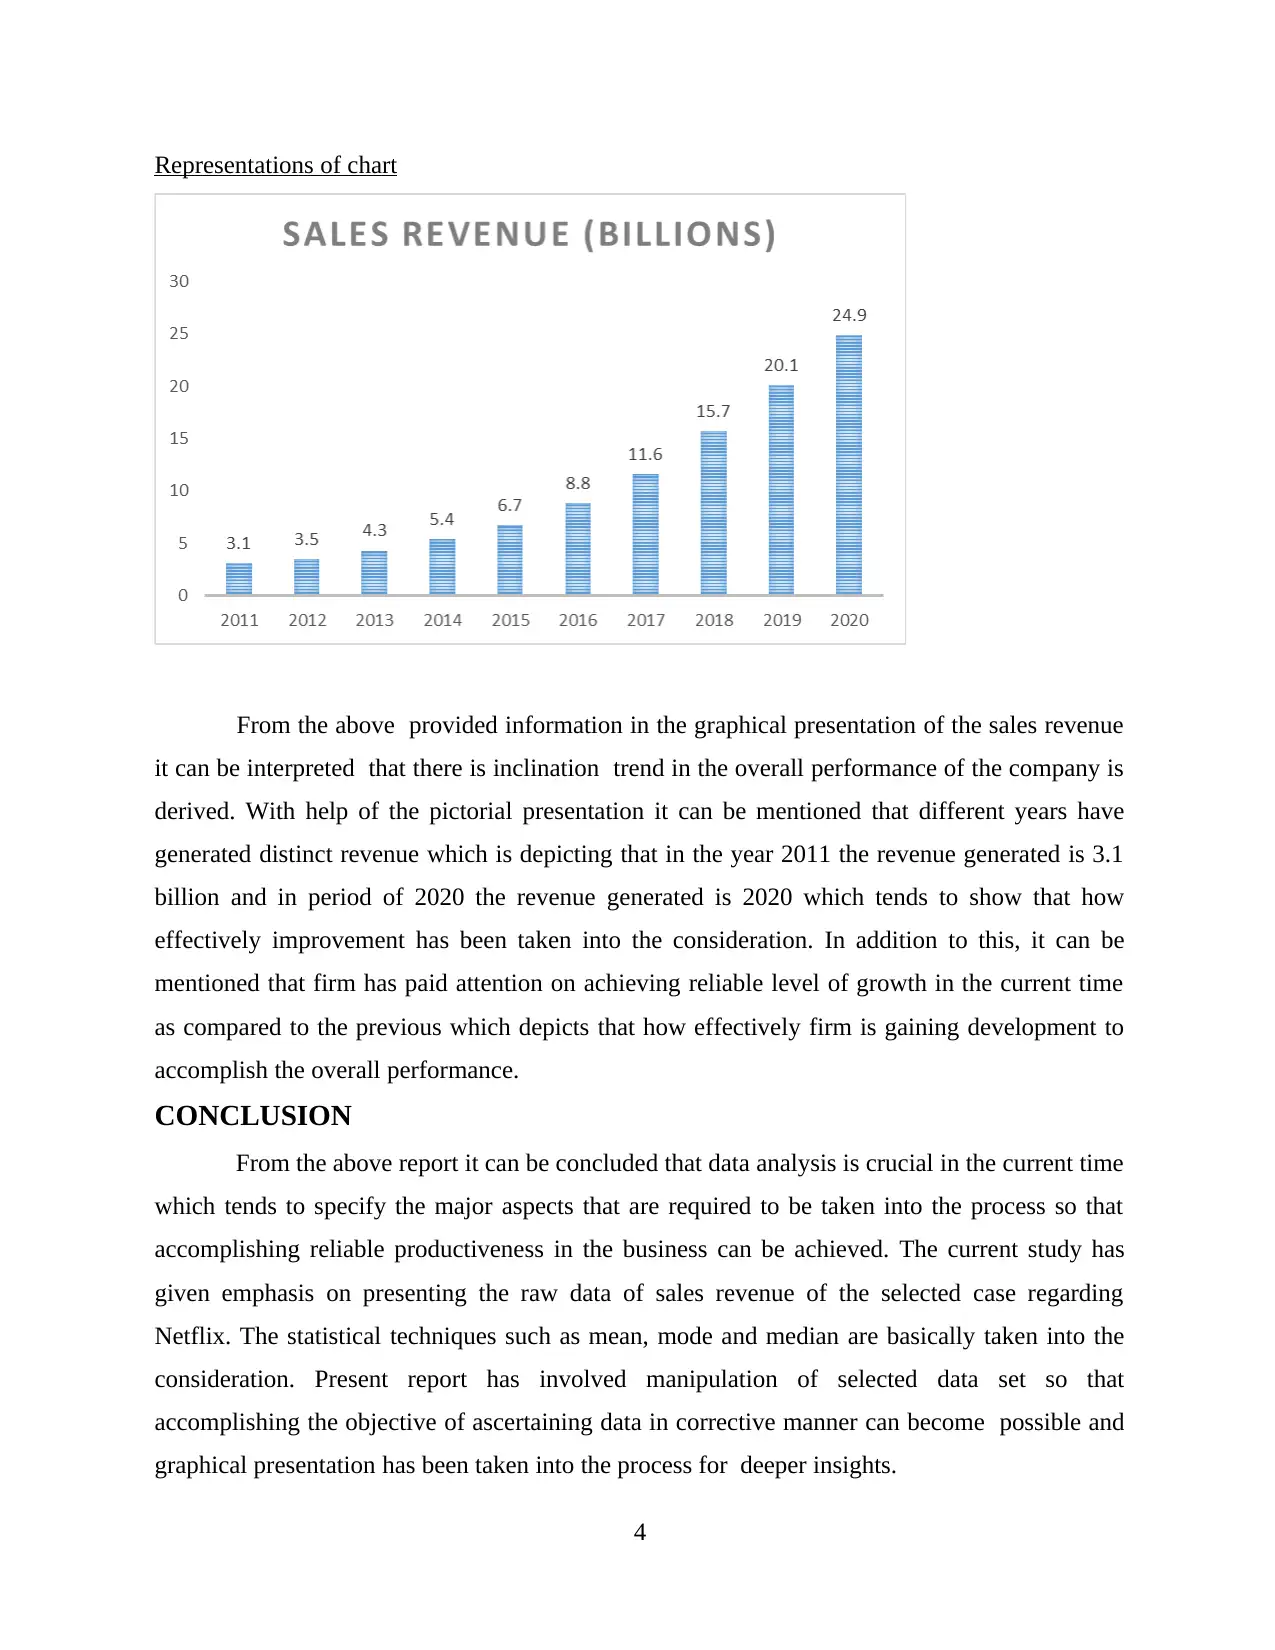
This assignment delves into the analysis of Netflix's sales data from 2011 to 2020 using MS Excel. It begins with an understanding of data evaluation and its significance in strategic decision-making. The assignment presents raw sales revenue data, followed by the application of statistical techniques such as mean, mode, and median to derive meaningful insights. Data manipulation techniques, including calculations of average, sum, count, maximum, and minimum values, are then employed to further refine the data. Finally, the assignment emphasizes the representation of data through charts to visualize trends and patterns in Netflix's revenue growth over the specified period. The conclusion highlights the importance of data analysis in business and summarizes the key aspects covered in the report.
1 out of 7
Related Documents


Your All-in-One AI-Powered Toolkit for Academic Success.
+13062052269
info@desklib.com
Available 24*7 on WhatsApp / Email
![[object Object]](/_next/static/media/star-bottom.7253800d.svg)
Copyright © 2020–2026 A2Z Services. All Rights Reserved. Developed and managed by ZUCOL.