Comprehensive Strategic Management Report on Netflix Inc.
VerifiedAdded on 2023/06/01
|52
|6291
|100
Report
AI Summary
This strategic management report provides an overview of Netflix, including its history, current issues, geographical locations, and future challenges. It presents a financial analysis covering the period from 2015 to 2018, including revenue, profitability ratios, efficiency ratios, liquidity ratios, and investor ratios such as EPS. The report also includes a segment analysis, competitor analysis, and a marketing analysis of Netflix's business strategies. Furthermore, the report touches on Human Resource Management and Corporate Governance aspects of Netflix.
Running head: STRATEGIC MANAGEMENT REPORT ON NETFIX
Strategic Management Report on Netflix
Name of the Student:
Name of the University:
Author Note:
Strategic Management Report on Netflix
Name of the Student:
Name of the University:
Author Note:
Paraphrase This Document
Need a fresh take? Get an instant paraphrase of this document with our AI Paraphraser

STRATEGIC MANAGEMENT REPORT ON NETFLIX 1
Table of Contents
Introduction......................................................................................................................................1
Current Issues..............................................................................................................................1
Geographical location and SBU’s...............................................................................................1
Future Challenges........................................................................................................................1
Income........................................................................................Error! Bookmark not defined.
Ratios...............................................................................................................................................1
Profitability Ratio........................................................................................................................1
Return on Capital Employed...................................................................................................1
Net Profit Margin.....................................................................................................................1
Gross profit Margin.................................................................................................................1
Efficiency Ratio...........................................................................................................................1
Debtors.....................................................................................................................................1
Creditors..................................................................................................................................1
Liquidity Ratio.............................................................................................................................1
Current Ratio...........................................................................................................................1
Quick Ratio..............................................................................................................................1
Cash Analysis..............................................................................................................................1
Financial Ratio.............................................................................................................................1
Gearing Ratio...........................................................................................................................1
STRATEGIC MANAGEMENT REPORT ON NETFLIX 2
Interest Coverage Ratio...........................................................................................................1
Investors Ratio.............................................................................................................................1
EPS Ratio.................................................................................................................................1
Market Share................................................................................................................................1
Conclusion:....................................................................................Error! Bookmark not defined.
Key Performance Indicator..............................................................................................................1
Segment Analysis (Q1-Q3)..............................................................................................................1
Segmentation Analysis....................................................................................................................1
Global OTT and Pay Revenue.....................................................................................................1
Competitor Analysis........................................................................................................................1
A) General..............................................................................................................................1
Online TV & Movie Piracy Losses to Soar to $52 billion..............................................................1
B) Specific Competitors.........................................................................................................1
Marketing.....................................................................................................................................1
Product.........................................................................................................................................1
Price.............................................................................................................................................1
Place.............................................................................................................................................1
Promotion....................................................................................................................................1
People.........................................................................................Error! Bookmark not defined.
Human Resource Management Analysis.........................................................................................1
⊘ This is a preview!⊘
Do you want full access?
Subscribe today to unlock all pages.
Trusted by 1+ million students worldwide
STRATEGIC MANAGEMENT REPORT ON NETFLIX 3
Corporate Governance.................................................................................................................1
Operations........................................................................................................................................1
References:......................................................................................................................................1
Appendix:........................................................................................................................................1
Appendix 1 Financial Statement..................................................................................................1
Appendix 2: Ratios......................................................................................................................1
Appendix 4: Market Share.......................................................................................................1
Appendix5: Organization Culture and Values.............................................................................1
Appendix 6: Employees...............................................................................................................1
Appendix 7: Market Analysis......................................................................................................1
Appendix:....................................................................................................................................1
Paraphrase This Document
Need a fresh take? Get an instant paraphrase of this document with our AI Paraphraser
STRATEGIC MANAGEMENT REPORT ON NETFLIX 4
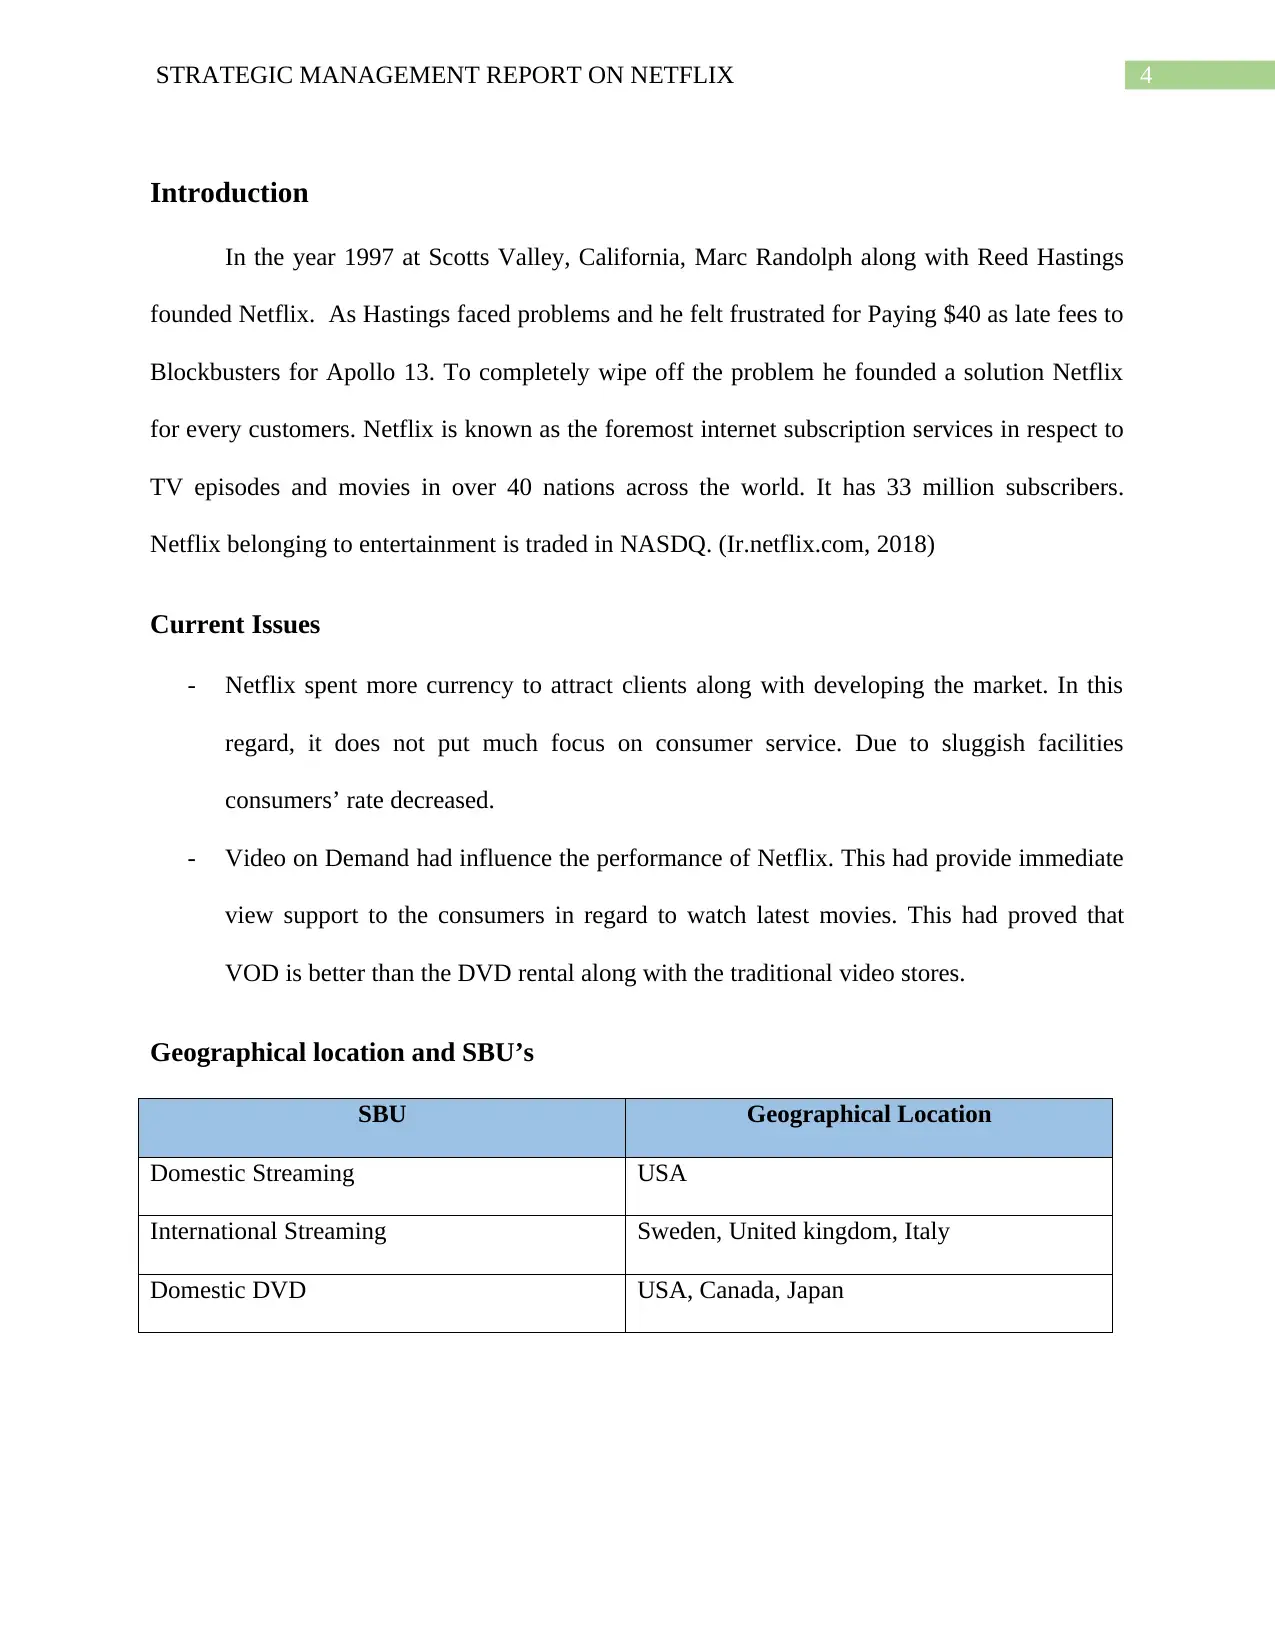
Introduction
In the year 1997 at Scotts Valley, California, Marc Randolph along with Reed Hastings
founded Netflix. As Hastings faced problems and he felt frustrated for Paying $40 as late fees to
Blockbusters for Apollo 13. To completely wipe off the problem he founded a solution Netflix
for every customers. Netflix is known as the foremost internet subscription services in respect to
TV episodes and movies in over 40 nations across the world. It has 33 million subscribers.
Netflix belonging to entertainment is traded in NASDQ. (Ir.netflix.com, 2018)
Current Issues
- Netflix spent more currency to attract clients along with developing the market. In this
regard, it does not put much focus on consumer service. Due to sluggish facilities
consumers’ rate decreased.
- Video on Demand had influence the performance of Netflix. This had provide immediate
view support to the consumers in regard to watch latest movies. This had proved that
VOD is better than the DVD rental along with the traditional video stores.
Geographical location and SBU’s
SBU Geographical Location
Domestic Streaming USA
International Streaming Sweden, United kingdom, Italy
Domestic DVD USA, Canada, Japan
STRATEGIC MANAGEMENT REPORT ON NETFLIX 5
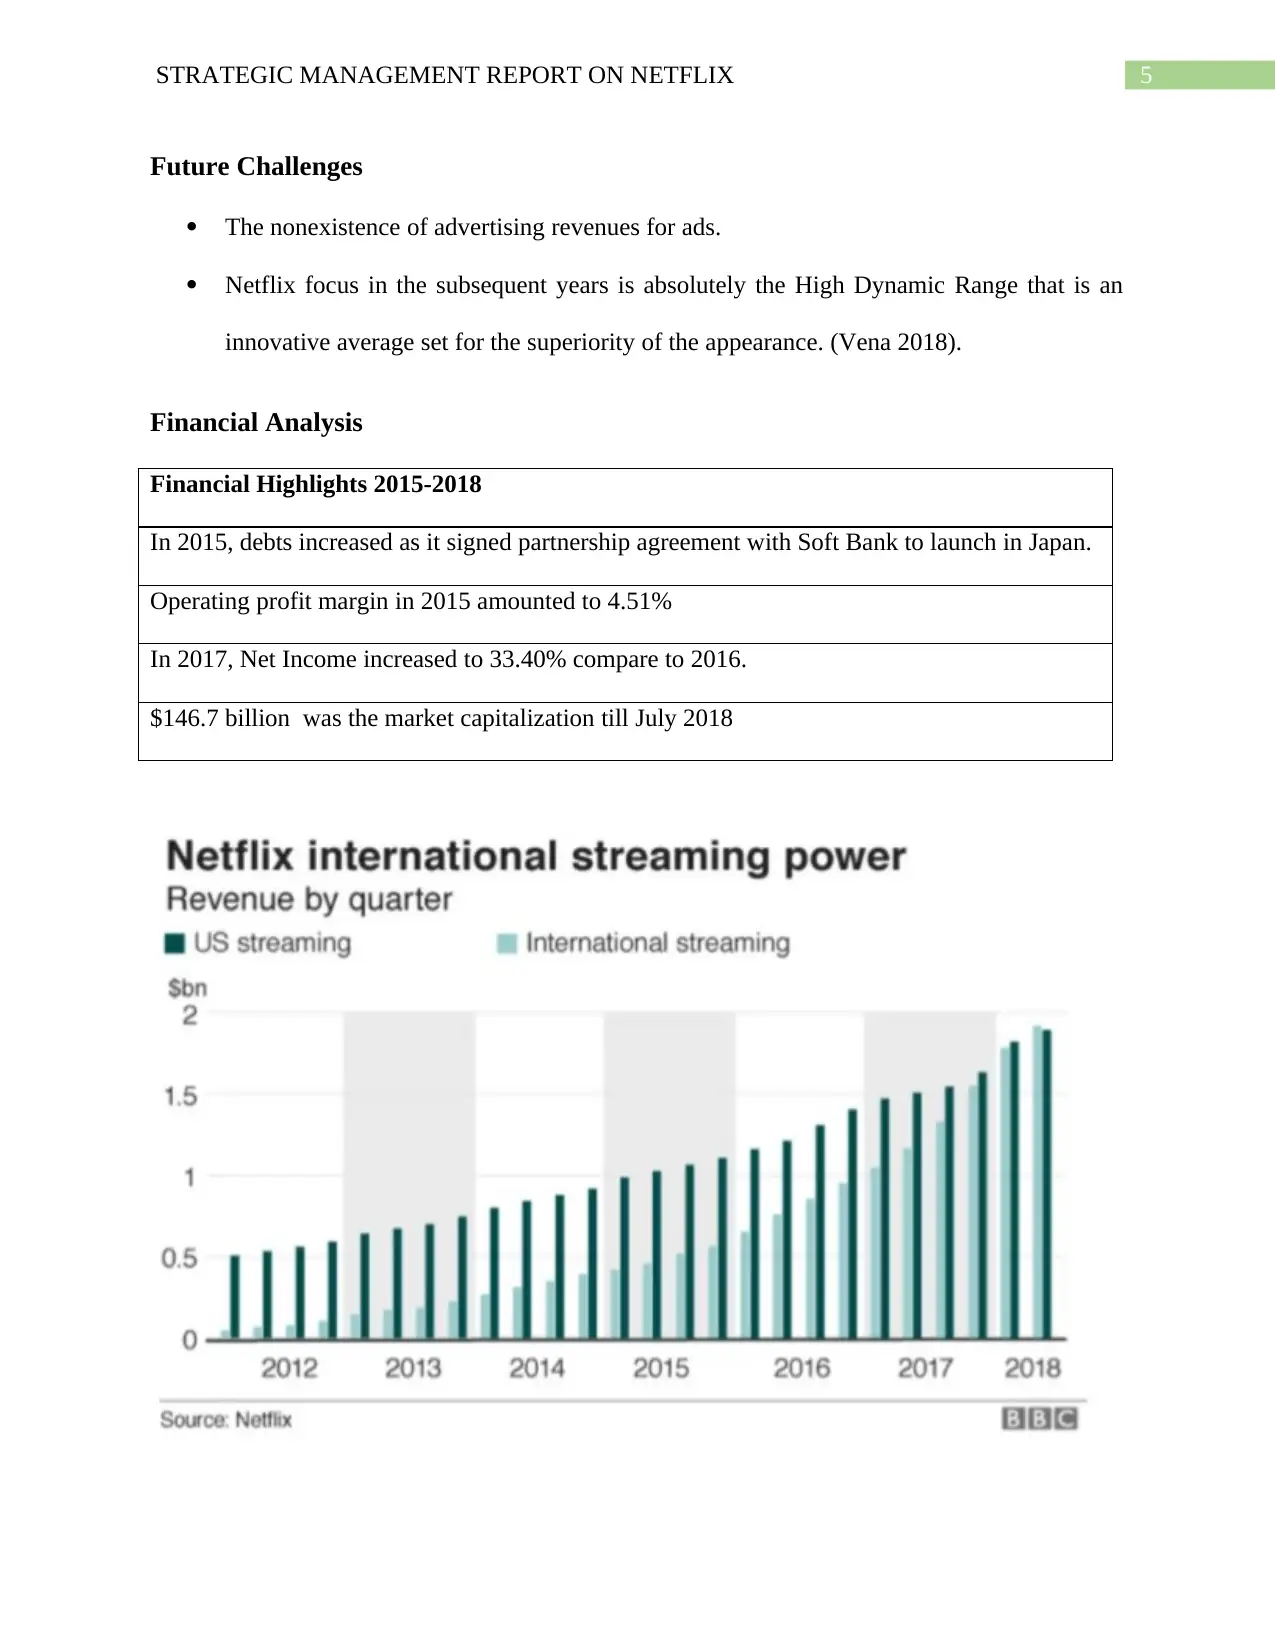
Future Challenges
The nonexistence of advertising revenues for ads.
Netflix focus in the subsequent years is absolutely the High Dynamic Range that is an
innovative average set for the superiority of the appearance. (Vena 2018).
Financial Analysis
Financial Highlights 2015-2018
In 2015, debts increased as it signed partnership agreement with Soft Bank to launch in Japan.
Operating profit margin in 2015 amounted to 4.51%
In 2017, Net Income increased to 33.40% compare to 2016.
$146.7 billion was the market capitalization till July 2018
⊘ This is a preview!⊘
Do you want full access?
Subscribe today to unlock all pages.
Trusted by 1+ million students worldwide
STRATEGIC MANAGEMENT REPORT ON NETFLIX 6
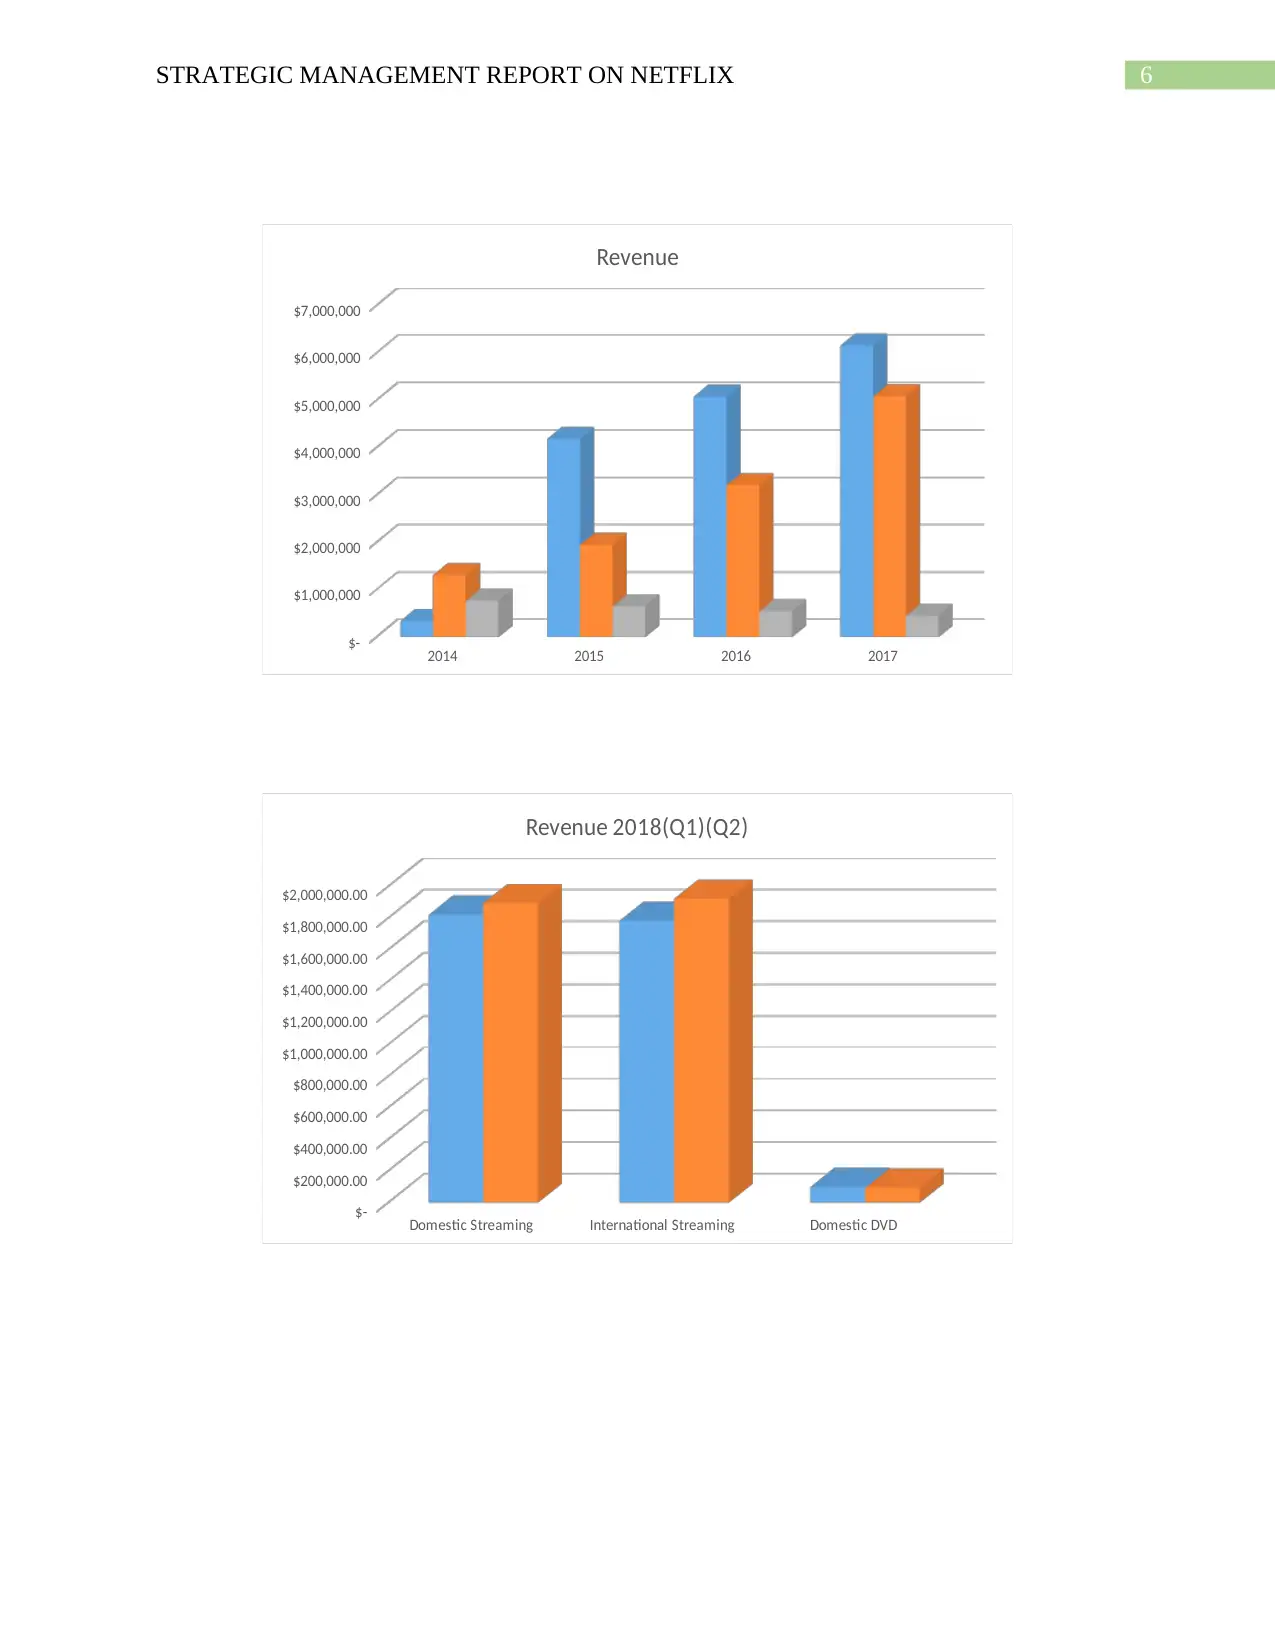
2014 2015 2016 2017
$-
$1,000,000
$2,000,000
$3,000,000
$4,000,000
$5,000,000
$6,000,000
$7,000,000
Revenue
Domestic Streaming International Streaming Domestic DVD
$-
$200,000.00
$400,000.00
$600,000.00
$800,000.00
$1,000,000.00
$1,200,000.00
$1,400,000.00
$1,600,000.00
$1,800,000.00
$2,000,000.00
Revenue 2018(Q1)(Q2)
Paraphrase This Document
Need a fresh take? Get an instant paraphrase of this document with our AI Paraphraser
STRATEGIC MANAGEMENT REPORT ON NETFLIX 7
Automotive Automotive Leasing Energy Generation and
Storage
Service and other
$0
$500,000
$1,000,000
$1,500,000
$2,000,000
$2,500,000
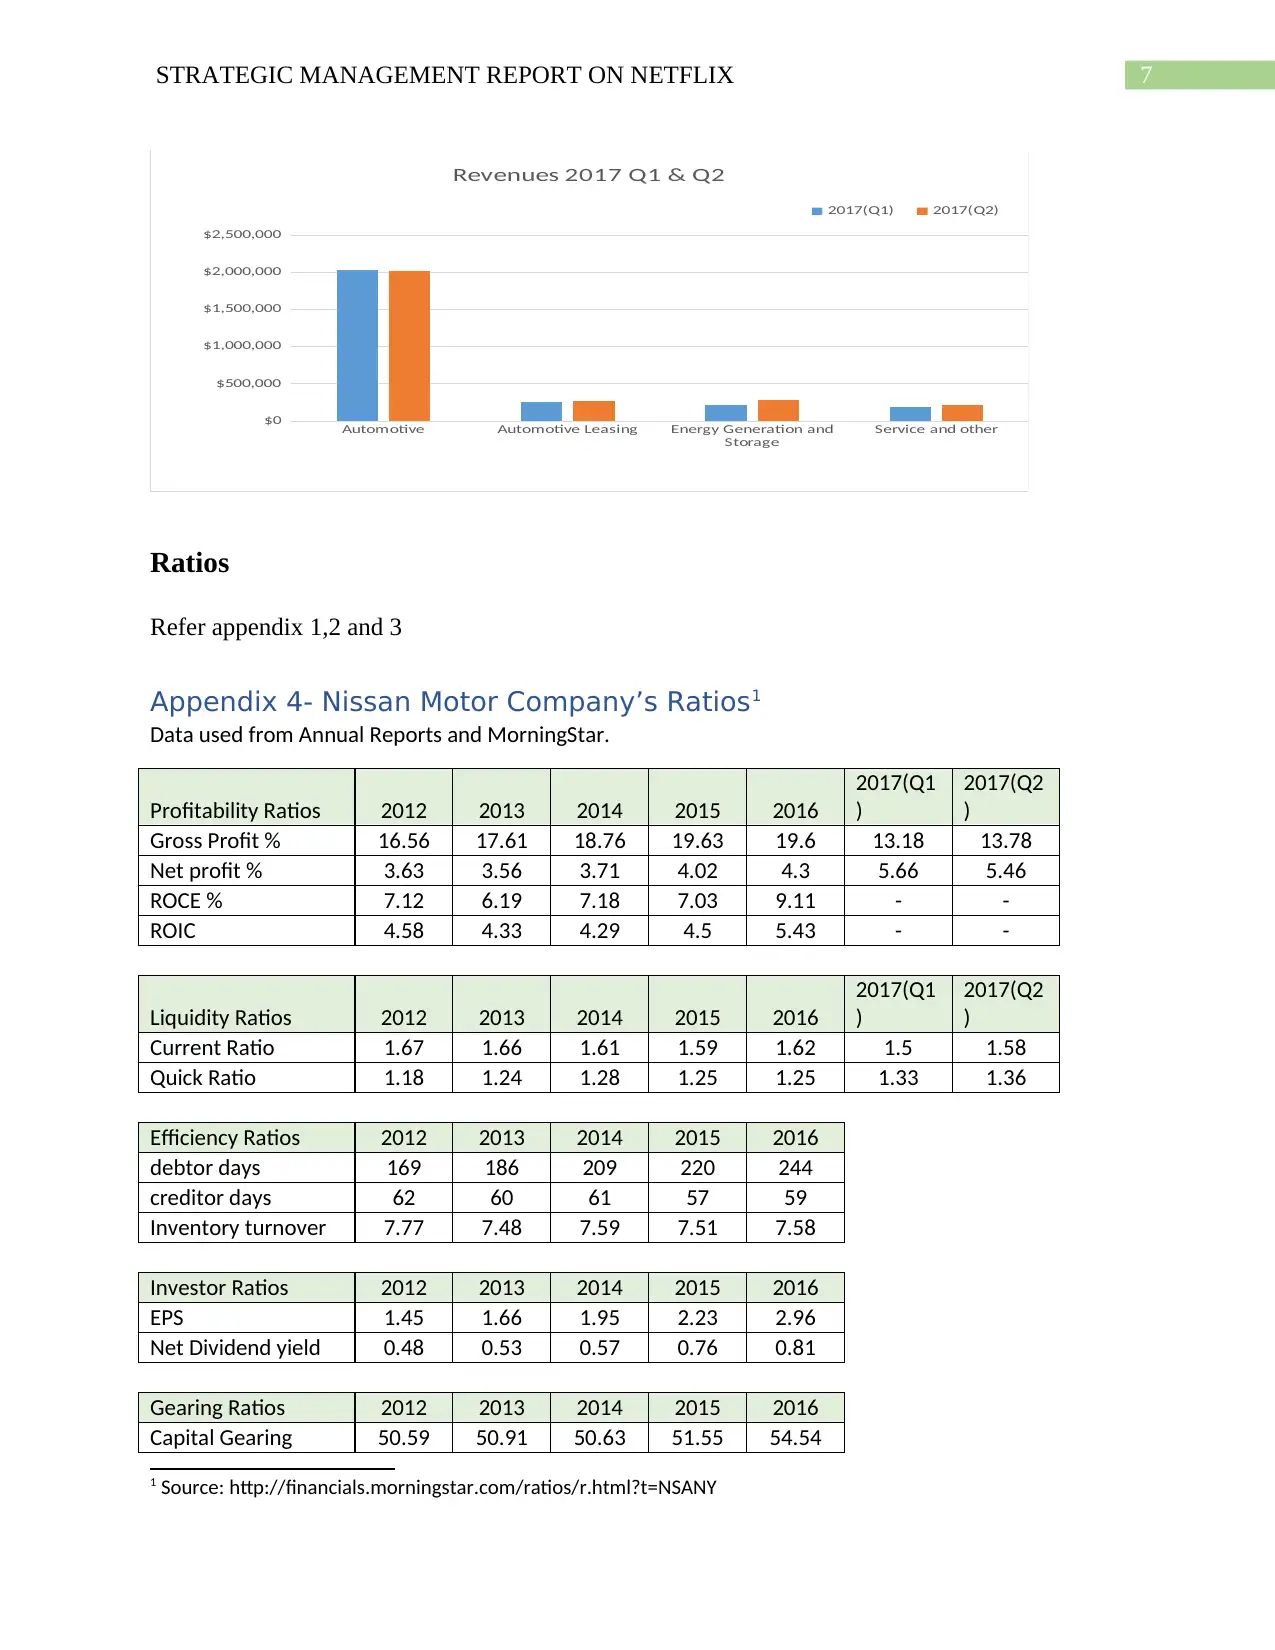
Revenues 2017 Q1 & Q2
2017(Q1) 2017(Q2)
Ratios
Refer appendix 1,2 and 3
Appendix 4- Nissan Motor Company’s Ratios1
Data used from Annual Reports and MorningStar.
Profitability Ratios 2012 2013 2014 2015 2016
2017(Q1
)
2017(Q2
)
Gross Profit % 16.56 17.61 18.76 19.63 19.6 13.18 13.78
Net profit % 3.63 3.56 3.71 4.02 4.3 5.66 5.46
ROCE % 7.12 6.19 7.18 7.03 9.11 - -
ROIC 4.58 4.33 4.29 4.5 5.43 - -
Liquidity Ratios 2012 2013 2014 2015 2016
2017(Q1
)
2017(Q2
)
Current Ratio 1.67 1.66 1.61 1.59 1.62 1.5 1.58
Quick Ratio 1.18 1.24 1.28 1.25 1.25 1.33 1.36
Efficiency Ratios 2012 2013 2014 2015 2016
debtor days 169 186 209 220 244
creditor days 62 60 61 57 59
Inventory turnover 7.77 7.48 7.59 7.51 7.58
Investor Ratios 2012 2013 2014 2015 2016
EPS 1.45 1.66 1.95 2.23 2.96
Net Dividend yield 0.48 0.53 0.57 0.76 0.81
Gearing Ratios 2012 2013 2014 2015 2016
Capital Gearing 50.59 50.91 50.63 51.55 54.54
1 Source: http://financials.morningstar.com/ratios/r.html?t=NSANY
Automotive Automotive Leasing Energy Generation and
Storage
Service and other
$0
$500,000
$1,000,000
$1,500,000
$2,000,000
$2,500,000
Revenues 2017 Q1 & Q2
2017(Q1) 2017(Q2)
Ratios
Refer appendix 1,2 and 3
Appendix 4- Nissan Motor Company’s Ratios1
Data used from Annual Reports and MorningStar.
Profitability Ratios 2012 2013 2014 2015 2016
2017(Q1
)
2017(Q2
)
Gross Profit % 16.56 17.61 18.76 19.63 19.6 13.18 13.78
Net profit % 3.63 3.56 3.71 4.02 4.3 5.66 5.46
ROCE % 7.12 6.19 7.18 7.03 9.11 - -
ROIC 4.58 4.33 4.29 4.5 5.43 - -
Liquidity Ratios 2012 2013 2014 2015 2016
2017(Q1
)
2017(Q2
)
Current Ratio 1.67 1.66 1.61 1.59 1.62 1.5 1.58
Quick Ratio 1.18 1.24 1.28 1.25 1.25 1.33 1.36
Efficiency Ratios 2012 2013 2014 2015 2016
debtor days 169 186 209 220 244
creditor days 62 60 61 57 59
Inventory turnover 7.77 7.48 7.59 7.51 7.58
Investor Ratios 2012 2013 2014 2015 2016
EPS 1.45 1.66 1.95 2.23 2.96
Net Dividend yield 0.48 0.53 0.57 0.76 0.81
Gearing Ratios 2012 2013 2014 2015 2016
Capital Gearing 50.59 50.91 50.63 51.55 54.54
1 Source: http://financials.morningstar.com/ratios/r.html?t=NSANY
STRATEGIC MANAGEMENT REPORT ON NETFLIX 8
Interest Coverage 0.82 0.83 0.79 0.79 0.95
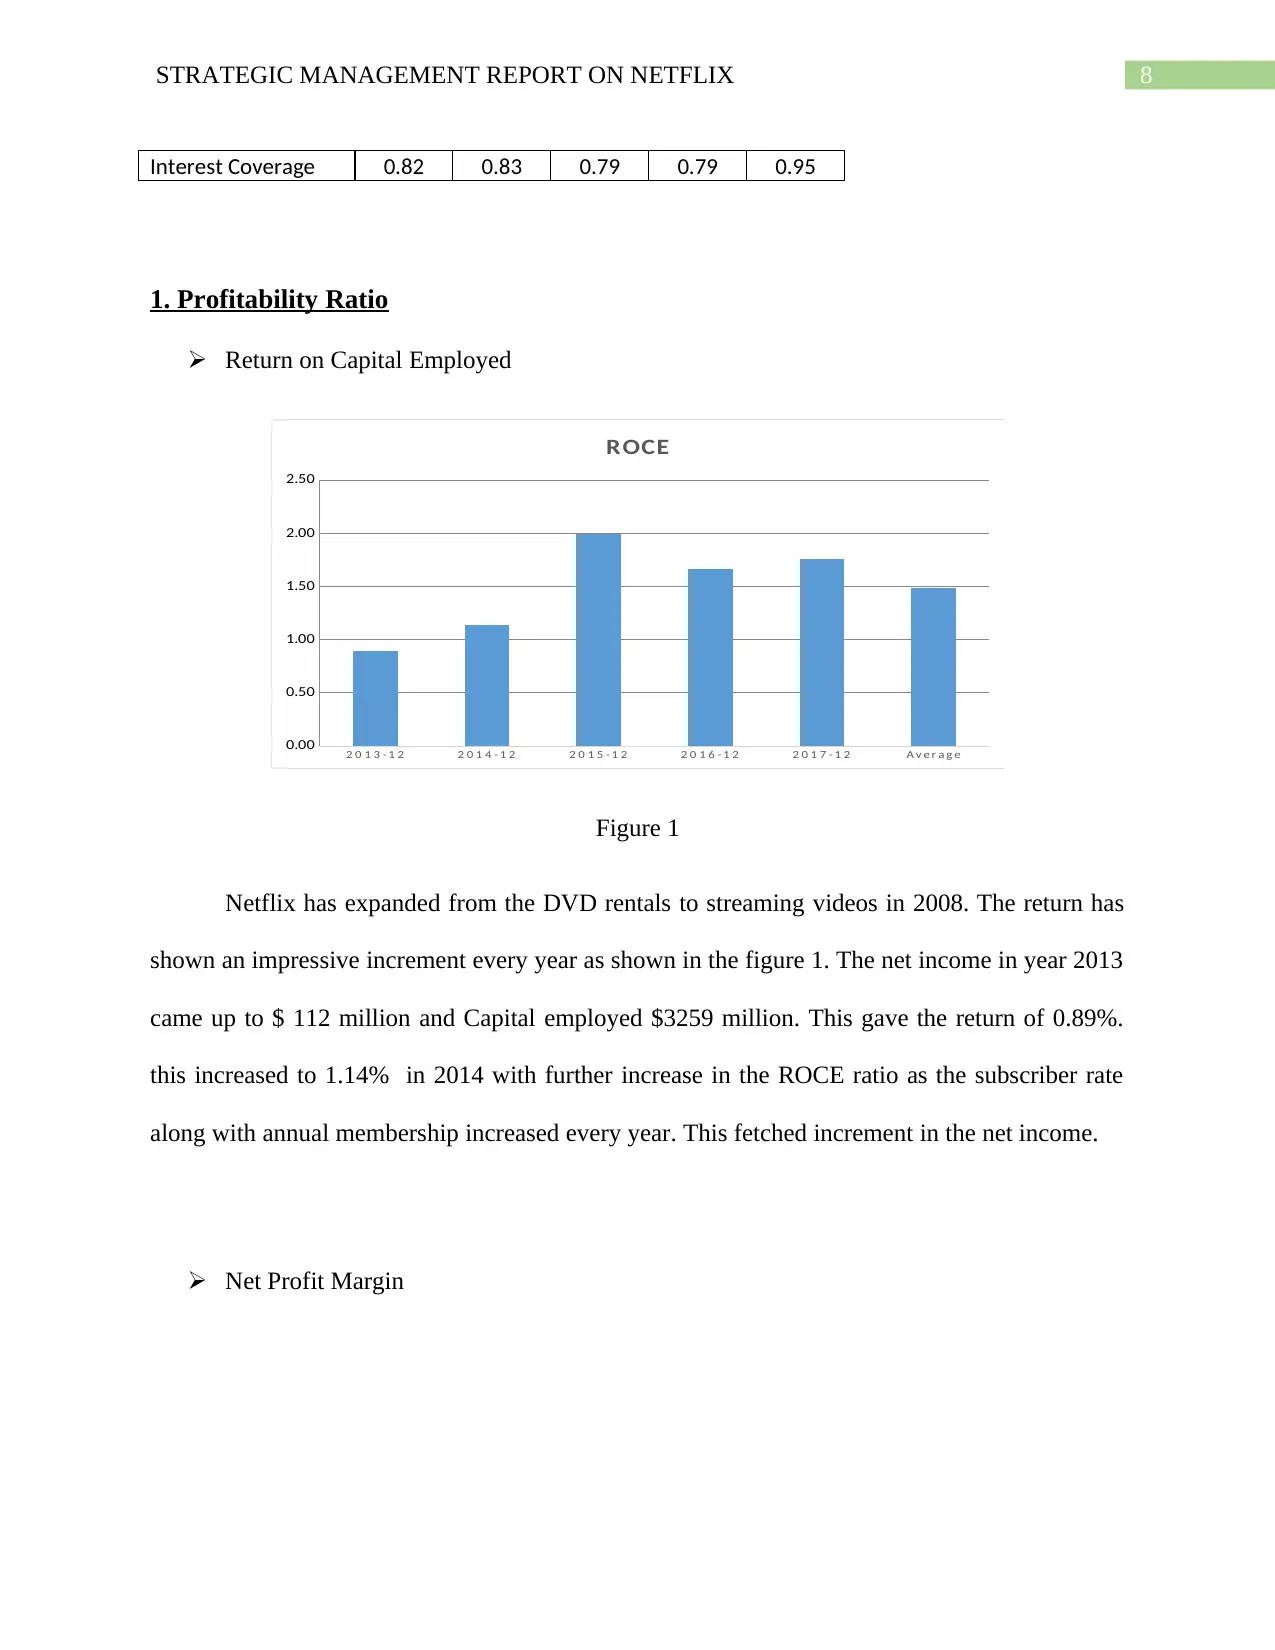
1. Profitability Ratio
Return on Capital Employed
2 0 1 3 - 1 2 2 0 1 4 - 1 2 2 0 1 5 - 1 2 2 0 1 6 - 1 2 2 0 1 7 - 1 2 A v e r a g e
0.00
0.50
1.00
1.50
2.00
2.50
ROCE
Figure 1
Netflix has expanded from the DVD rentals to streaming videos in 2008. The return has
shown an impressive increment every year as shown in the figure 1. The net income in year 2013
came up to $ 112 million and Capital employed $3259 million. This gave the return of 0.89%.
this increased to 1.14% in 2014 with further increase in the ROCE ratio as the subscriber rate
along with annual membership increased every year. This fetched increment in the net income.
Net Profit Margin
Interest Coverage 0.82 0.83 0.79 0.79 0.95
1. Profitability Ratio
Return on Capital Employed
2 0 1 3 - 1 2 2 0 1 4 - 1 2 2 0 1 5 - 1 2 2 0 1 6 - 1 2 2 0 1 7 - 1 2 A v e r a g e
0.00
0.50
1.00
1.50
2.00
2.50
ROCE
Figure 1
Netflix has expanded from the DVD rentals to streaming videos in 2008. The return has
shown an impressive increment every year as shown in the figure 1. The net income in year 2013
came up to $ 112 million and Capital employed $3259 million. This gave the return of 0.89%.
this increased to 1.14% in 2014 with further increase in the ROCE ratio as the subscriber rate
along with annual membership increased every year. This fetched increment in the net income.
Net Profit Margin
⊘ This is a preview!⊘
Do you want full access?
Subscribe today to unlock all pages.
Trusted by 1+ million students worldwide
STRATEGIC MANAGEMENT REPORT ON NETFLIX 9
2013-12 2014-12 2015-12 2016-12 2017-12 2018(Q1) 2018(Q2)
0.00
2.00
4.00
6.00
8.00
10.00
12.00
Net profit Margin
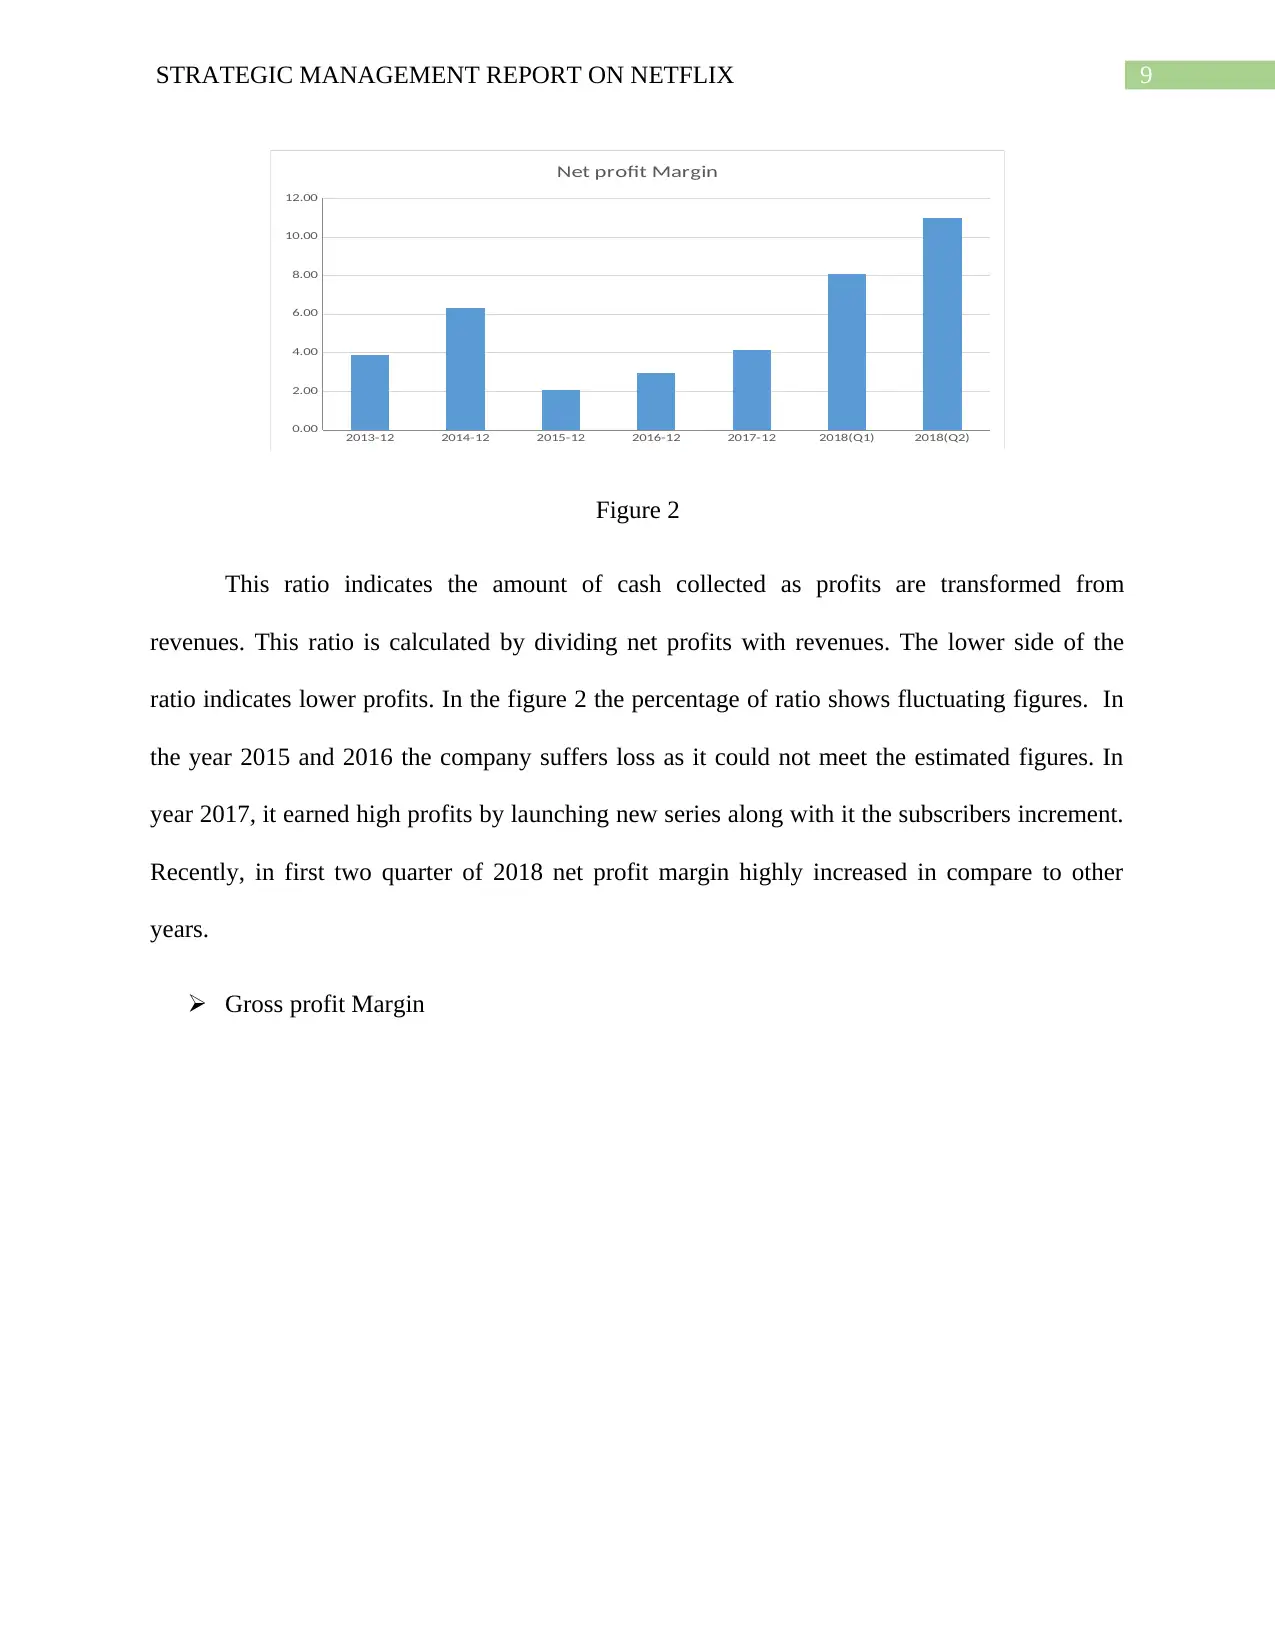
Figure 2
This ratio indicates the amount of cash collected as profits are transformed from
revenues. This ratio is calculated by dividing net profits with revenues. The lower side of the
ratio indicates lower profits. In the figure 2 the percentage of ratio shows fluctuating figures. In
the year 2015 and 2016 the company suffers loss as it could not meet the estimated figures. In
year 2017, it earned high profits by launching new series along with it the subscribers increment.
Recently, in first two quarter of 2018 net profit margin highly increased in compare to other
years.
Gross profit Margin
2013-12 2014-12 2015-12 2016-12 2017-12 2018(Q1) 2018(Q2)
0.00
2.00
4.00
6.00
8.00
10.00
12.00
Net profit Margin
Figure 2
This ratio indicates the amount of cash collected as profits are transformed from
revenues. This ratio is calculated by dividing net profits with revenues. The lower side of the
ratio indicates lower profits. In the figure 2 the percentage of ratio shows fluctuating figures. In
the year 2015 and 2016 the company suffers loss as it could not meet the estimated figures. In
year 2017, it earned high profits by launching new series along with it the subscribers increment.
Recently, in first two quarter of 2018 net profit margin highly increased in compare to other
years.
Gross profit Margin
Paraphrase This Document
Need a fresh take? Get an instant paraphrase of this document with our AI Paraphraser
STRATEGIC MANAGEMENT REPORT ON NETFLIX 10
2013-12 2014-12 2015-12 2016-12 2017-12 2018(Q1) 2018(Q2)
0.00
5.00
10.00
15.00
20.00
25.00
30.00
35.00
40.00
45.00
Gross Profit Margin
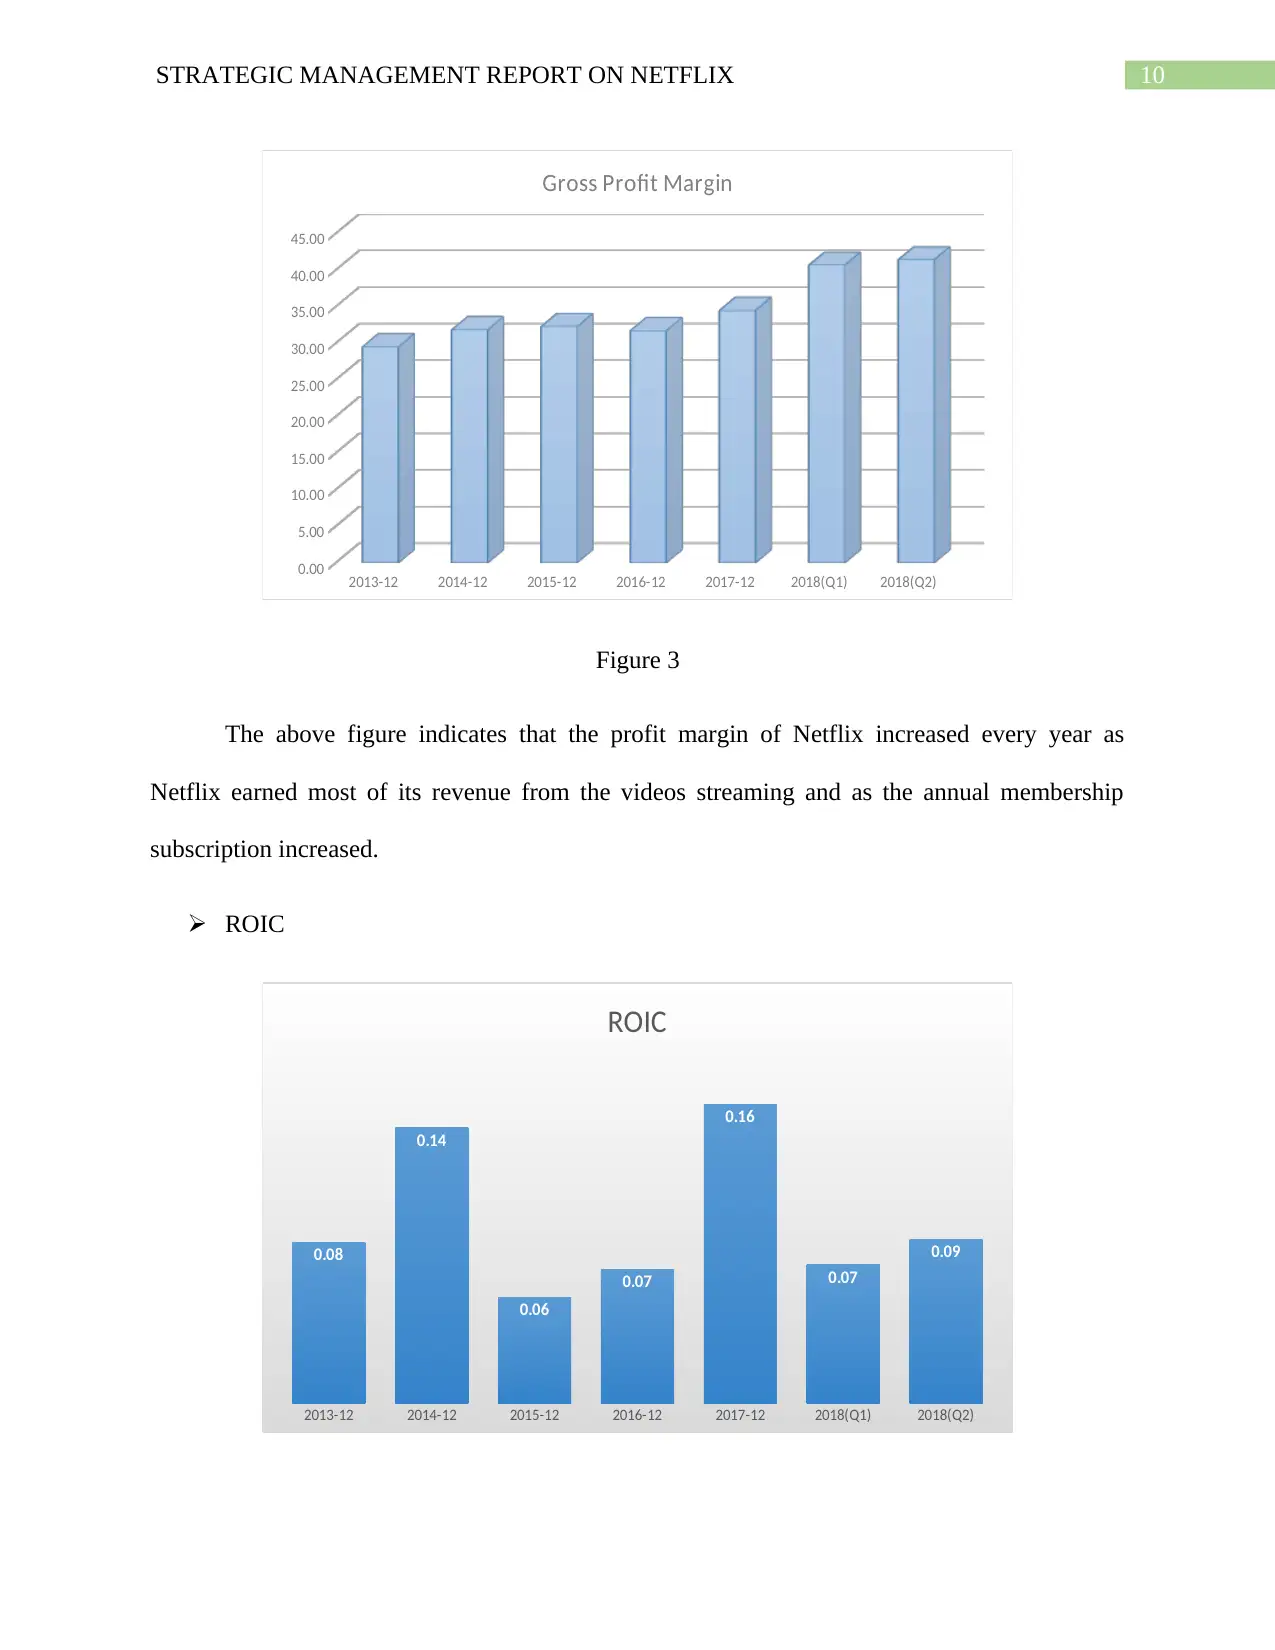
Figure 3
The above figure indicates that the profit margin of Netflix increased every year as
Netflix earned most of its revenue from the videos streaming and as the annual membership
subscription increased.
ROIC
2013-12 2014-12 2015-12 2016-12 2017-12 2018(Q1) 2018(Q2)
0.08
0.14
0.06
0.07
0.16
0.07
0.09
ROIC
2013-12 2014-12 2015-12 2016-12 2017-12 2018(Q1) 2018(Q2)
0.00
5.00
10.00
15.00
20.00
25.00
30.00
35.00
40.00
45.00
Gross Profit Margin
Figure 3
The above figure indicates that the profit margin of Netflix increased every year as
Netflix earned most of its revenue from the videos streaming and as the annual membership
subscription increased.
ROIC
2013-12 2014-12 2015-12 2016-12 2017-12 2018(Q1) 2018(Q2)
0.08
0.14
0.06
0.07
0.16
0.07
0.09
ROIC
STRATEGIC MANAGEMENT REPORT ON NETFLIX 11
The ROIC ratio indicates fluctuation return every year. In 2018, the quarterly return has
slightly increased. This indicates growth of company.
2. Efficiency Ratio
Debtors
2013-12 2014-12 2015-12 2016-12 2017-12 Average
140
145
150
155
160
165
170
Debtors(days)
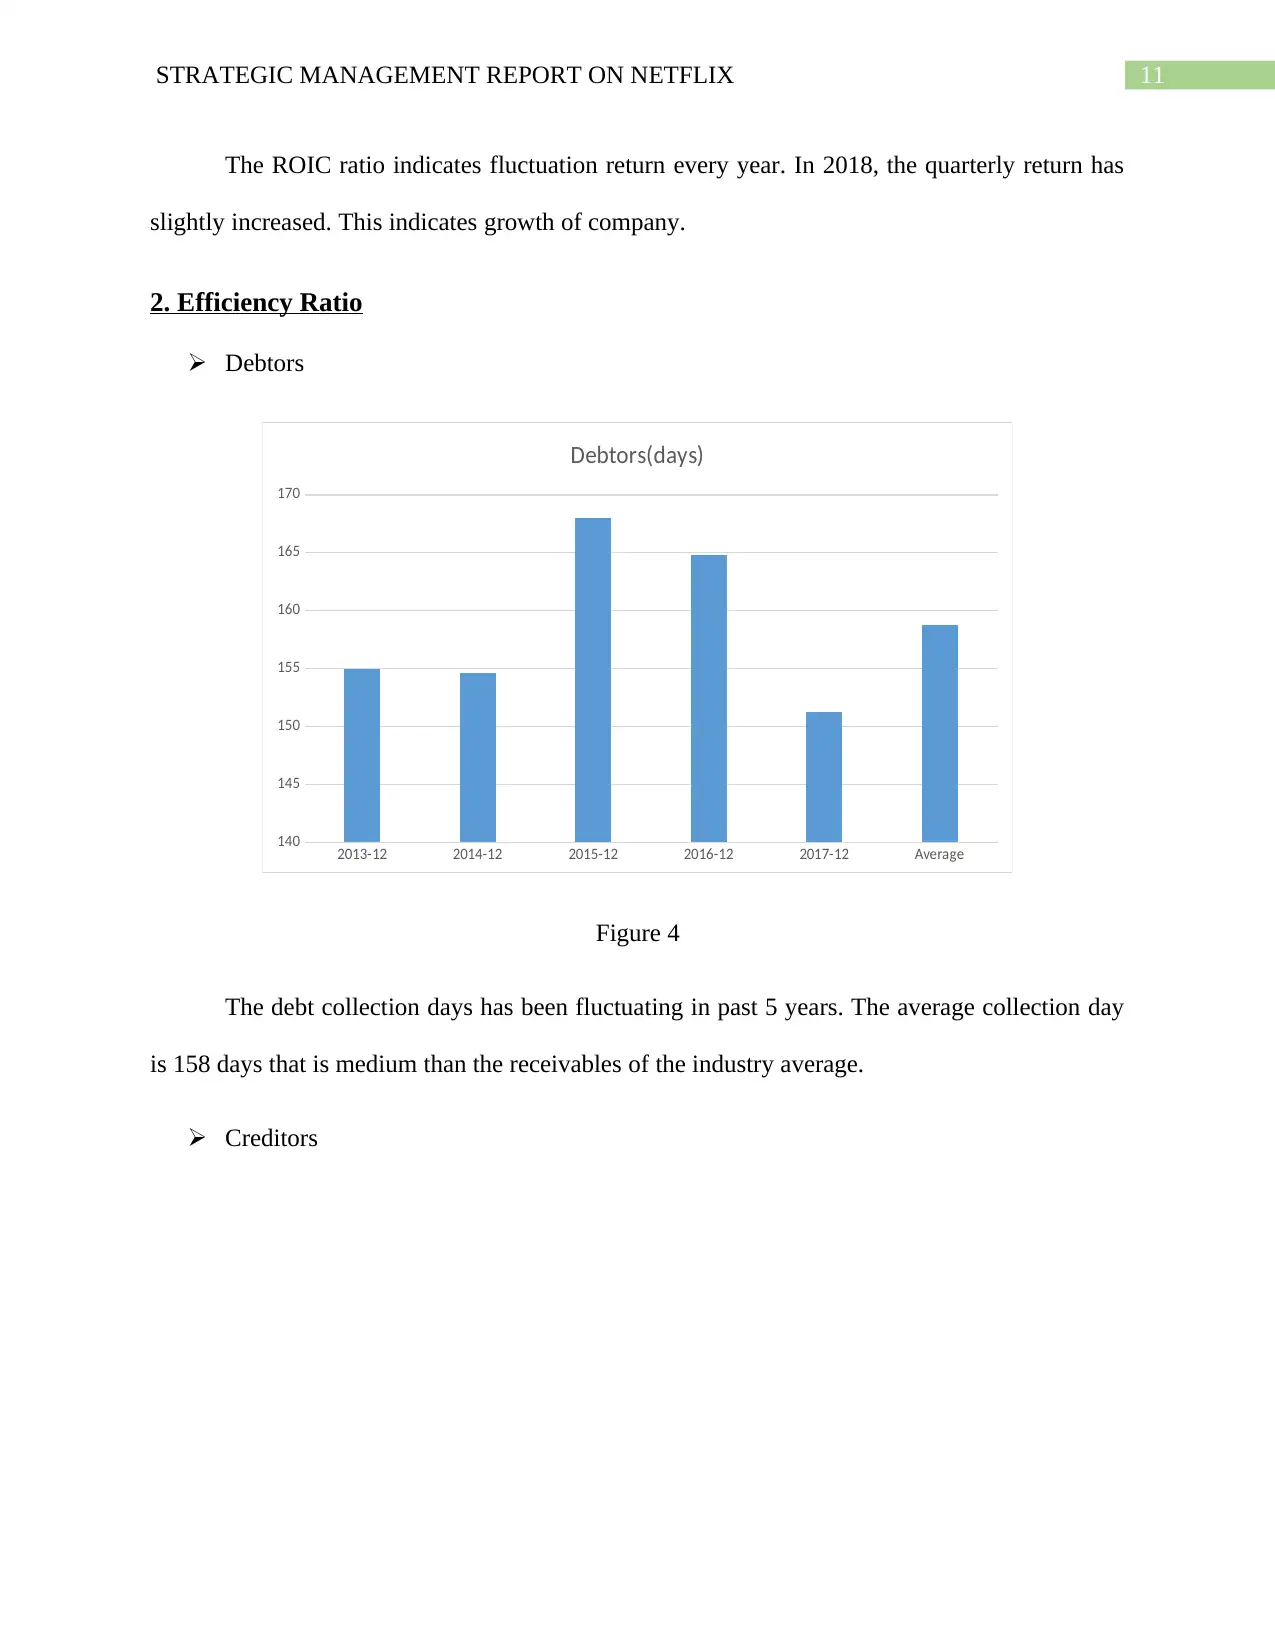
Figure 4
The debt collection days has been fluctuating in past 5 years. The average collection day
is 158 days that is medium than the receivables of the industry average.
Creditors
The ROIC ratio indicates fluctuation return every year. In 2018, the quarterly return has
slightly increased. This indicates growth of company.
2. Efficiency Ratio
Debtors
2013-12 2014-12 2015-12 2016-12 2017-12 Average
140
145
150
155
160
165
170
Debtors(days)
Figure 4
The debt collection days has been fluctuating in past 5 years. The average collection day
is 158 days that is medium than the receivables of the industry average.
Creditors
⊘ This is a preview!⊘
Do you want full access?
Subscribe today to unlock all pages.
Trusted by 1+ million students worldwide
1 out of 52
Related Documents


Your All-in-One AI-Powered Toolkit for Academic Success.
+13062052269
info@desklib.com
Available 24*7 on WhatsApp / Email
![[object Object]](/_next/static/media/star-bottom.7253800d.svg)
Unlock your academic potential
Copyright © 2020–2026 A2Z Services. All Rights Reserved. Developed and managed by ZUCOL.