Netflix Subscriber Growth Analysis: A Statistical Report (2011-2020)

Verified

Added on  2023/06/11

|7
|1227
|404
Report
AI Summary
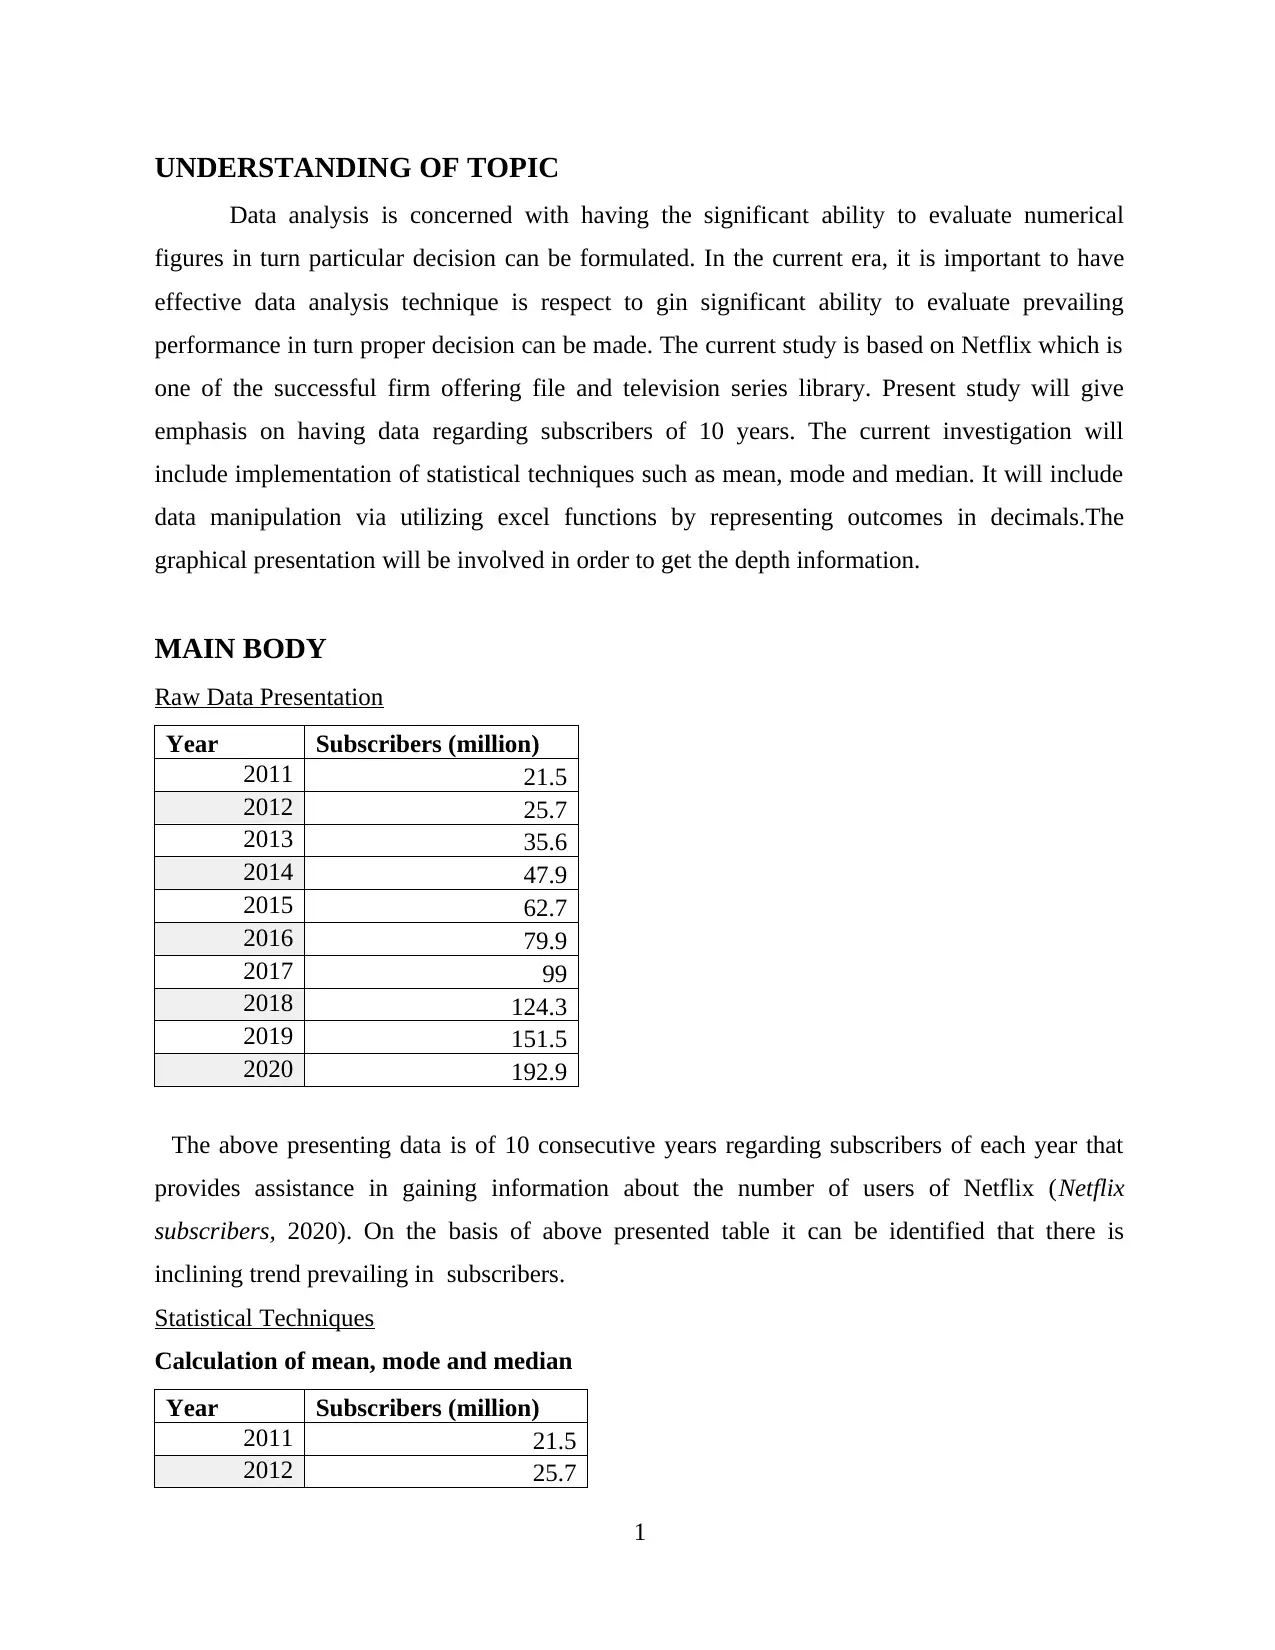
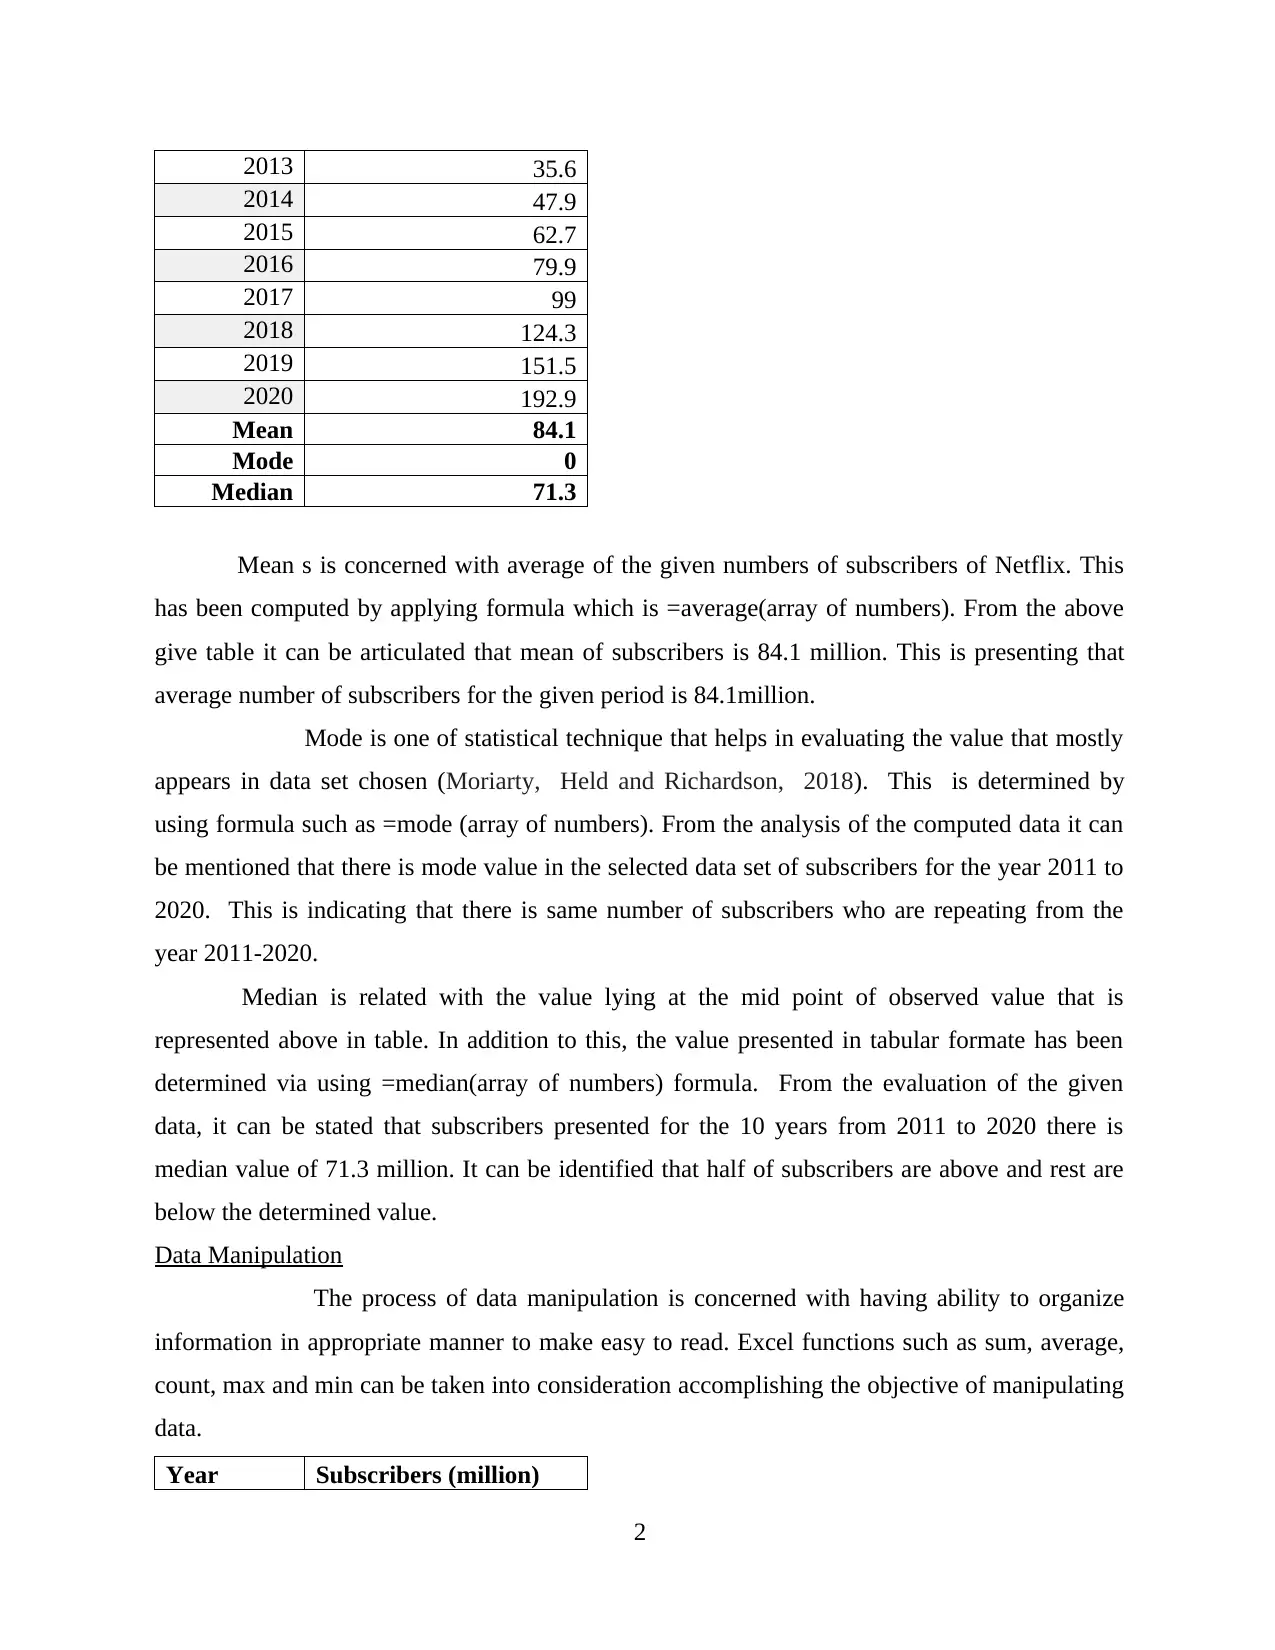
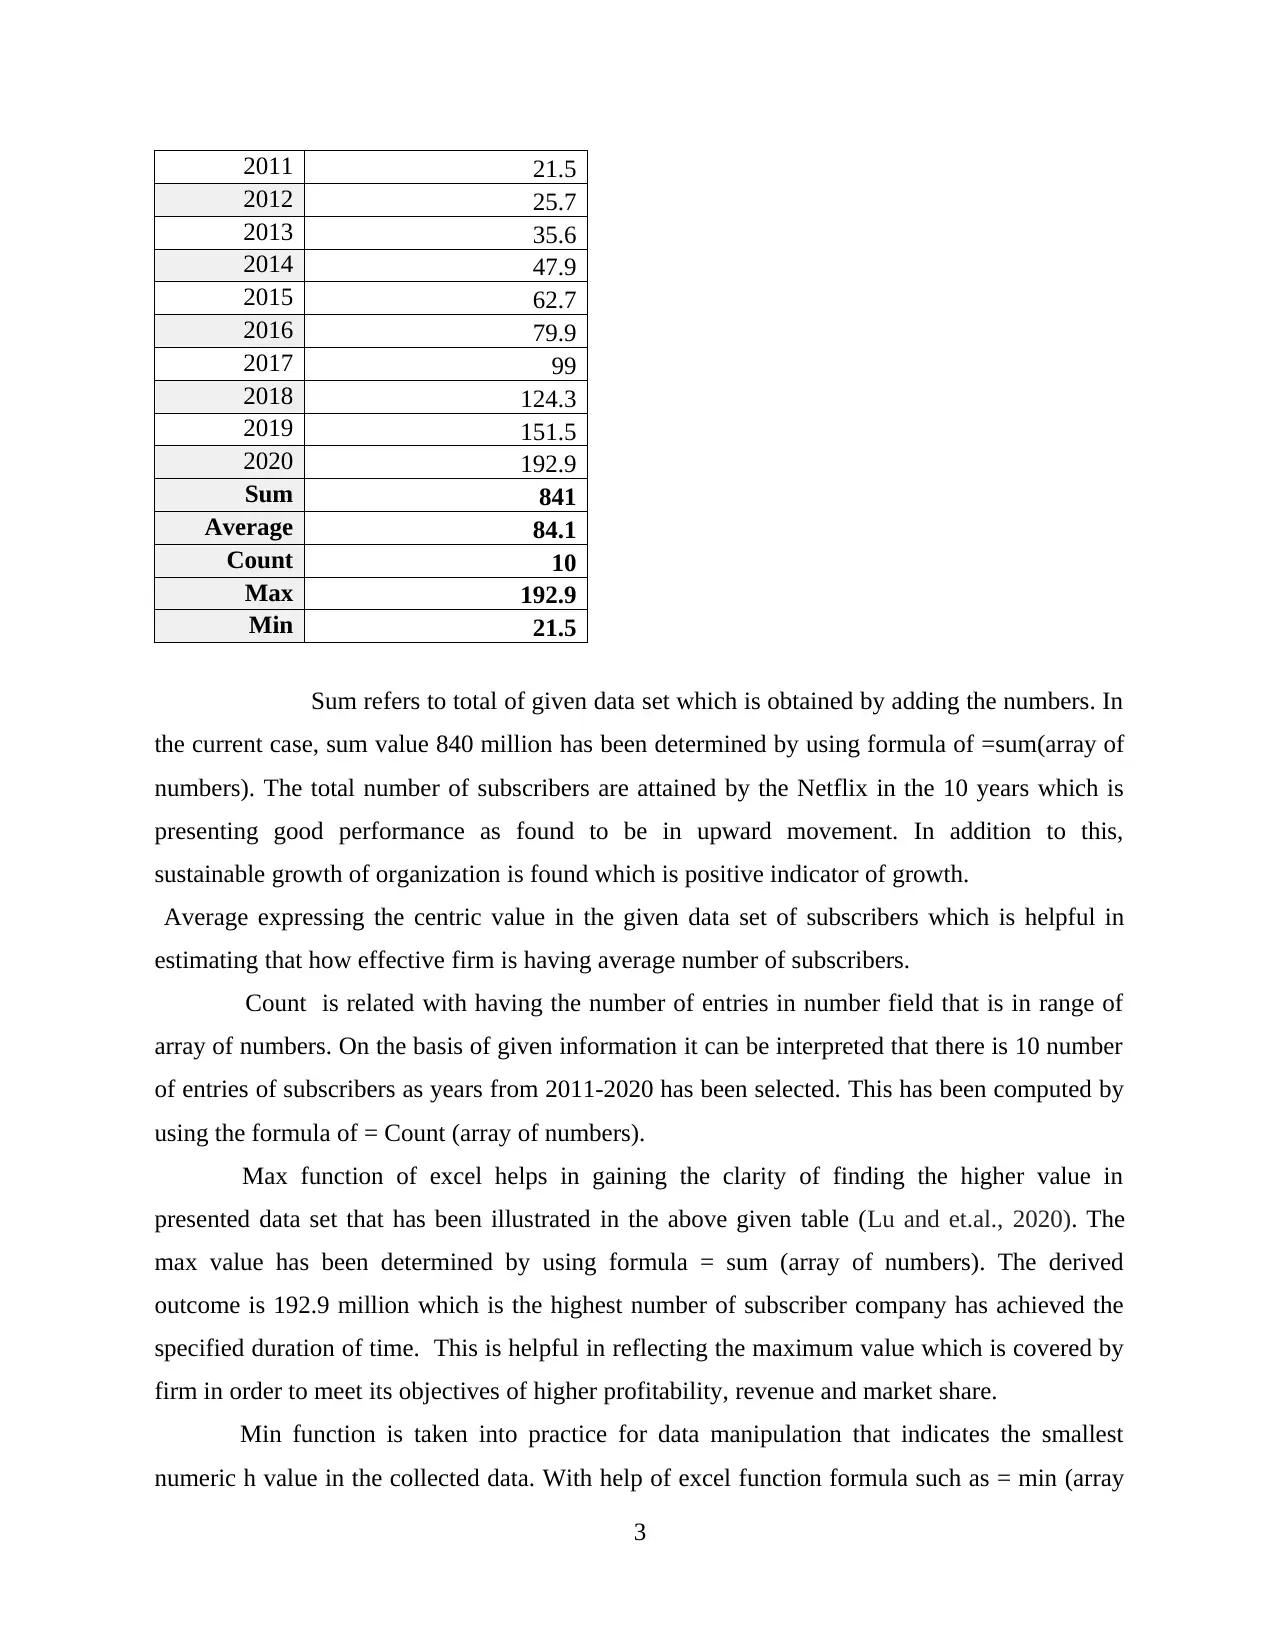
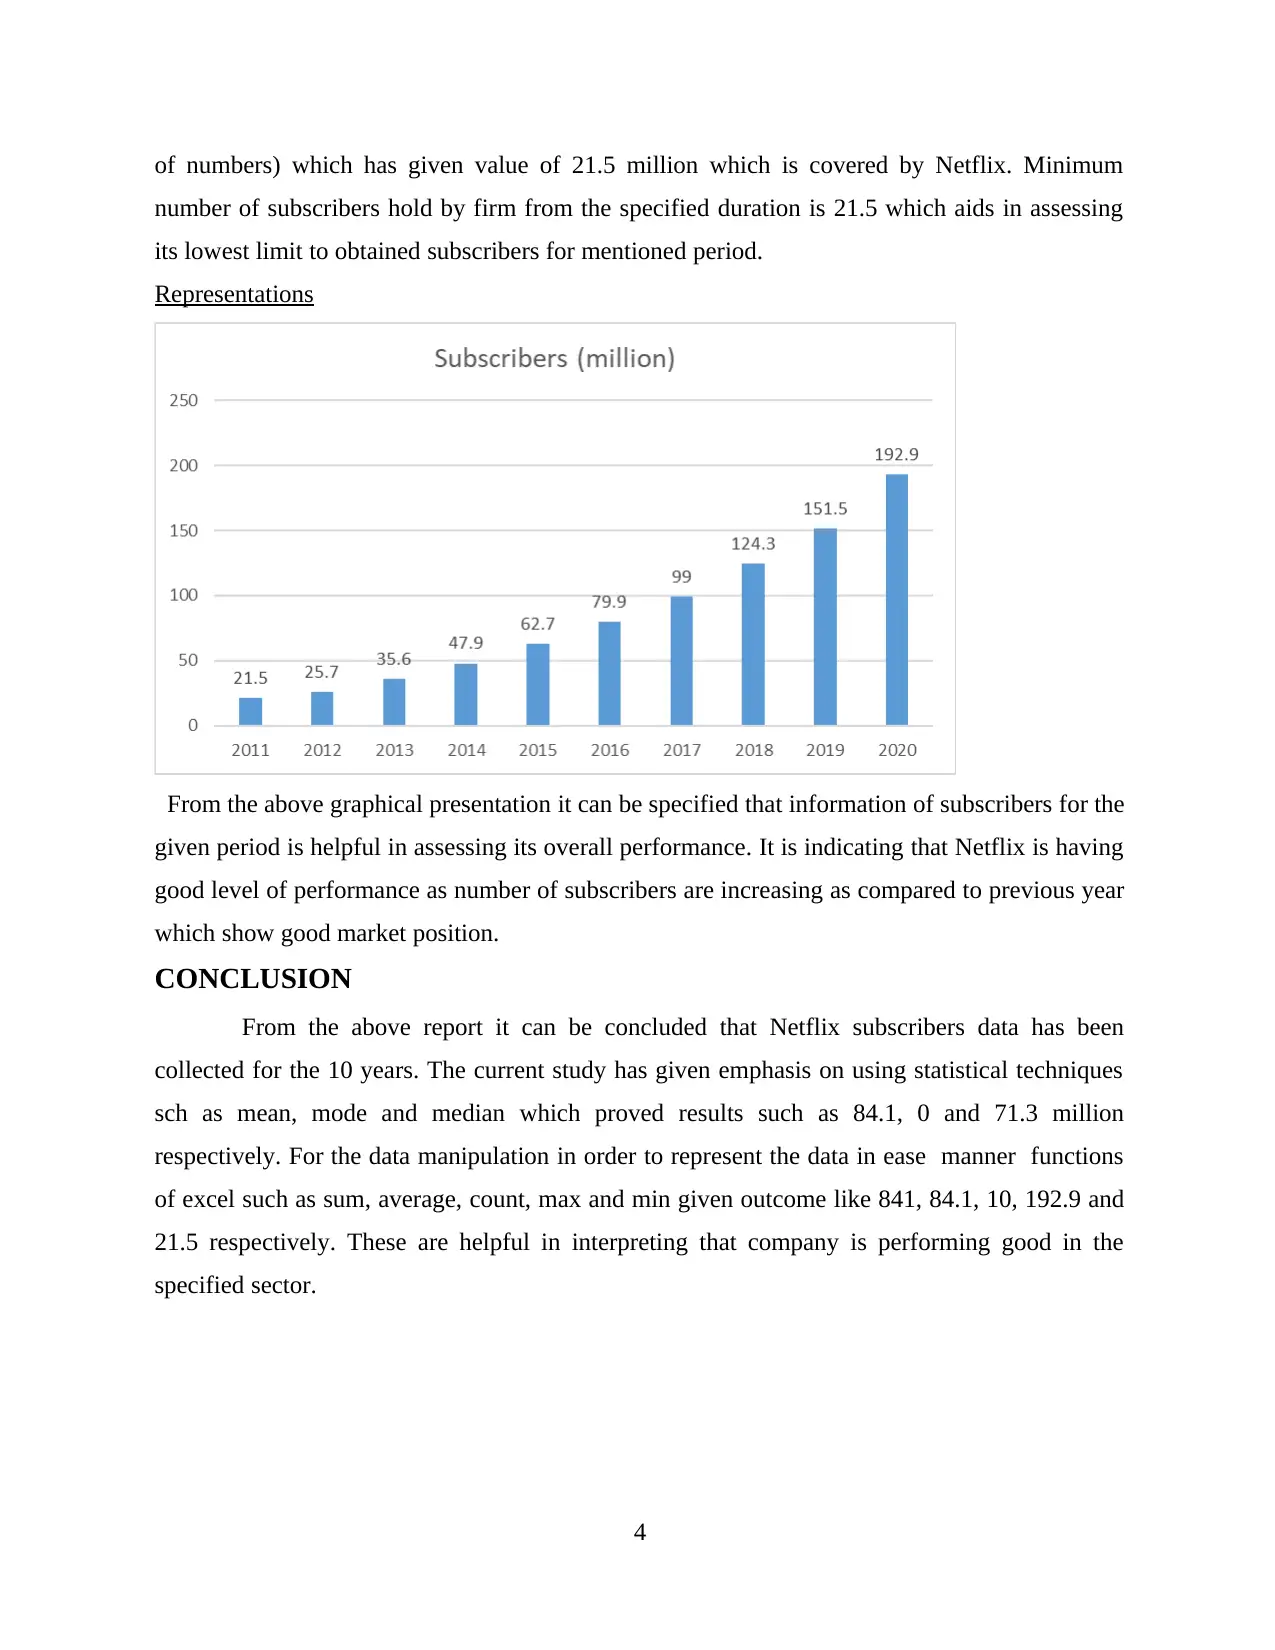
This report presents a data analysis of Netflix subscriber growth from 2011 to 2020. It employs statistical techniques such as mean, mode, and median to analyze subscriber numbers, revealing values of 84.1 million, 0, and 71.3 million, respectively. Data manipulation using Excel functions like sum, average, count, max, and min provides further insights, yielding results of 841 million, 84.1 million, 10, 192.9 million, and 21.5 million, respectively. These findings indicate positive performance and growth for Netflix during the specified period, supported by graphical representations illustrating increasing subscriber trends. The analysis concludes that Netflix has demonstrated a strong market position with consistent subscriber growth over the decade.
tabler-icon-diamond-filled.svg

Contribute Materials

Your contribution can guide someone’s learning journey. Share your documents today.
Document Page
Summative assessment
tabler-icon-diamond-filled.svg

Secure Best Marks with AI Grader

Need help grading? Try our AI Grader for instant feedback on your assignments.
Document Page
TABLE OF CONTENTS
UNDERSTANDING OF TOPIC.....................................................................................................1
MAIN BODY...................................................................................................................................1
Raw Data Presentation................................................................................................................1
Statistical Techniques..................................................................................................................1
Data Manipulation.......................................................................................................................2
Representations...........................................................................................................................4
CONCLUSION ...............................................................................................................................4
REFERENCES................................................................................................................................5
Document Page
UNDERSTANDING OF TOPIC
Data analysis is concerned with having the significant ability to evaluate numerical
figures in turn particular decision can be formulated. In the current era, it is important to have
effective data analysis technique is respect to gin significant ability to evaluate prevailing
performance in turn proper decision can be made. The current study is based on Netflix which is
one of the successful firm offering file and television series library. Present study will give
emphasis on having data regarding subscribers of 10 years. The current investigation will
include implementation of statistical techniques such as mean, mode and median. It will include
data manipulation via utilizing excel functions by representing outcomes in decimals.The
graphical presentation will be involved in order to get the depth information.
MAIN BODY
Raw Data Presentation
Year Subscribers (million)
2011 21.5
2012 25.7
2013 35.6
2014 47.9
2015 62.7
2016 79.9
2017 99
2018 124.3
2019 151.5
2020 192.9
The above presenting data is of 10 consecutive years regarding subscribers of each year that
provides assistance in gaining information about the number of users of Netflix (Netflix
subscribers, 2020). On the basis of above presented table it can be identified that there is
inclining trend prevailing in subscribers.
Statistical Techniques
Calculation of mean, mode and median
Year Subscribers (million)
2011 21.5
2012 25.7
1
Document Page
2013 35.6
2014 47.9
2015 62.7
2016 79.9
2017 99
2018 124.3
2019 151.5
2020 192.9
Mean 84.1
Mode 0
Median 71.3
Mean s is concerned with average of the given numbers of subscribers of Netflix. This
has been computed by applying formula which is =average(array of numbers). From the above
give table it can be articulated that mean of subscribers is 84.1 million. This is presenting that
average number of subscribers for the given period is 84.1million.
Mode is one of statistical technique that helps in evaluating the value that mostly
appears in data set chosen (Moriarty, Held and Richardson, 2018). This is determined by
using formula such as =mode (array of numbers). From the analysis of the computed data it can
be mentioned that there is mode value in the selected data set of subscribers for the year 2011 to
2020. This is indicating that there is same number of subscribers who are repeating from the
year 2011-2020.
Median is related with the value lying at the mid point of observed value that is
represented above in table. In addition to this, the value presented in tabular formate has been
determined via using =median(array of numbers) formula. From the evaluation of the given
data, it can be stated that subscribers presented for the 10 years from 2011 to 2020 there is
median value of 71.3 million. It can be identified that half of subscribers are above and rest are
below the determined value.
Data Manipulation
The process of data manipulation is concerned with having ability to organize
information in appropriate manner to make easy to read. Excel functions such as sum, average,
count, max and min can be taken into consideration accomplishing the objective of manipulating
data.
Year Subscribers (million)
2
tabler-icon-diamond-filled.svg

Secure Best Marks with AI Grader

Need help grading? Try our AI Grader for instant feedback on your assignments.
Document Page
2011 21.5
2012 25.7
2013 35.6
2014 47.9
2015 62.7
2016 79.9
2017 99
2018 124.3
2019 151.5
2020 192.9
Sum 841
Average 84.1
Count 10
Max 192.9
Min 21.5
Sum refers to total of given data set which is obtained by adding the numbers. In
the current case, sum value 840 million has been determined by using formula of =sum(array of
numbers). The total number of subscribers are attained by the Netflix in the 10 years which is
presenting good performance as found to be in upward movement. In addition to this,
sustainable growth of organization is found which is positive indicator of growth.
Average expressing the centric value in the given data set of subscribers which is helpful in
estimating that how effective firm is having average number of subscribers.
Count is related with having the number of entries in number field that is in range of
array of numbers. On the basis of given information it can be interpreted that there is 10 number
of entries of subscribers as years from 2011-2020 has been selected. This has been computed by
using the formula of = Count (array of numbers).
Max function of excel helps in gaining the clarity of finding the higher value in
presented data set that has been illustrated in the above given table (Lu and et.al., 2020). The
max value has been determined by using formula = sum (array of numbers). The derived
outcome is 192.9 million which is the highest number of subscriber company has achieved the
specified duration of time. This is helpful in reflecting the maximum value which is covered by
firm in order to meet its objectives of higher profitability, revenue and market share.
Min function is taken into practice for data manipulation that indicates the smallest
numeric h value in the collected data. With help of excel function formula such as = min (array
3
Document Page
of numbers) which has given value of 21.5 million which is covered by Netflix. Minimum
number of subscribers hold by firm from the specified duration is 21.5 which aids in assessing
its lowest limit to obtained subscribers for mentioned period.
Representations
From the above graphical presentation it can be specified that information of subscribers for the
given period is helpful in assessing its overall performance. It is indicating that Netflix is having
good level of performance as number of subscribers are increasing as compared to previous year
which show good market position.
CONCLUSION
From the above report it can be concluded that Netflix subscribers data has been
collected for the 10 years. The current study has given emphasis on using statistical techniques
sch as mean, mode and median which proved results such as 84.1, 0 and 71.3 million
respectively. For the data manipulation in order to represent the data in ease manner functions
of excel such as sum, average, count, max and min given outcome like 841, 84.1, 10, 192.9 and
21.5 respectively. These are helpful in interpreting that company is performing good in the
specified sector.
4
Document Page
REFERENCES
Books and Journals
Lu, S. and et.al., 2020. Hybrid block successive approximation for one-sided non-convex min-
max problems: algorithms and applications. IEEE Transactions on Signal Processing.
68. pp.3676-3691.
Moriarty, B., Held, B. and Richardson, T., 2018. Microsoft excel functions and formulas. Stylus
Publishing, LLC.
Online
Netflix subscribers. 2020. [Online]. Available through:
<https://www.businessofapps.com/data/netflix-statistics/>
5
chevron_up_icon
1 out of 7
circle_padding
hide_on_mobile
zoom_out_icon
logo.png

Your All-in-One AI-Powered Toolkit for Academic Success.

Available 24*7 on WhatsApp / Email

[object Object]