Analyzing Netflix Subscriber Data: Statistical Techniques Report
VerifiedAdded on 2023/06/07
|10
|1810
|211
Report
AI Summary
This report provides a comprehensive analysis of Netflix subscriber data from 2011 to 2020. It begins with the presentation of raw subscriber data, followed by the application of statistical techniques such as mean, mode, and median to derive insights into subscriber trends. The report utilizes Excel for data manipulation, demonstrating the use of functions like sum, average, count, maximum, and minimum. A chart illustrating subscriber growth over the years is also presented and interpreted. The analysis highlights the company's performance, emphasizing the importance of data analysis in making strategic decisions and gaining a competitive edge in the entertainment industry. The report concludes by summarizing the key findings and reinforcing the significance of statistical tools in data analysis for informed decision-making.

DHICT BA30589E
Paraphrase This Document
Need a fresh take? Get an instant paraphrase of this document with our AI Paraphraser
TABLE OF CONTENTS
INTRODUCTION...........................................................................................................................3
MAIN BODY..................................................................................................................................3
Presenting raw data......................................................................................................................3
Statistical technique application..................................................................................................4
Data manipulation........................................................................................................................6
Presenting the chart......................................................................................................................7
CONCLUSION................................................................................................................................8
REFERENCES................................................................................................................................9
INTRODUCTION
Data collection is one of the significant aspect which is required to be taken into the
consideration so that accomplishing the objective of analysing organizational performance to
make strategic decision can become possible. In the current era, possessing significant
application of data analysis becomes important as it allows emphasizing on crucial aspects so
that gaining competitiveness can be exerted. The current study is based on Netflix which is one
of successful firm operating in entertainment industry by offering the service of series, etc. that is
highly demanded in current market. The recent investigation will pay attention on having
application of raw data presentation, statistical techniques, data manipulation and chart regarding
the same so that depth understanding about the particular highlighted topic can be derived.
MAIN BODY
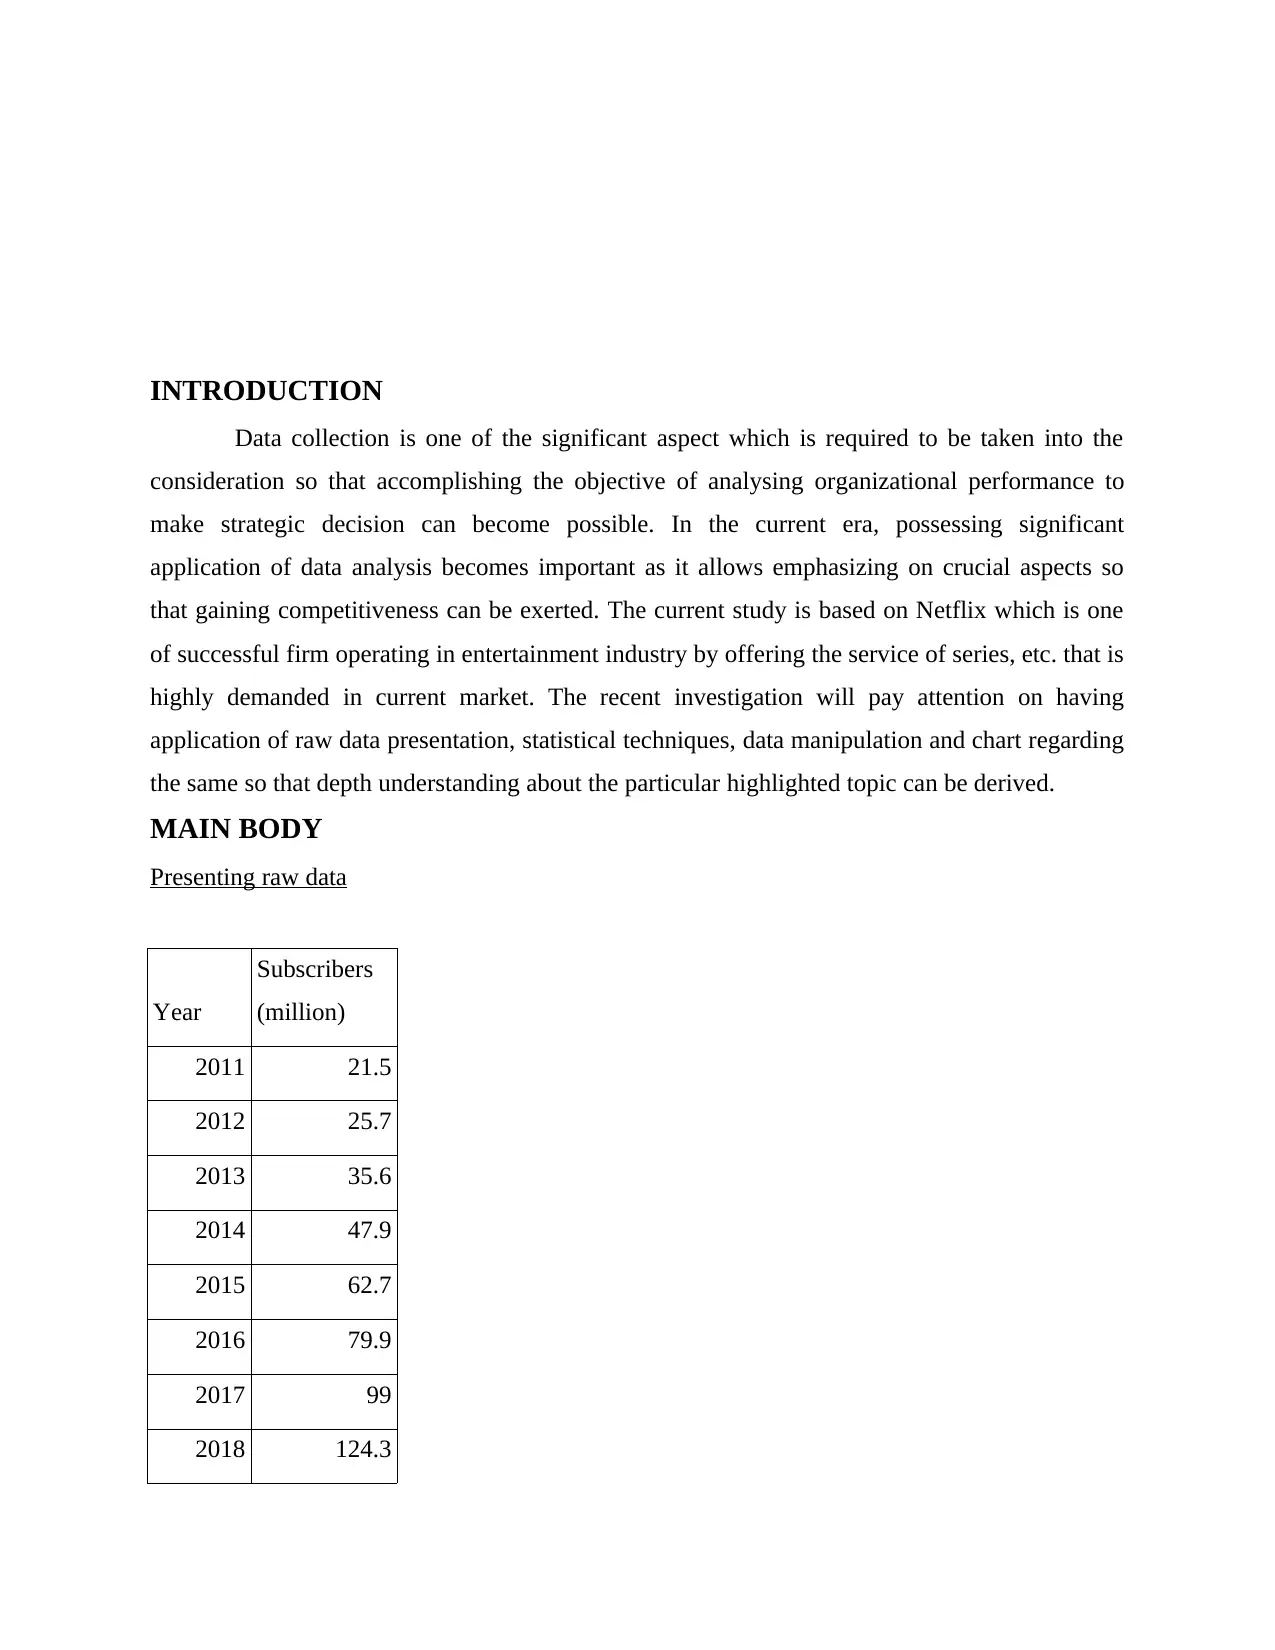
Presenting raw data
Year
Subscribers
(million)
2011 21.5
2012 25.7
2013 35.6
2014 47.9
2015 62.7
2016 79.9
2017 99
2018 124.3
Data collection is one of the significant aspect which is required to be taken into the
consideration so that accomplishing the objective of analysing organizational performance to
make strategic decision can become possible. In the current era, possessing significant
application of data analysis becomes important as it allows emphasizing on crucial aspects so
that gaining competitiveness can be exerted. The current study is based on Netflix which is one
of successful firm operating in entertainment industry by offering the service of series, etc. that is
highly demanded in current market. The recent investigation will pay attention on having
application of raw data presentation, statistical techniques, data manipulation and chart regarding
the same so that depth understanding about the particular highlighted topic can be derived.
MAIN BODY
Presenting raw data
Year
Subscribers
(million)
2011 21.5
2012 25.7
2013 35.6
2014 47.9
2015 62.7
2016 79.9
2017 99
2018 124.3
⊘ This is a preview!⊘
Do you want full access?
Subscribe today to unlock all pages.
Trusted by 1+ million students worldwide
2019 151.5
2020 192.9
It is important to give emphasis on having the significant presentation of raw data as it
play crucial role in giving the insights regarding the prevailing aspects of particular situation
(Sachiko, 2022.). In the current report the emphasis has been provided on having the reliable
presentation of subscribers in the millions so that its targeted audience can be evaluated. This
can help in gaining effective presentation of data so that accomplishing the reliable insights
about specified company’s performance can become possible. For becoming successful it is
important for the company to pay attention on having relevant information regarding its
subscribers of the company so that accomplishing the goal of analyzing its prevailing
performance can be done in effective manner.
Statistical technique application
Statistical techniques are taken into the consideration by the organization so that significant
processing by analyzing its overall performance in turn attaining higher effective performance
can become possible (Chatfield, 2018). For having proper information evaluation, the statistical
tools which can be used includes mean, mode and median which provides the assistance in
gaining competitive evaluation so that having reliable decision for gaining successful practicing
in industry. There are various benefits of using the statistical tools into the consideration such as
precise and accurate evaluation of information, significant gathering of end outcomes,
appropriate accomplishing of decision-making, etc.
Year
Subscribers
(million)
2011 21.5
2012 25.7
2013 35.6
2014 47.9
2015 62.7
Paraphrase This Document
Need a fresh take? Get an instant paraphrase of this document with our AI Paraphraser
2016 79.9
2017 99
2018 124.3
2019 151.5
2020 192.9
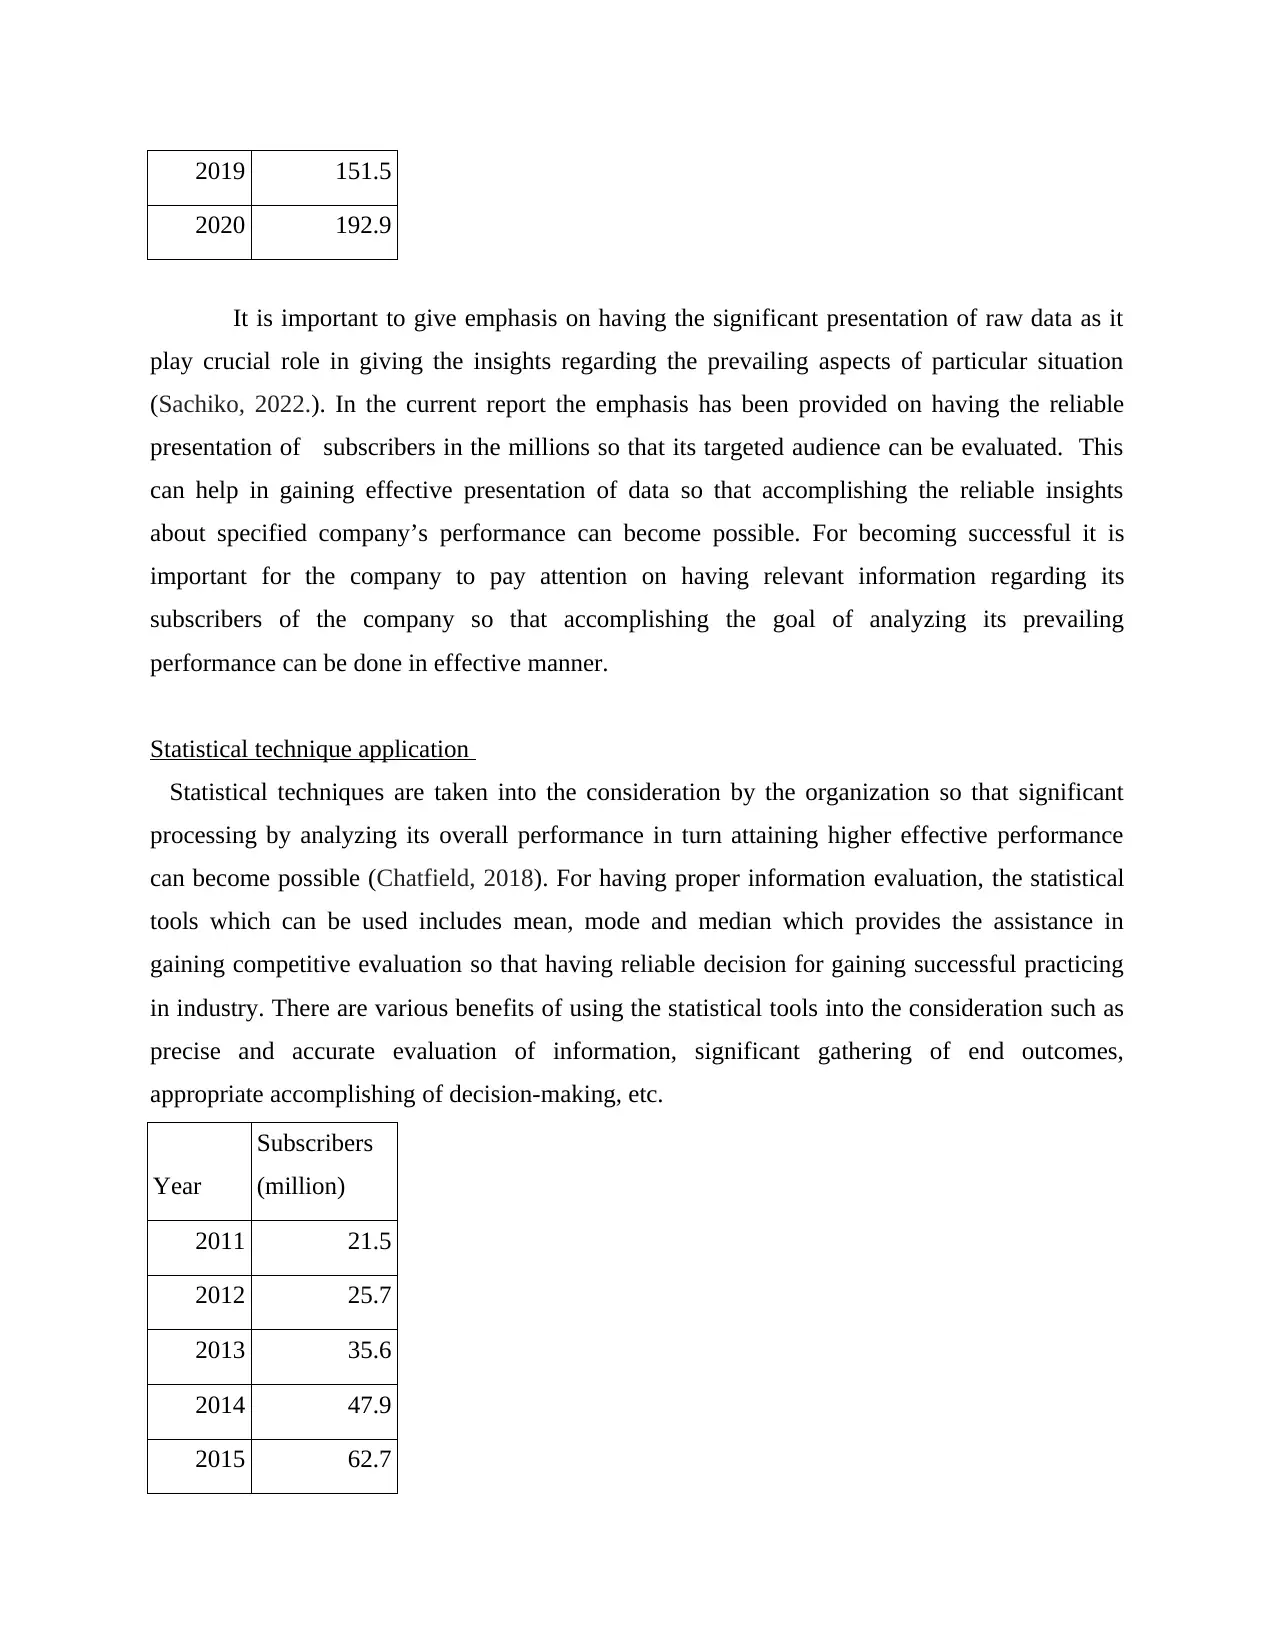
Mean 84.1
Mode 0
Median 71.3
On the basis of the above table it can be mentioned that mean value of subscribers of
Netflix is 84.1. This allows to get the insight that firm is having average number of subscribers
for the 10 years which allows to evaluate that firm is performing effective. It has been
determined by applying the formula inbuilt in excel that has helped in achieving the accurate and
fair value of mean. The main reason behind the application of this particular statistical tool is to
have effective way to understand that how much the particular company is gaining the customers
in terms of average (Tot, 2018). In addition to this, it helps in understanding that it gets affected
by the value of every item in the series as it is considered to be the central tendency of data. This
is taken into the considerations by organization which permits to have effectual information so
that taking the relevant decision-making can help in achieving the particular aspect. It is rigidly
defined that allows taking strategic decision which helps in accomplishing the reliable data that
gives assistance in achieving higher profitable actions can become possible. The main reason
behind the application of this particular strategy is that it takes into the process of calculation by
considering each value in turn significant outcomes can be obtained.
From the evaluation of the presented data it can be articulated that median derived for
the particular set of data regarding the subscribers of Netflix which comprises 71.3 million. It is
basically related with identifying the central value of the particular data set so that accomplishing
the objective of effective performance can be derived. This is basically estimated by arranging
the data in the ascending order so that accomplishing the goal of having effectual understanding
2017 99
2018 124.3
2019 151.5
2020 192.9
Mean 84.1
Mode 0
Median 71.3
On the basis of the above table it can be mentioned that mean value of subscribers of
Netflix is 84.1. This allows to get the insight that firm is having average number of subscribers
for the 10 years which allows to evaluate that firm is performing effective. It has been
determined by applying the formula inbuilt in excel that has helped in achieving the accurate and
fair value of mean. The main reason behind the application of this particular statistical tool is to
have effective way to understand that how much the particular company is gaining the customers
in terms of average (Tot, 2018). In addition to this, it helps in understanding that it gets affected
by the value of every item in the series as it is considered to be the central tendency of data. This
is taken into the considerations by organization which permits to have effectual information so
that taking the relevant decision-making can help in achieving the particular aspect. It is rigidly
defined that allows taking strategic decision which helps in accomplishing the reliable data that
gives assistance in achieving higher profitable actions can become possible. The main reason
behind the application of this particular strategy is that it takes into the process of calculation by
considering each value in turn significant outcomes can be obtained.
From the evaluation of the presented data it can be articulated that median derived for
the particular set of data regarding the subscribers of Netflix which comprises 71.3 million. It is
basically related with identifying the central value of the particular data set so that accomplishing
the objective of effective performance can be derived. This is basically estimated by arranging
the data in the ascending order so that accomplishing the goal of having effectual understanding
about particular subject matter can become possible. Netflix can achieve the various benefits
from the application of median statistical tool is to recognize the mid value prevailing in data set
so that taking the reliable formulation of policies to have strategic decision-making. In addition
to this, it can be articulated that it is influenced by extremely larger values that gives assistance
in having effective formulation of decision by considering all the values affecting its
performance.
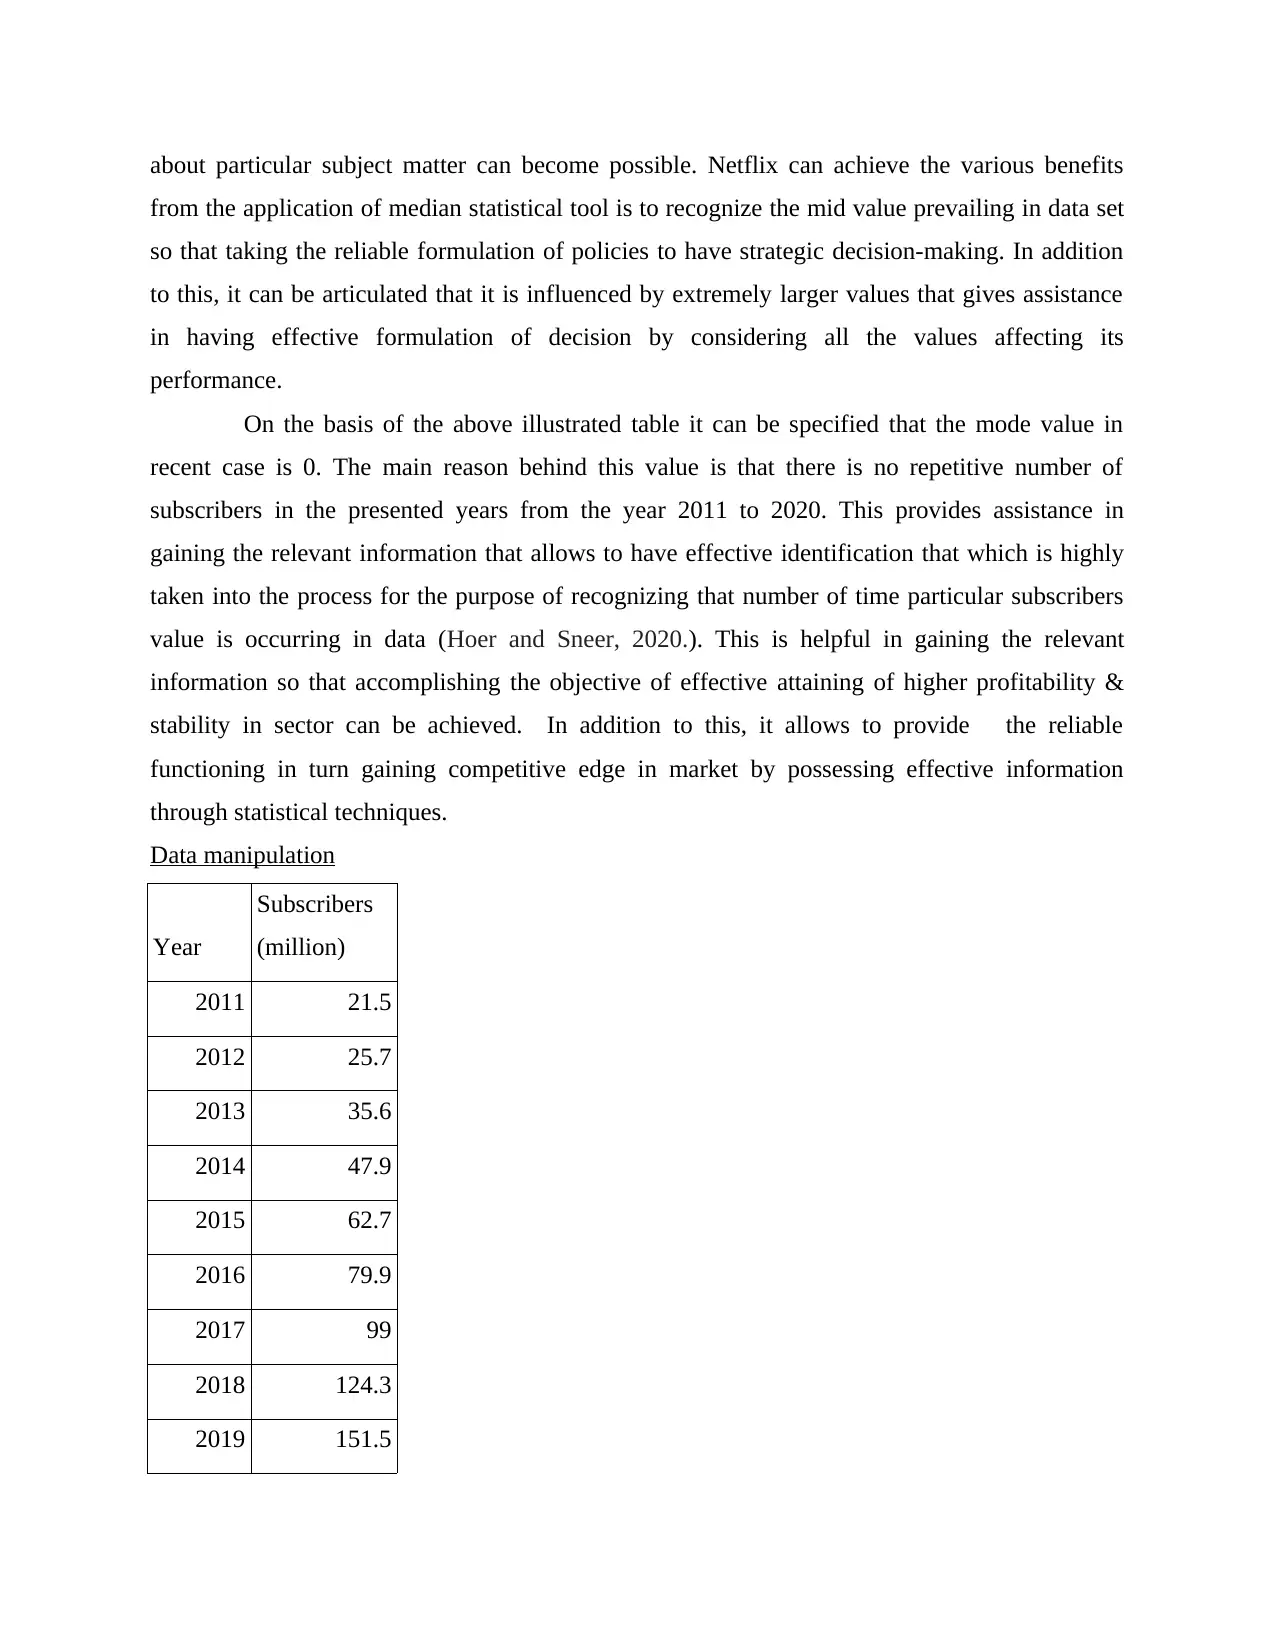
On the basis of the above illustrated table it can be specified that the mode value in
recent case is 0. The main reason behind this value is that there is no repetitive number of
subscribers in the presented years from the year 2011 to 2020. This provides assistance in
gaining the relevant information that allows to have effective identification that which is highly
taken into the process for the purpose of recognizing that number of time particular subscribers
value is occurring in data (Hoer and Sneer, 2020.). This is helpful in gaining the relevant
information so that accomplishing the objective of effective attaining of higher profitability &
stability in sector can be achieved. In addition to this, it allows to provide the reliable
functioning in turn gaining competitive edge in market by possessing effective information
through statistical techniques.
Data manipulation
Year
Subscribers
(million)
2011 21.5
2012 25.7
2013 35.6
2014 47.9
2015 62.7
2016 79.9
2017 99
2018 124.3
2019 151.5
from the application of median statistical tool is to recognize the mid value prevailing in data set
so that taking the reliable formulation of policies to have strategic decision-making. In addition
to this, it can be articulated that it is influenced by extremely larger values that gives assistance
in having effective formulation of decision by considering all the values affecting its
performance.
On the basis of the above illustrated table it can be specified that the mode value in
recent case is 0. The main reason behind this value is that there is no repetitive number of
subscribers in the presented years from the year 2011 to 2020. This provides assistance in
gaining the relevant information that allows to have effective identification that which is highly
taken into the process for the purpose of recognizing that number of time particular subscribers
value is occurring in data (Hoer and Sneer, 2020.). This is helpful in gaining the relevant
information so that accomplishing the objective of effective attaining of higher profitability &
stability in sector can be achieved. In addition to this, it allows to provide the reliable
functioning in turn gaining competitive edge in market by possessing effective information
through statistical techniques.
Data manipulation
Year
Subscribers
(million)
2011 21.5
2012 25.7
2013 35.6
2014 47.9
2015 62.7
2016 79.9
2017 99
2018 124.3
2019 151.5
⊘ This is a preview!⊘
Do you want full access?
Subscribe today to unlock all pages.
Trusted by 1+ million students worldwide
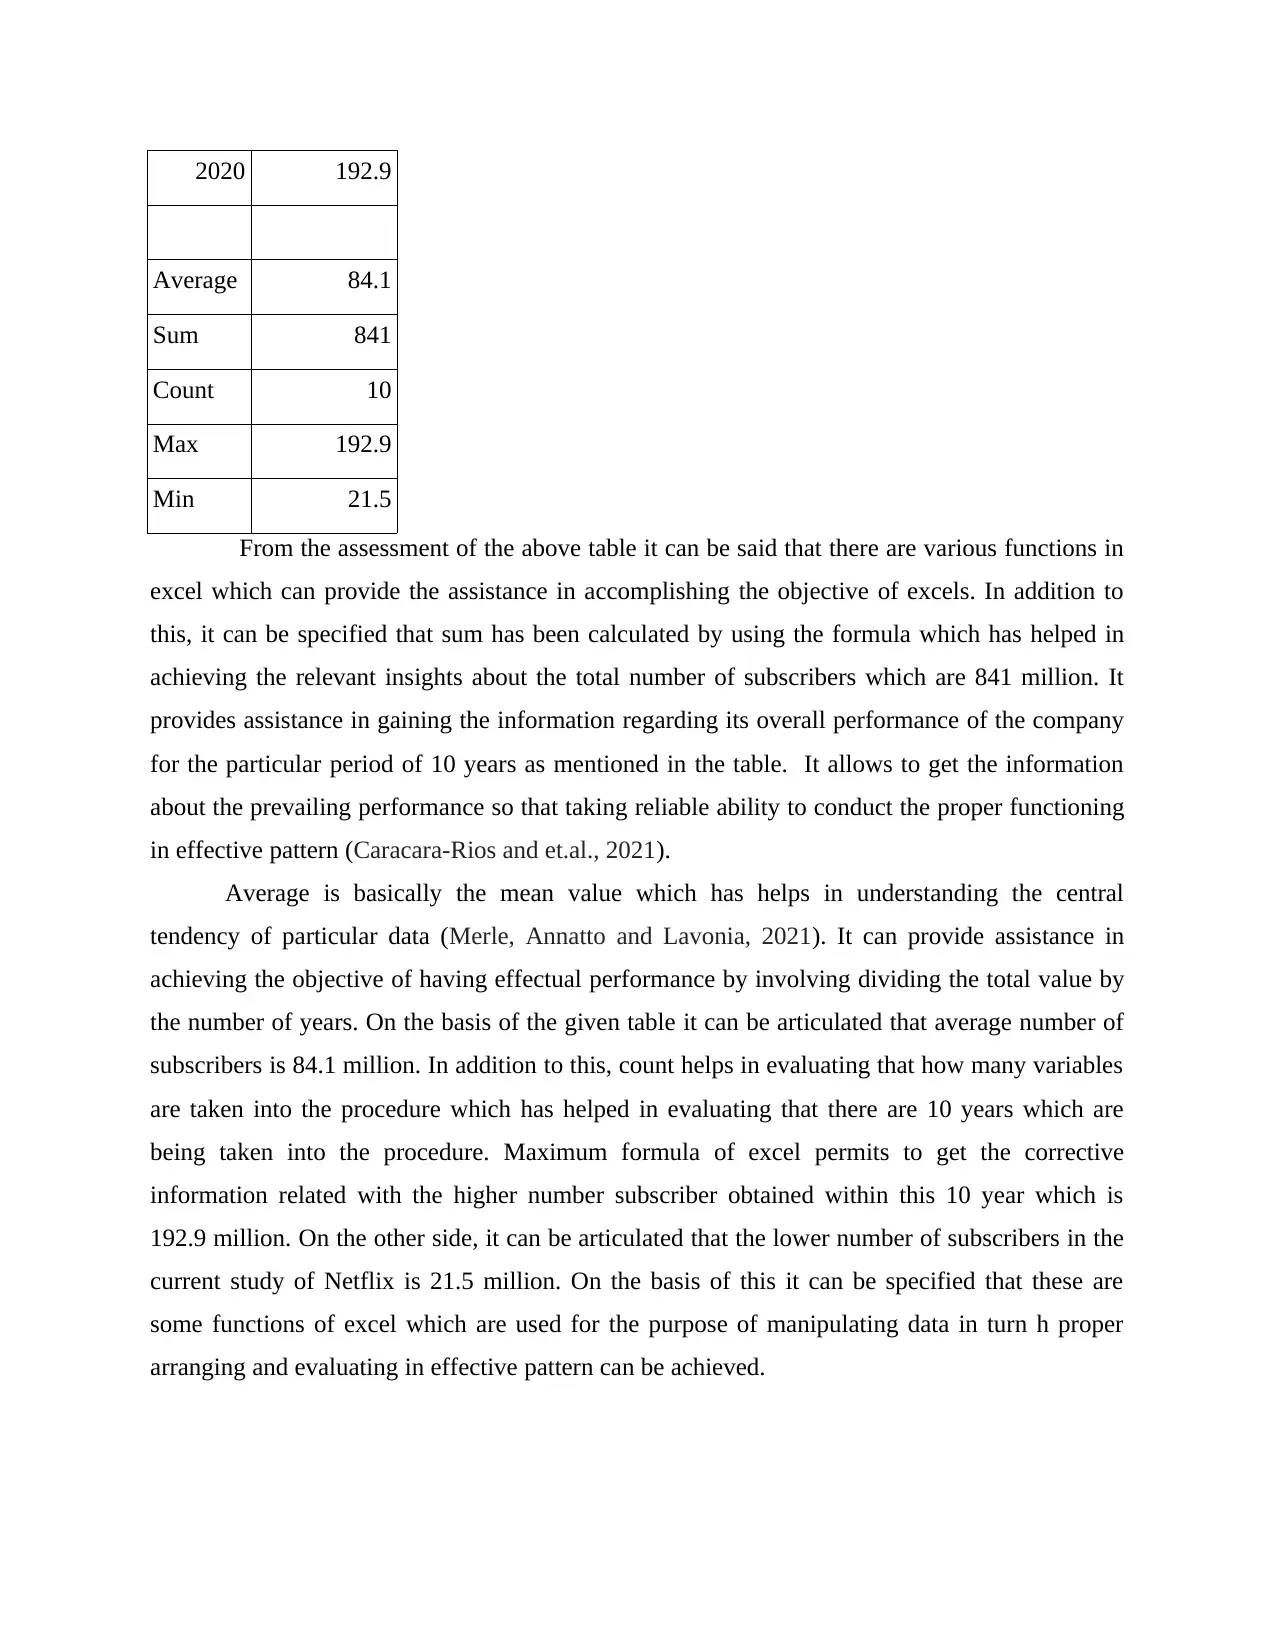
2020 192.9
Average 84.1
Sum 841
Count 10
Max 192.9
Min 21.5
From the assessment of the above table it can be said that there are various functions in
excel which can provide the assistance in accomplishing the objective of excels. In addition to
this, it can be specified that sum has been calculated by using the formula which has helped in
achieving the relevant insights about the total number of subscribers which are 841 million. It
provides assistance in gaining the information regarding its overall performance of the company
for the particular period of 10 years as mentioned in the table. It allows to get the information
about the prevailing performance so that taking reliable ability to conduct the proper functioning
in effective pattern (Caracara-Rios and et.al., 2021).
Average is basically the mean value which has helps in understanding the central
tendency of particular data (Merle, Annatto and Lavonia, 2021). It can provide assistance in
achieving the objective of having effectual performance by involving dividing the total value by
the number of years. On the basis of the given table it can be articulated that average number of
subscribers is 84.1 million. In addition to this, count helps in evaluating that how many variables
are taken into the procedure which has helped in evaluating that there are 10 years which are
being taken into the procedure. Maximum formula of excel permits to get the corrective
information related with the higher number subscriber obtained within this 10 year which is
192.9 million. On the other side, it can be articulated that the lower number of subscribers in the
current study of Netflix is 21.5 million. On the basis of this it can be specified that these are
some functions of excel which are used for the purpose of manipulating data in turn h proper
arranging and evaluating in effective pattern can be achieved.
Paraphrase This Document
Need a fresh take? Get an instant paraphrase of this document with our AI Paraphraser
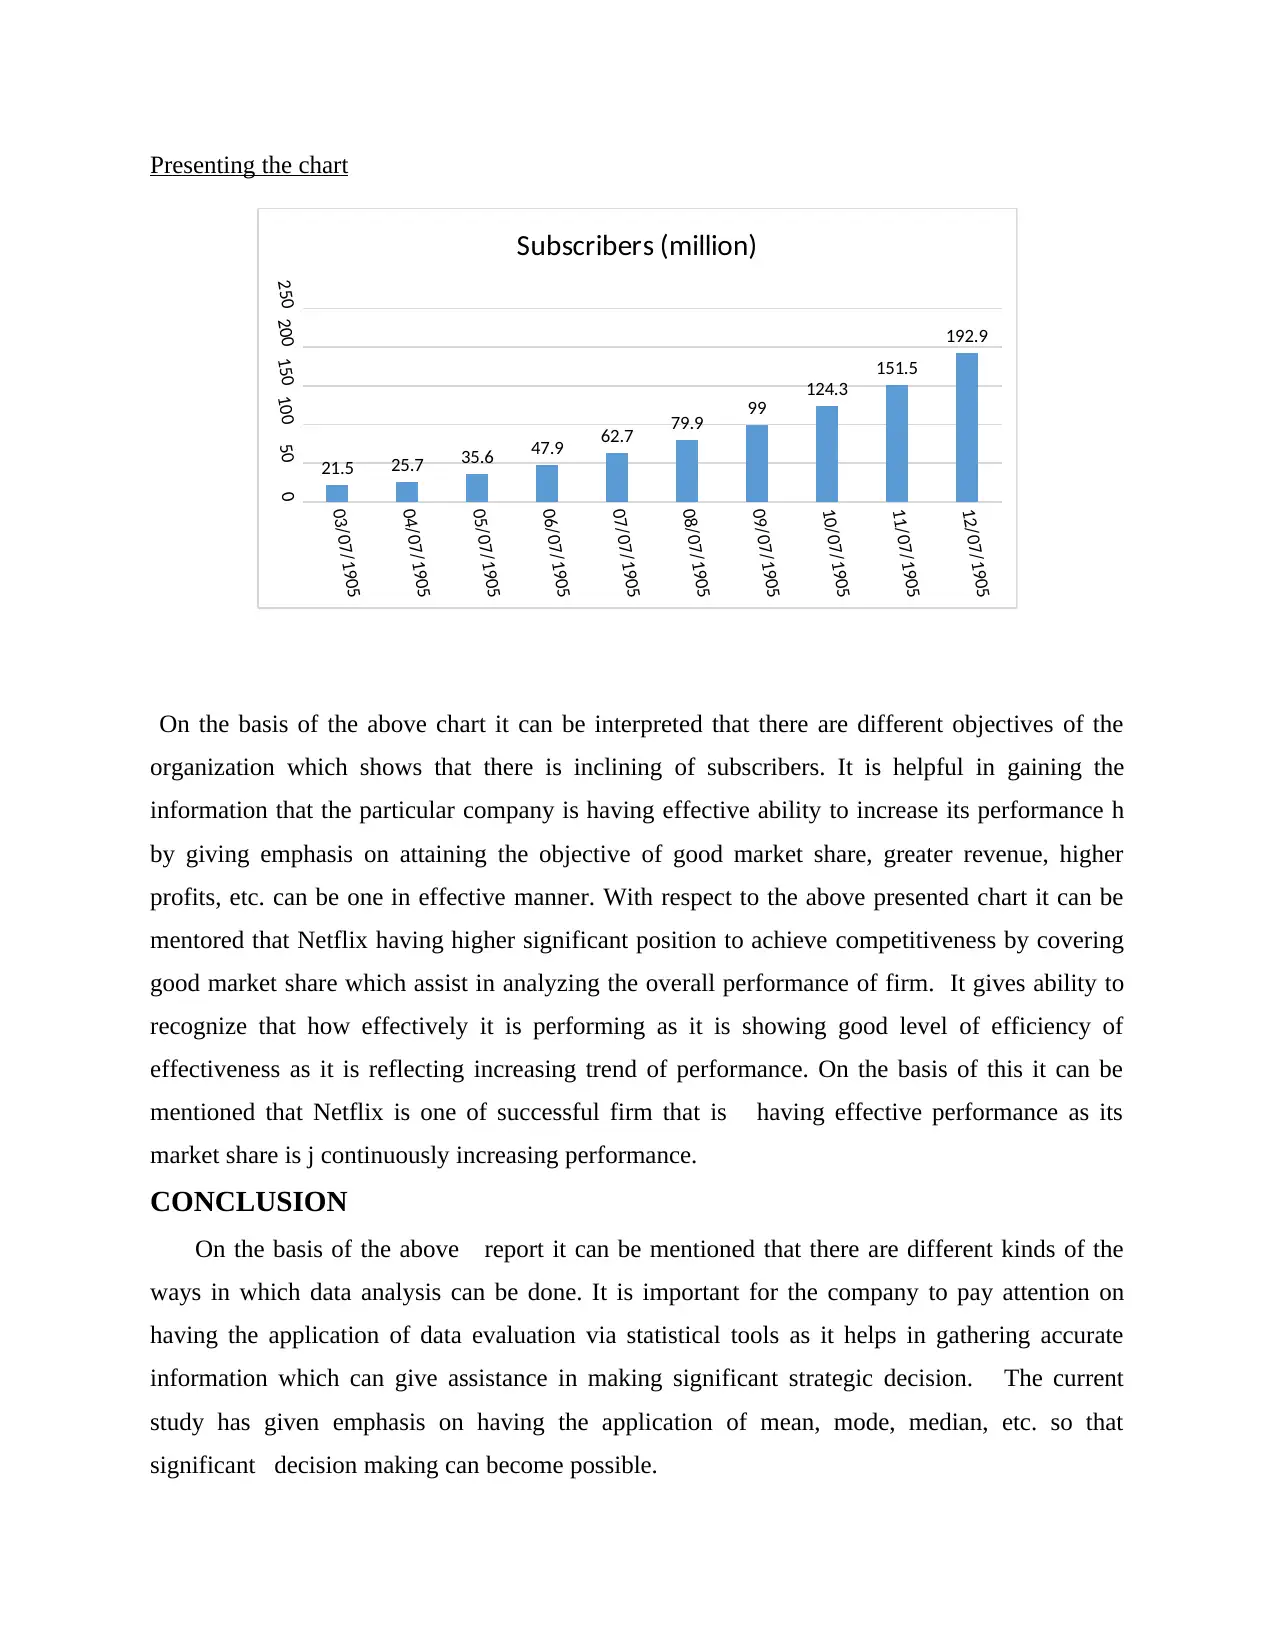
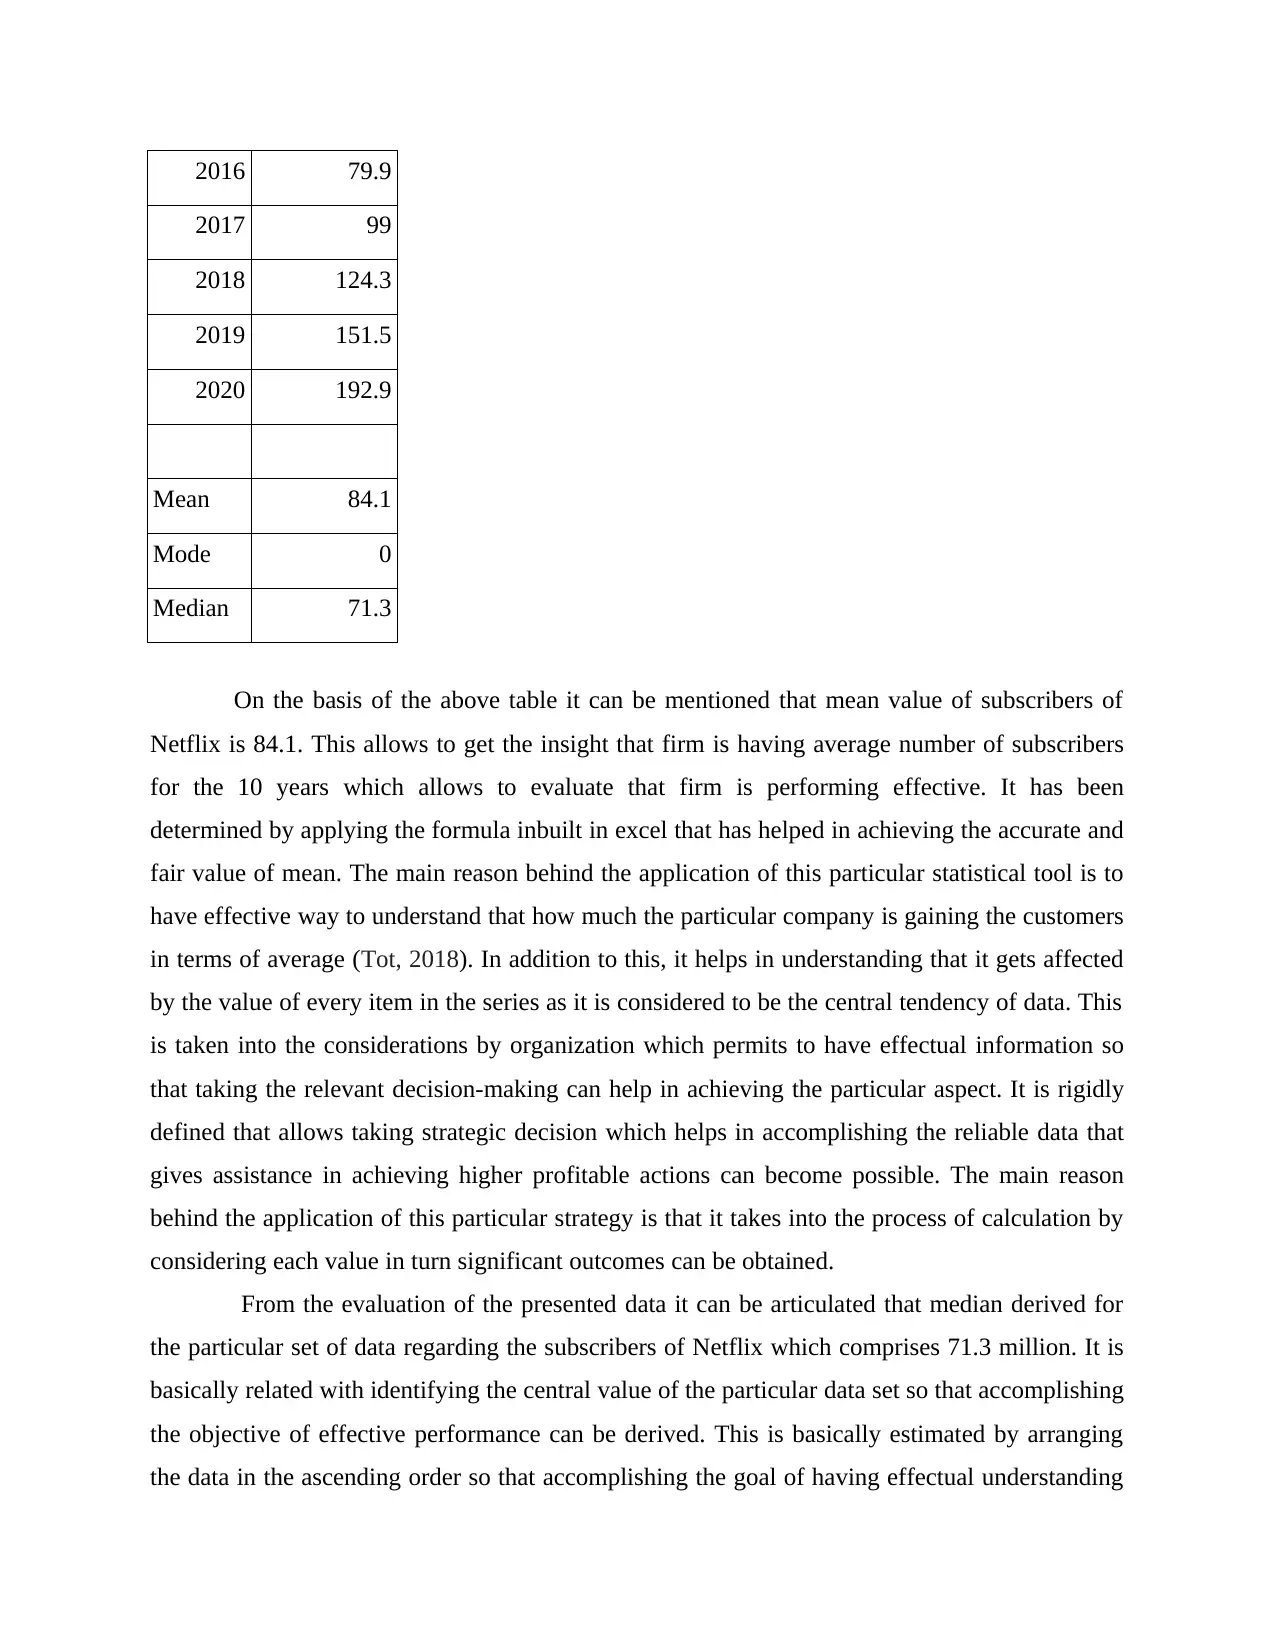
Presenting the chart
On the basis of the above chart it can be interpreted that there are different objectives of the
organization which shows that there is inclining of subscribers. It is helpful in gaining the
information that the particular company is having effective ability to increase its performance h
by giving emphasis on attaining the objective of good market share, greater revenue, higher
profits, etc. can be one in effective manner. With respect to the above presented chart it can be
mentored that Netflix having higher significant position to achieve competitiveness by covering
good market share which assist in analyzing the overall performance of firm. It gives ability to
recognize that how effectively it is performing as it is showing good level of efficiency of
effectiveness as it is reflecting increasing trend of performance. On the basis of this it can be
mentioned that Netflix is one of successful firm that is having effective performance as its
market share is j continuously increasing performance.
CONCLUSION
On the basis of the above report it can be mentioned that there are different kinds of the
ways in which data analysis can be done. It is important for the company to pay attention on
having the application of data evaluation via statistical tools as it helps in gathering accurate
information which can give assistance in making significant strategic decision. The current
study has given emphasis on having the application of mean, mode, median, etc. so that
significant decision making can become possible.
03/07/1905
04/07/1905
05/07/1905
06/07/1905
07/07/1905
08/07/1905
09/07/1905
10/07/1905
11/07/1905
12/07/1905
050100150200250
21.5 25.7 35.6 47.9 62.7 79.9 99
124.3
151.5
192.9
Subscribers (million)

⊘ This is a preview!⊘
Do you want full access?
Subscribe today to unlock all pages.
Trusted by 1+ million students worldwide
REFERENCES
Books and Journals
Caracara-Rios, M. and et.al., 2021. Statistical tools for a better optical model. Physical Review C.
104(6). p.064611.
Chatfield, C., 2018. Statistics for technology: a course in applied statistics. Routledge.
Hoerl, R.W. and Snee, R.D., 2020. Statistical thinking: Improving business performance. John
Wiley & Sons.
Merle, C.A., Annatto, R.A. and LaVenia, K.N., 2021. Advanced and multivariate statistical
methods: Practical application and interpretation. Routledge.
Ott, W.R., 2018. Environmental statistics and data analysis. Routledge.
Sachiko, B., 2022. SELECTING AND USING STATISTICAL TOOLS FOR DATA
ANALYSIS. MINNA JOURNAL OF EDUCATIONAL STUDIES. 7(1). pp.95-105
1 out of 10
Related Documents


Your All-in-One AI-Powered Toolkit for Academic Success.
+13062052269
info@desklib.com
Available 24*7 on WhatsApp / Email
![[object Object]](/_next/static/media/star-bottom.7253800d.svg)
Unlock your academic potential
Copyright © 2020–2026 A2Z Services. All Rights Reserved. Developed and managed by ZUCOL.