BA30589E: Netflix Subscriber Growth Analysis Using Statistics
VerifiedAdded on 2023/06/10
|10
|2412
|64
Report
AI Summary
This report provides an analysis of Netflix subscriber data from 2011 to 2020, employing statistical techniques such as mean, mode, and median to derive meaningful insights. The report begins with a presentation of raw subscriber data, followed by the application of statistical tools to calculate key metrics and understand central tendencies. Data manipulation techniques, including calculating averages, sums, counts, maximum, and minimum values, are used to further refine the analysis. The findings are visually represented through charts to illustrate subscriber growth trends over the decade. The report concludes that data insights are crucial for informed decision-making, highlighting the benefits of statistical techniques in understanding data patterns and making strategic business decisions for Netflix.

DHICT BA30589E
Assessment Brief 1
Assessment Brief 1
Paraphrase This Document
Need a fresh take? Get an instant paraphrase of this document with our AI Paraphraser
TABLE OF CONTENTS
INTRODUCTION ..........................................................................................................................1
Understanding of topic................................................................................................................1
MAIN BODY...................................................................................................................................1
Raw Data Presentation................................................................................................................1
Providing the application of Statistical Techniques...................................................................2
Presenting Data Manipulation.....................................................................................................4
Providing pictorial presentation of data with help of chart ........................................................6
CONCLUSION ...............................................................................................................................6
REFERENCES................................................................................................................................7
INTRODUCTION
Understanding of topic
Data is highly important for the purpose of taking the crucial decision so that significant
decision can be taken. The data becomes useful after analyzing it so that crucial insights about
its relevant & non reliable factor so that proper ability to identifying the major aspects for taking
decision can become possible. In the current era, it is important to possess the effective
information by application of data analysis technique so that evaluation of major aspects can be
exerted for having precise & relevant insights in turn higher informed action application
execution become possible. The main reason behind having the appropriate studying of data so
that more & accurate interpretation for accomplishing the information to recognizing the lacking
areas, its causes, impact, etc related information can be ascertained in more precise manner.
The current study is based on Netflix which is one of the international organization that
basically operates as American subscription steaming a service & production firm. There is
utilization of distribution deals for offering film & television series library. In addition to this, it
has its won production also that is highly famous as Netflix originals. The particular
organization tend to offer the significant entertainment service that has the higher demand in
market as subscribers are found to be all over the world. Recent report will pay attention on
having the significant information regarding the subscribers of the firm for the ten years so that
effective ability to evaluate its performance can be done. It will pay attention on presenting raw
data, execution of statistical tools, data manipulation and presenting data in pictorial form. ,
MAIN BODY
Raw Data Presentation
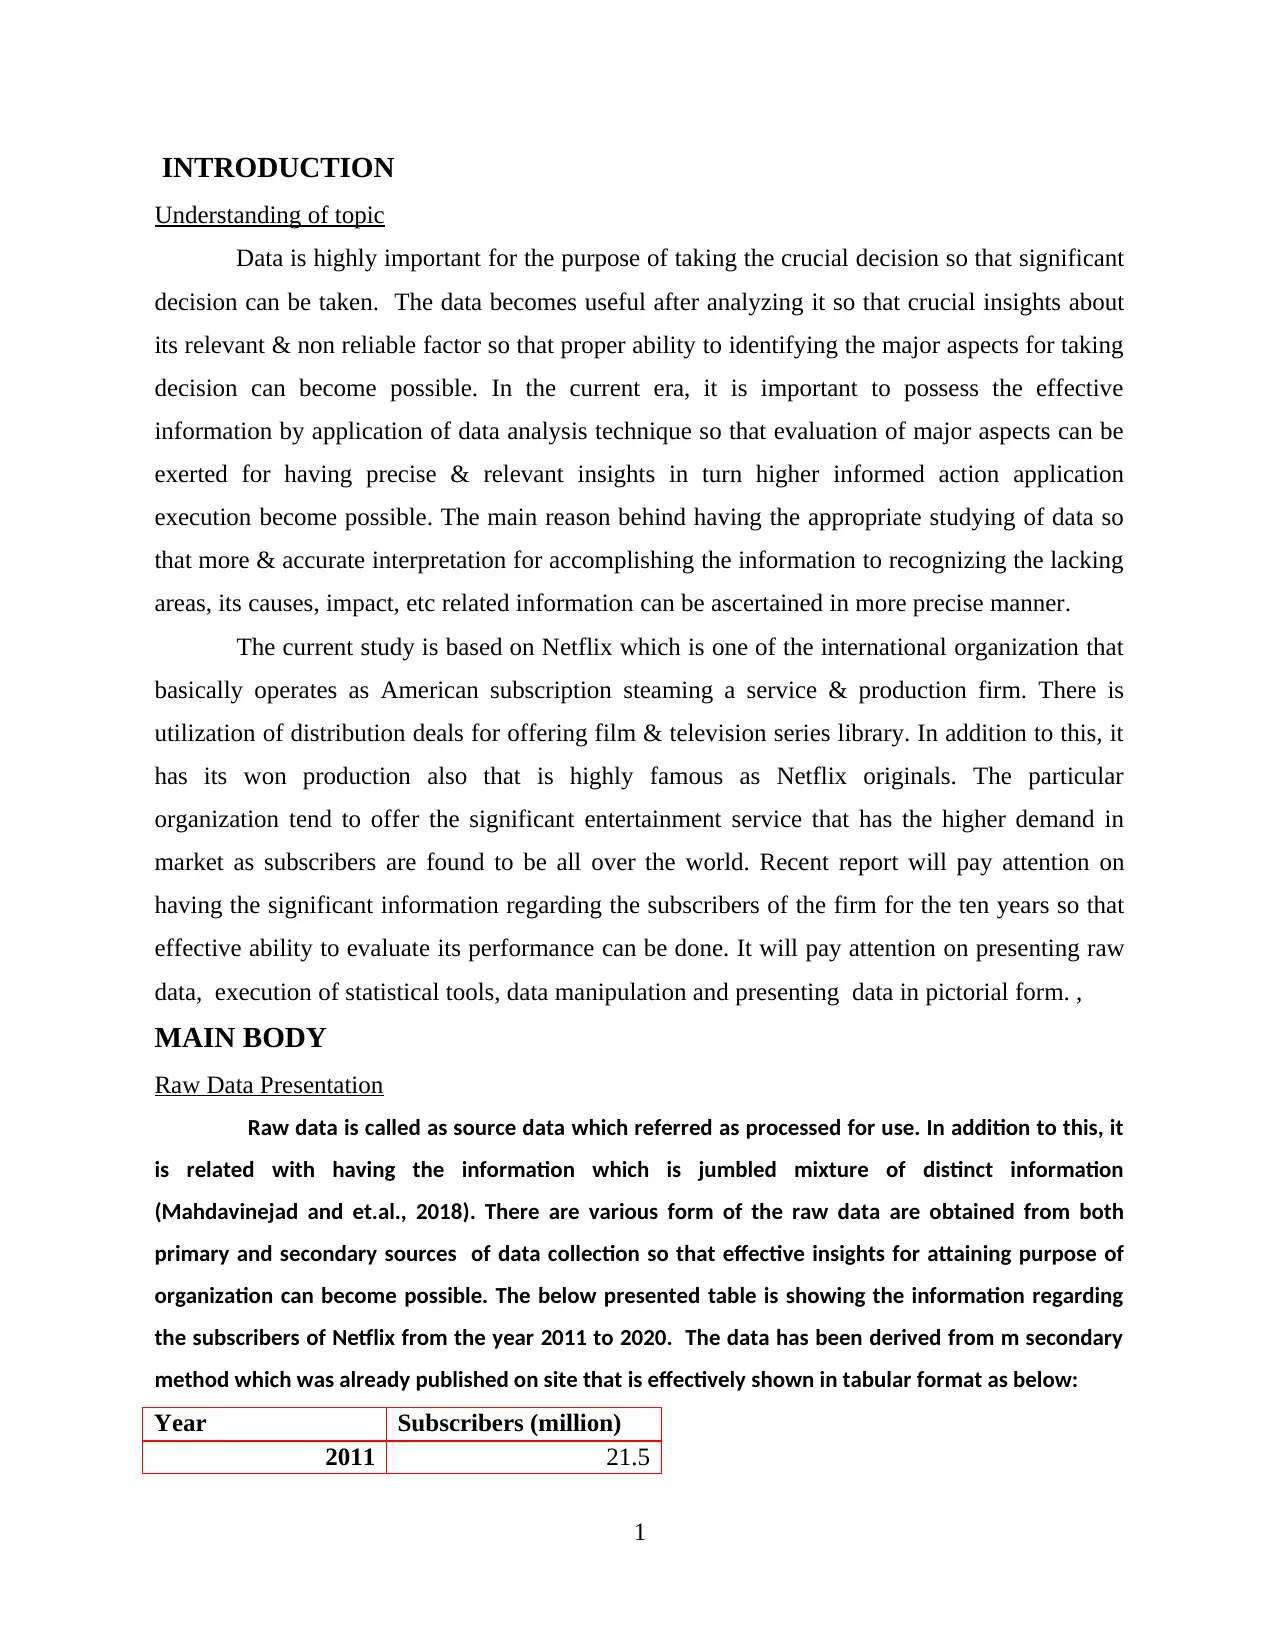
Raw data is called as source data which referred as processed for use. In addition to this, it
is related with having the information which is jumbled mixture of distinct information
(Mahdavinejad and et.al., 2018). There are various form of the raw data are obtained from both
primary and secondary sources of data collection so that effective insights for attaining purpose of
organization can become possible. The below presented table is showing the information regarding
the subscribers of Netflix from the year 2011 to 2020. The data has been derived from m secondary
method which was already published on site that is effectively shown in tabular format as below:
Year Subscribers (million)
2011 21.5
1
Understanding of topic
Data is highly important for the purpose of taking the crucial decision so that significant
decision can be taken. The data becomes useful after analyzing it so that crucial insights about
its relevant & non reliable factor so that proper ability to identifying the major aspects for taking
decision can become possible. In the current era, it is important to possess the effective
information by application of data analysis technique so that evaluation of major aspects can be
exerted for having precise & relevant insights in turn higher informed action application
execution become possible. The main reason behind having the appropriate studying of data so
that more & accurate interpretation for accomplishing the information to recognizing the lacking
areas, its causes, impact, etc related information can be ascertained in more precise manner.
The current study is based on Netflix which is one of the international organization that
basically operates as American subscription steaming a service & production firm. There is
utilization of distribution deals for offering film & television series library. In addition to this, it
has its won production also that is highly famous as Netflix originals. The particular
organization tend to offer the significant entertainment service that has the higher demand in
market as subscribers are found to be all over the world. Recent report will pay attention on
having the significant information regarding the subscribers of the firm for the ten years so that
effective ability to evaluate its performance can be done. It will pay attention on presenting raw
data, execution of statistical tools, data manipulation and presenting data in pictorial form. ,
MAIN BODY
Raw Data Presentation
Raw data is called as source data which referred as processed for use. In addition to this, it
is related with having the information which is jumbled mixture of distinct information
(Mahdavinejad and et.al., 2018). There are various form of the raw data are obtained from both
primary and secondary sources of data collection so that effective insights for attaining purpose of
organization can become possible. The below presented table is showing the information regarding
the subscribers of Netflix from the year 2011 to 2020. The data has been derived from m secondary
method which was already published on site that is effectively shown in tabular format as below:
Year Subscribers (million)
2011 21.5
1
⊘ This is a preview!⊘
Do you want full access?
Subscribe today to unlock all pages.
Trusted by 1+ million students worldwide
2012 25.7
2013 35.6
2014 47.9
2015 62.7
2016 79.9
2017 99
2018 124.3
2019 151.5
2020 192.9
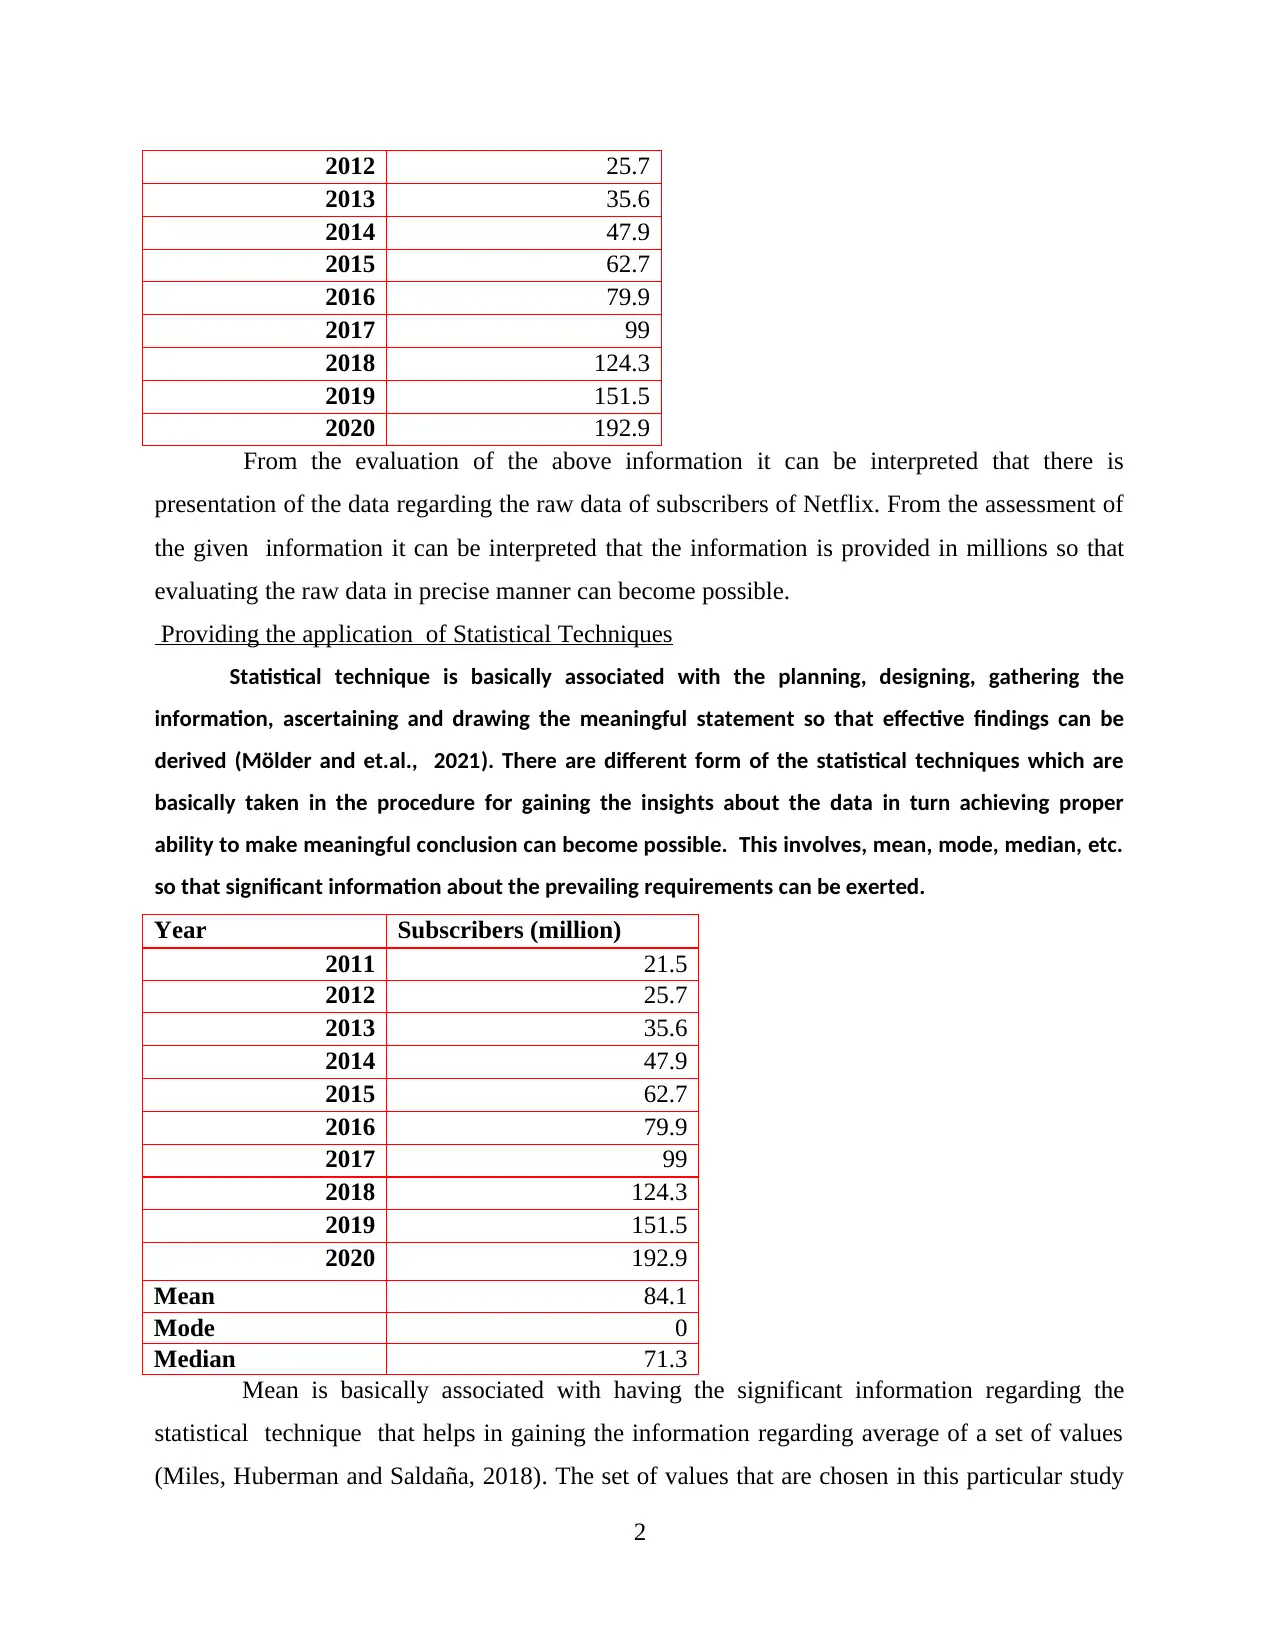
From the evaluation of the above information it can be interpreted that there is
presentation of the data regarding the raw data of subscribers of Netflix. From the assessment of
the given information it can be interpreted that the information is provided in millions so that
evaluating the raw data in precise manner can become possible.
Providing the application of Statistical Techniques
Statistical technique is basically associated with the planning, designing, gathering the
information, ascertaining and drawing the meaningful statement so that effective findings can be
derived (Mölder and et.al., 2021). There are different form of the statistical techniques which are
basically taken in the procedure for gaining the insights about the data in turn achieving proper
ability to make meaningful conclusion can become possible. This involves, mean, mode, median, etc.
so that significant information about the prevailing requirements can be exerted.
Year Subscribers (million)
2011 21.5
2012 25.7
2013 35.6
2014 47.9
2015 62.7
2016 79.9
2017 99
2018 124.3
2019 151.5
2020 192.9
Mean 84.1
Mode 0
Median 71.3
Mean is basically associated with having the significant information regarding the
statistical technique that helps in gaining the information regarding average of a set of values
(Miles, Huberman and Saldaña, 2018). The set of values that are chosen in this particular study
2
2013 35.6
2014 47.9
2015 62.7
2016 79.9
2017 99
2018 124.3
2019 151.5
2020 192.9
From the evaluation of the above information it can be interpreted that there is
presentation of the data regarding the raw data of subscribers of Netflix. From the assessment of
the given information it can be interpreted that the information is provided in millions so that
evaluating the raw data in precise manner can become possible.
Providing the application of Statistical Techniques
Statistical technique is basically associated with the planning, designing, gathering the
information, ascertaining and drawing the meaningful statement so that effective findings can be
derived (Mölder and et.al., 2021). There are different form of the statistical techniques which are
basically taken in the procedure for gaining the insights about the data in turn achieving proper
ability to make meaningful conclusion can become possible. This involves, mean, mode, median, etc.
so that significant information about the prevailing requirements can be exerted.
Year Subscribers (million)
2011 21.5
2012 25.7
2013 35.6
2014 47.9
2015 62.7
2016 79.9
2017 99
2018 124.3
2019 151.5
2020 192.9
Mean 84.1
Mode 0
Median 71.3
Mean is basically associated with having the significant information regarding the
statistical technique that helps in gaining the information regarding average of a set of values
(Miles, Huberman and Saldaña, 2018). The set of values that are chosen in this particular study
2
Paraphrase This Document
Need a fresh take? Get an instant paraphrase of this document with our AI Paraphraser
is subscribers that are shown in millions for the 10 years receptively. The mean has been
computed by using the excel function such as =average( number of array) which has output of
84.1 million. This shows that there average number of subscribers of million of 84.1 which is
showing the good performance of Netflix. There are different form of the benefits which can be
derived by using the particular statistical technique that includes simple to understand &
interpret. This is affected by h the value of every item in series that is found to be reliable so
that taking decision on the basis of this can be done to obtain the reliable position in market. The
organization with help of mean statistical technique so that making quantitative decision about
the processes can be taken.
Modes statistical tool is basically taken into the process which provides the assistance
in having the information regarding the number of times the particular frequency has repeated
(Kronthaler, 2022). With help of this particular technique the users can obtained various
advantages that includes that involves informing the firm to get the most common value in
categorized data h so that h idea of crucial information that can help in achieving mots repetitive
efforts exerted by firm can be evaluated. From the assessment of the provided information it can
be mentioned that there is application of excel function of mode has been taken into practice. It
can depicted that organization is not having the no repeatability performance which shows that
there is no mode value of the subscribers in this particular case it can be mentioned that there is
no same level of efforts for grabbing the equivalent amount of subscribers is paid by Netflix.
This helps in assessing that there is any kind of improvement in its overall course of action is
exerted by firm or not. On the basis of the mode statistical technique it can be mentioned that
organization has exerted modified form of the action of gaining subscribers.
Median is related with having the information about the central value of the given data
so that significant information regarding the provided data can be identified. With help of the
median value, there are various course of action can be taken into the procedure which helps in
arranging data in ascending order. There are distinct form of the advantages which can be
achieved by the user of median statistical technique which include not being influenced from the
extreme value, having easy method to get the crucial information, etc. In addition to this,
possessing ability to compare the median to mean for having the effectual idea of distribution of
data set, etc. From the calculation of the provided information it can be mentioned that there is
median value of 71.3 million. By comparing the mean and median it can be interpreted that
3
there is distinct value of mean and media which depicts that the presented data set is less or more
evenly distributed from m the lowest to the highest value.
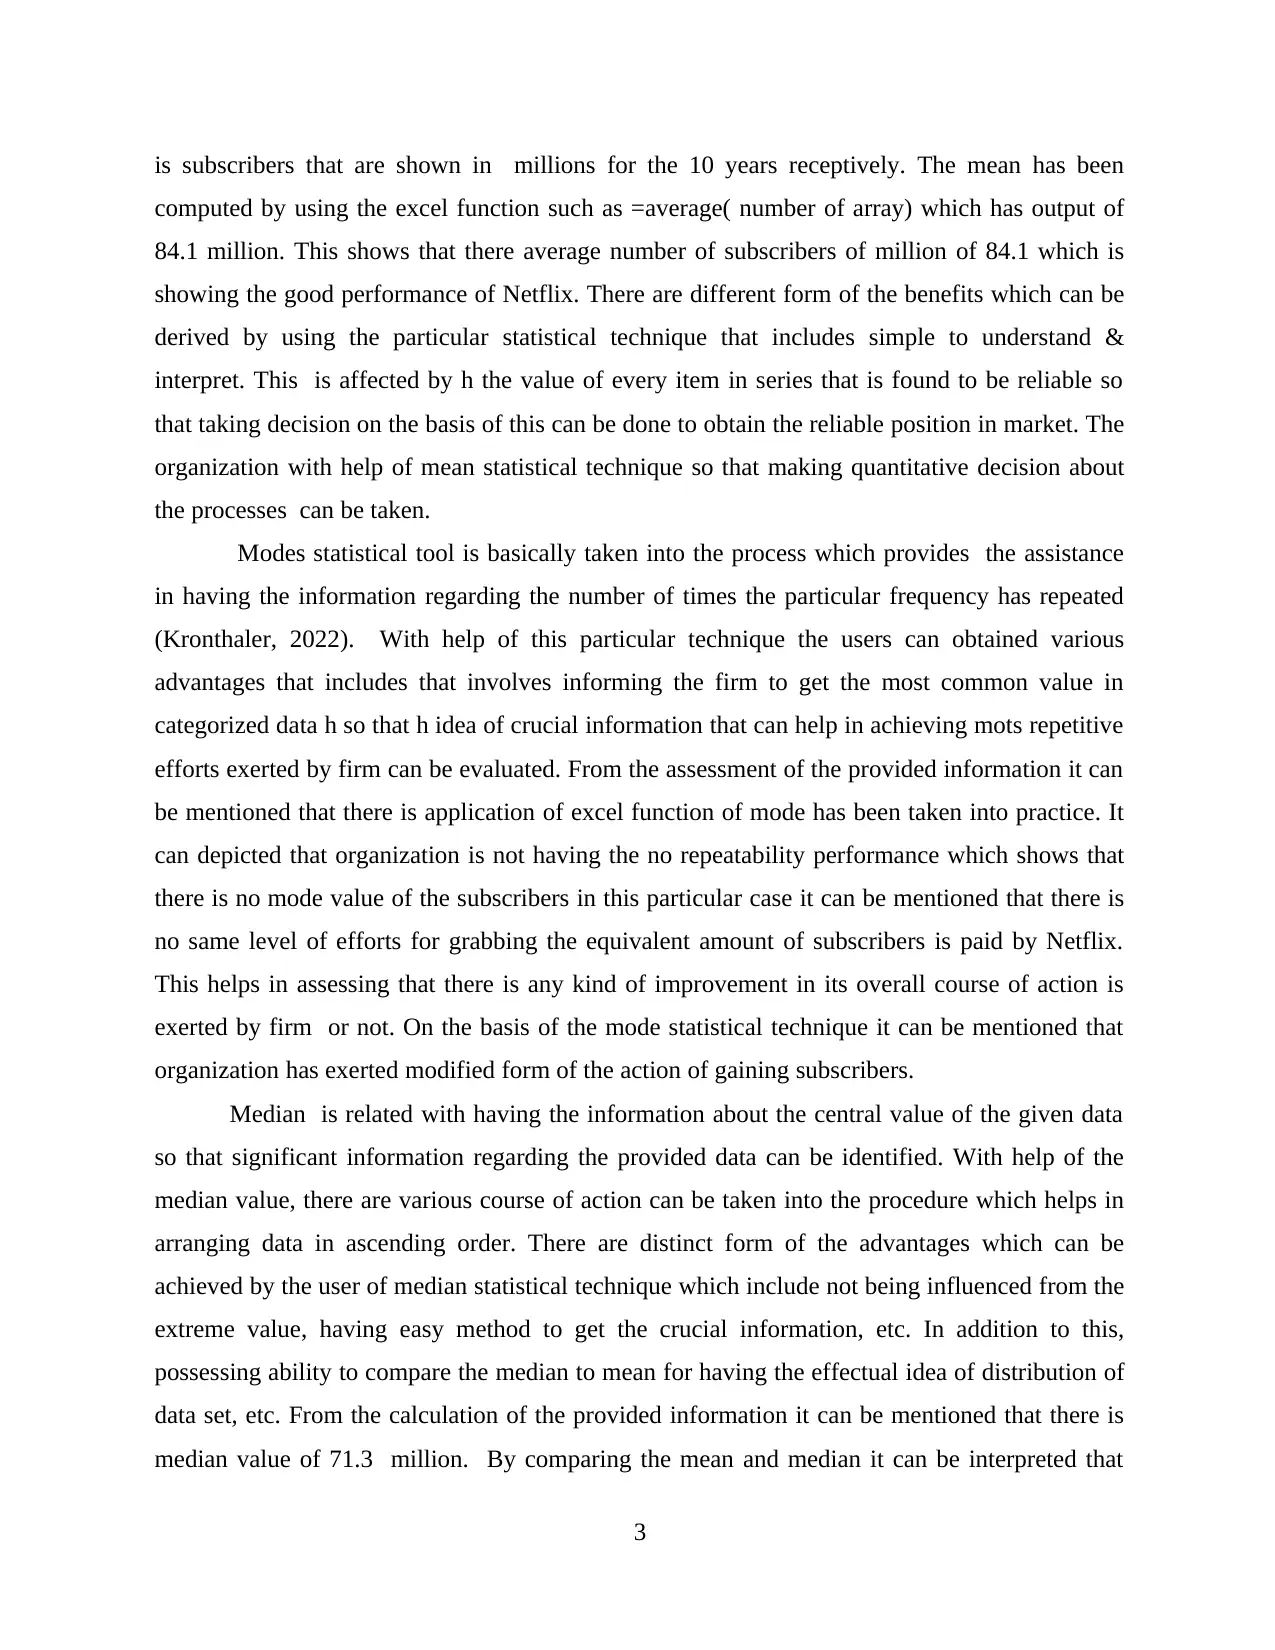
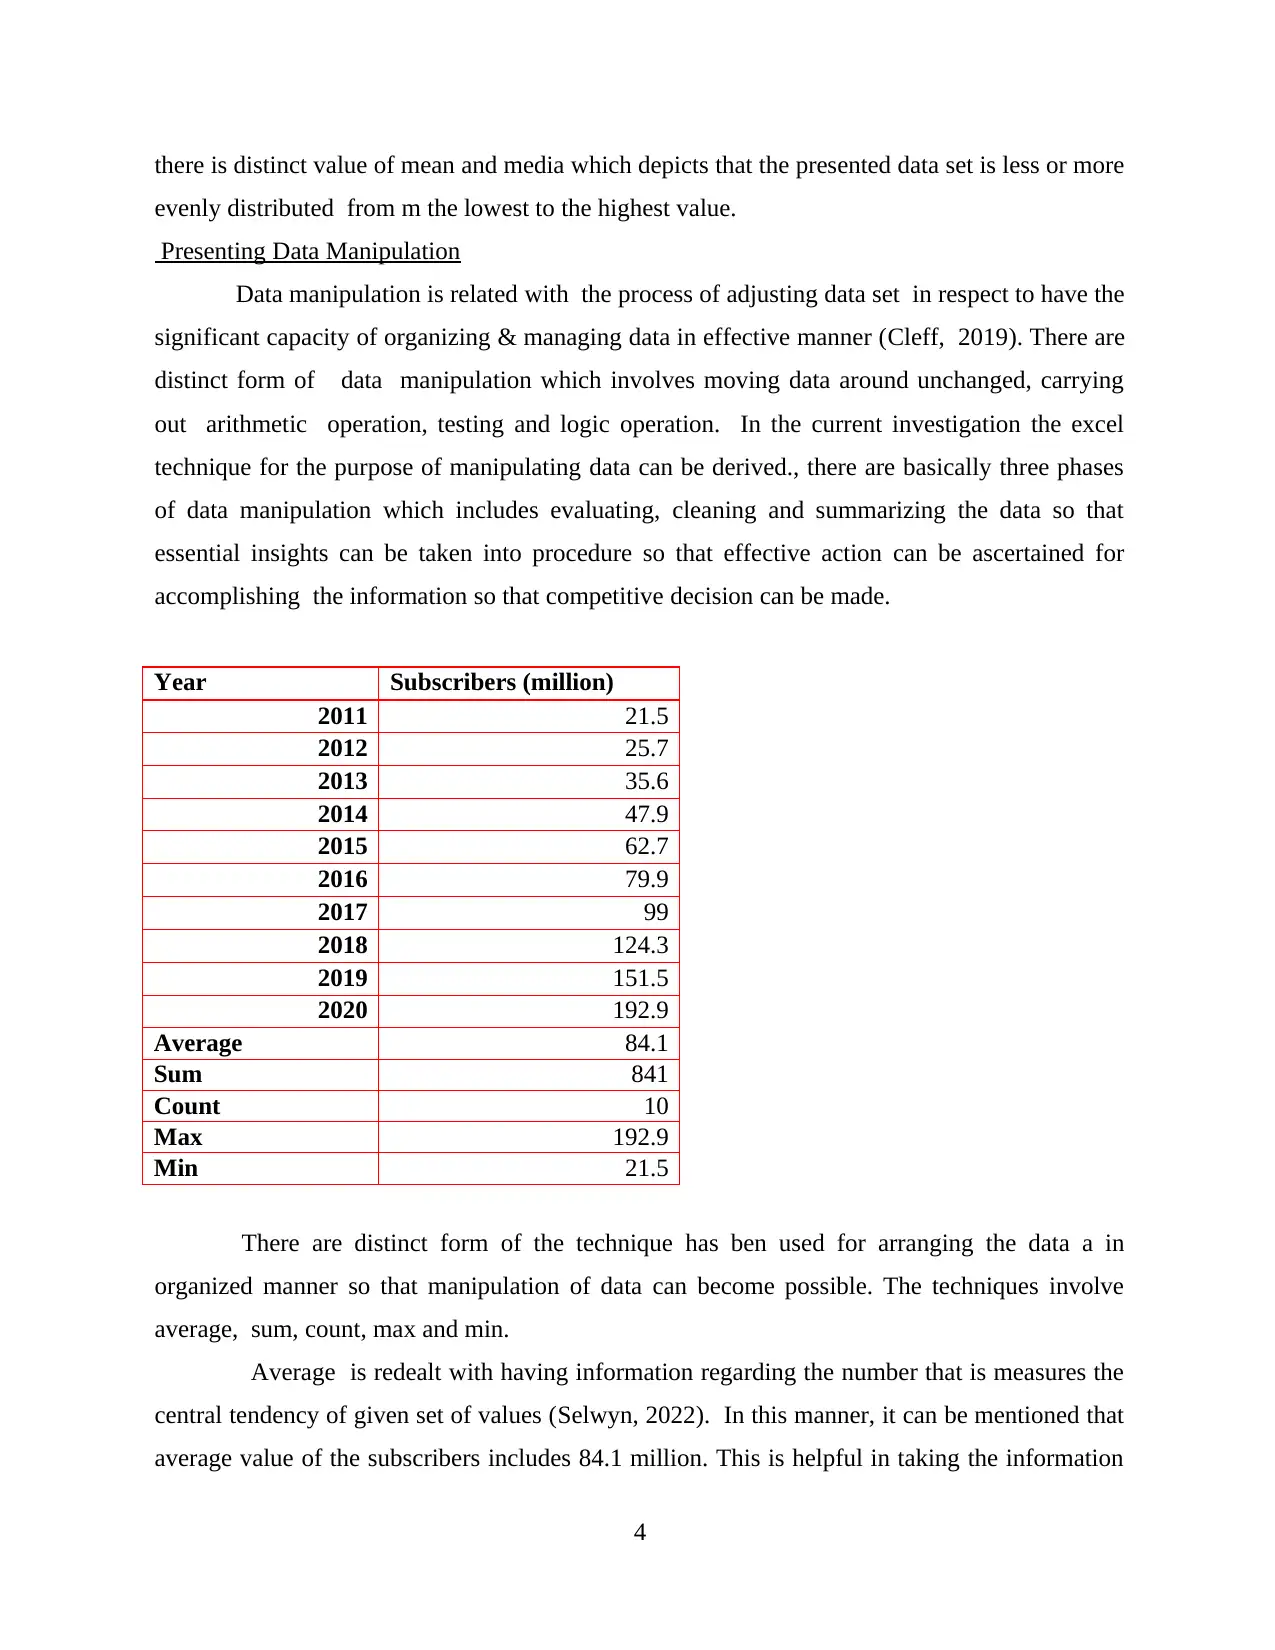
Presenting Data Manipulation
Data manipulation is related with the process of adjusting data set in respect to have the
significant capacity of organizing & managing data in effective manner (Cleff, 2019). There are
distinct form of data manipulation which involves moving data around unchanged, carrying
out arithmetic operation, testing and logic operation. In the current investigation the excel
technique for the purpose of manipulating data can be derived., there are basically three phases
of data manipulation which includes evaluating, cleaning and summarizing the data so that
essential insights can be taken into procedure so that effective action can be ascertained for
accomplishing the information so that competitive decision can be made.
Year Subscribers (million)
2011 21.5
2012 25.7
2013 35.6
2014 47.9
2015 62.7
2016 79.9
2017 99
2018 124.3
2019 151.5
2020 192.9
Average 84.1
Sum 841
Count 10
Max 192.9
Min 21.5
There are distinct form of the technique has ben used for arranging the data a in
organized manner so that manipulation of data can become possible. The techniques involve
average, sum, count, max and min.
Average is redealt with having information regarding the number that is measures the
central tendency of given set of values (Selwyn, 2022). In this manner, it can be mentioned that
average value of the subscribers includes 84.1 million. This is helpful in taking the information
4
evenly distributed from m the lowest to the highest value.
Presenting Data Manipulation
Data manipulation is related with the process of adjusting data set in respect to have the
significant capacity of organizing & managing data in effective manner (Cleff, 2019). There are
distinct form of data manipulation which involves moving data around unchanged, carrying
out arithmetic operation, testing and logic operation. In the current investigation the excel
technique for the purpose of manipulating data can be derived., there are basically three phases
of data manipulation which includes evaluating, cleaning and summarizing the data so that
essential insights can be taken into procedure so that effective action can be ascertained for
accomplishing the information so that competitive decision can be made.
Year Subscribers (million)
2011 21.5
2012 25.7
2013 35.6
2014 47.9
2015 62.7
2016 79.9
2017 99
2018 124.3
2019 151.5
2020 192.9
Average 84.1
Sum 841
Count 10
Max 192.9
Min 21.5
There are distinct form of the technique has ben used for arranging the data a in
organized manner so that manipulation of data can become possible. The techniques involve
average, sum, count, max and min.
Average is redealt with having information regarding the number that is measures the
central tendency of given set of values (Selwyn, 2022). In this manner, it can be mentioned that
average value of the subscribers includes 84.1 million. This is helpful in taking the information
4
⊘ This is a preview!⊘
Do you want full access?
Subscribe today to unlock all pages.
Trusted by 1+ million students worldwide
based decision so that effective insights about the prevailing performance can be derived. On
the basis of the provided information it can be mentioned that particular organization is
possessing average s subscribers of 84.1 million.
Sum is related with total of the number of subscribers obtained for the tend mentioned
year such as from 2011 to 2020. this is related with using the auto sum function of excel which
helps in gaining the total of provided data set. On the basis of the provided data set it can be
mentioned that particular firm such as Netflix is having total number of subscribers is 841
million. This is helpful in identifying that there is requirement of this to ascertain the overall
performance of organization in turn effective decision by gaining ability to compare with
competitors so that significant insights can be achieved.
Count function to get the number of entries in number field that is in a range of array
of numbers (Becker and Gould,2019). This is useful in gaining the information regarding the
number of observation which are taking into the procedure for having effective insights. On the
basis of this, it can b interpreted that there is application of formula such as = count(number of
array) which has provided the results such as 10. The reason behind the 10 count is that there is
selection of year which involves 2011 to 2020.
Max function in excel that shows the highest value in the provided data set so that
effective insights about the prevailing performance can be achieved. From the assessment of the
provided data set it can be mentioned that particular case is possessing max value of 192.9
million. This has been derived by applying the formula such as = max( number of array). This
provides the assistance in gaining the information regarding the prevailing highest number of
subscribers so that standard for potential outcome can be achieved.
Min function of excel helps in gaining the information that which is the lowest value
from the given data set. It provides assistance in ascertaining information that 21.5 million is
derived. On the basis of this, it can be interpreted that this is the lowest outcome which is
required to be improved.
5
Paraphrase This Document
Need a fresh take? Get an instant paraphrase of this document with our AI Paraphraser
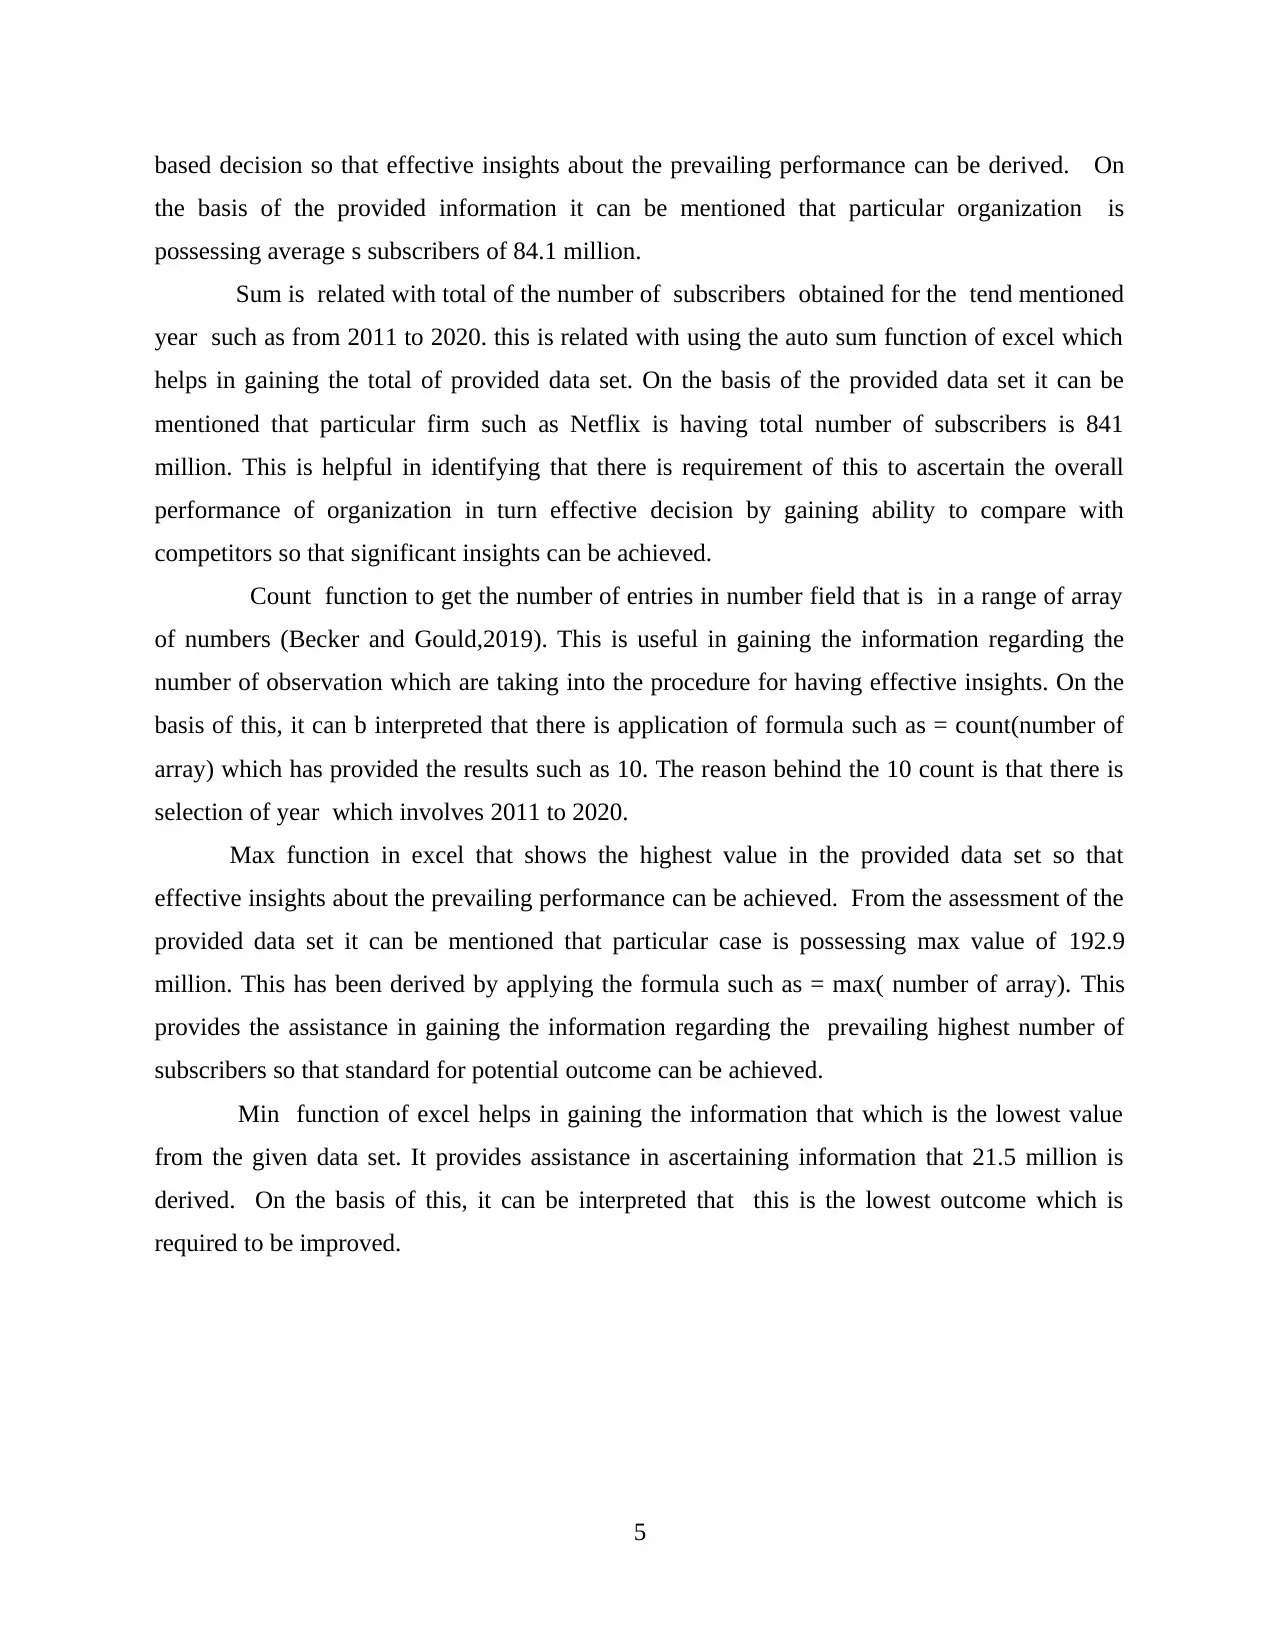
Providing pictorial presentation of data with help of chart
From the evaluation of the provide chart it can be mentioned that there are different
number of the subscribers in each year. There is significant upward moving trend is found which
is depicting that Netflix in the current era is having effective performance as compared to
previous. On the basis of this it can be mentioned that organization has given higher level of
efforts in attaining the greater customers so that accomplishing the leading position in market
has become possible. Higher level of insights to get the ability to make strategy for achieving
information which can aid in makings signifiant action can be ascertained by using this
particular chart.
CONCLUSION
From the above report it can be summarized that data insights are crucial for having the
effective information based decision-making. The current study has given emphasis on having
the tabular presentation of raw data. This has given emphasis on having the application of
statistical technique that includes mean, mode and median. This has given emphasis on having
the information that there are various benefits of using this statistic technique so that attaining
crucial insights for ascertaining details of average, repeated and central tendency possessing
value. These are helpful in making the crucial decision so that effective information for making
business decision can become possible. In addition to this, it has given emphasis on having the
information regarding the manipulation of data by using average, max, min, etc. in turn details
from the organized data has been derived from the selected technique. There is graphical
6

presentation of the subscribers which is showing that particular firm is having inclining trend of
performance .
7
performance .
7
⊘ This is a preview!⊘
Do you want full access?
Subscribe today to unlock all pages.
Trusted by 1+ million students worldwide
REFERENCES
Books and Journals
Becker, L.T. and Gould, E.M., 2019. Microsoft power BI: extending excel to manipulate,
analyze, and visualize diverse data. Serials Review. 45(3). pp.184-188.
Cleff, T., 2019. Applied statistics and multivariate data analysis for business and economics (pp.
433-441). Cham, Switzerland: Springer International Publishing.
Kronthaler, F., 2022. Statistics Applied With Excel: Data Analysis Is (Not) an Art. Springer
Berlin.
Mahdavinejad, M.S. And et.al., 2018. Machine learning for Internet of Things data analysis: A
survey. Digital Communications and Networks. 4(3). pp.161-175.
Miles, M.B., Huberman, A.M. and Saldaña, J., 2018. Qualitative data analysis: A methods
sourcebook. Sage publications.
Mölder, F. and et.al., 2021. Sustainable data analysis with Snakemake. F1000Research. 10.
Selwyn, N., 2022. ‘Just playing around with Excel and pivot tables’-the realities of data-driven
schooling. Research Papers in Education. 37(1). pp.95-114.
8
1 out of 10
Related Documents


Your All-in-One AI-Powered Toolkit for Academic Success.
+13062052269
info@desklib.com
Available 24*7 on WhatsApp / Email
![[object Object]](/_next/static/media/star-bottom.7253800d.svg)
Unlock your academic potential
Copyright © 2020–2026 A2Z Services. All Rights Reserved. Developed and managed by ZUCOL.