Network Performance Analysis Report for BN208 Networked Applications

Verified

Added on  2023/06/03

|15
|1632
|240
Report
AI Summary
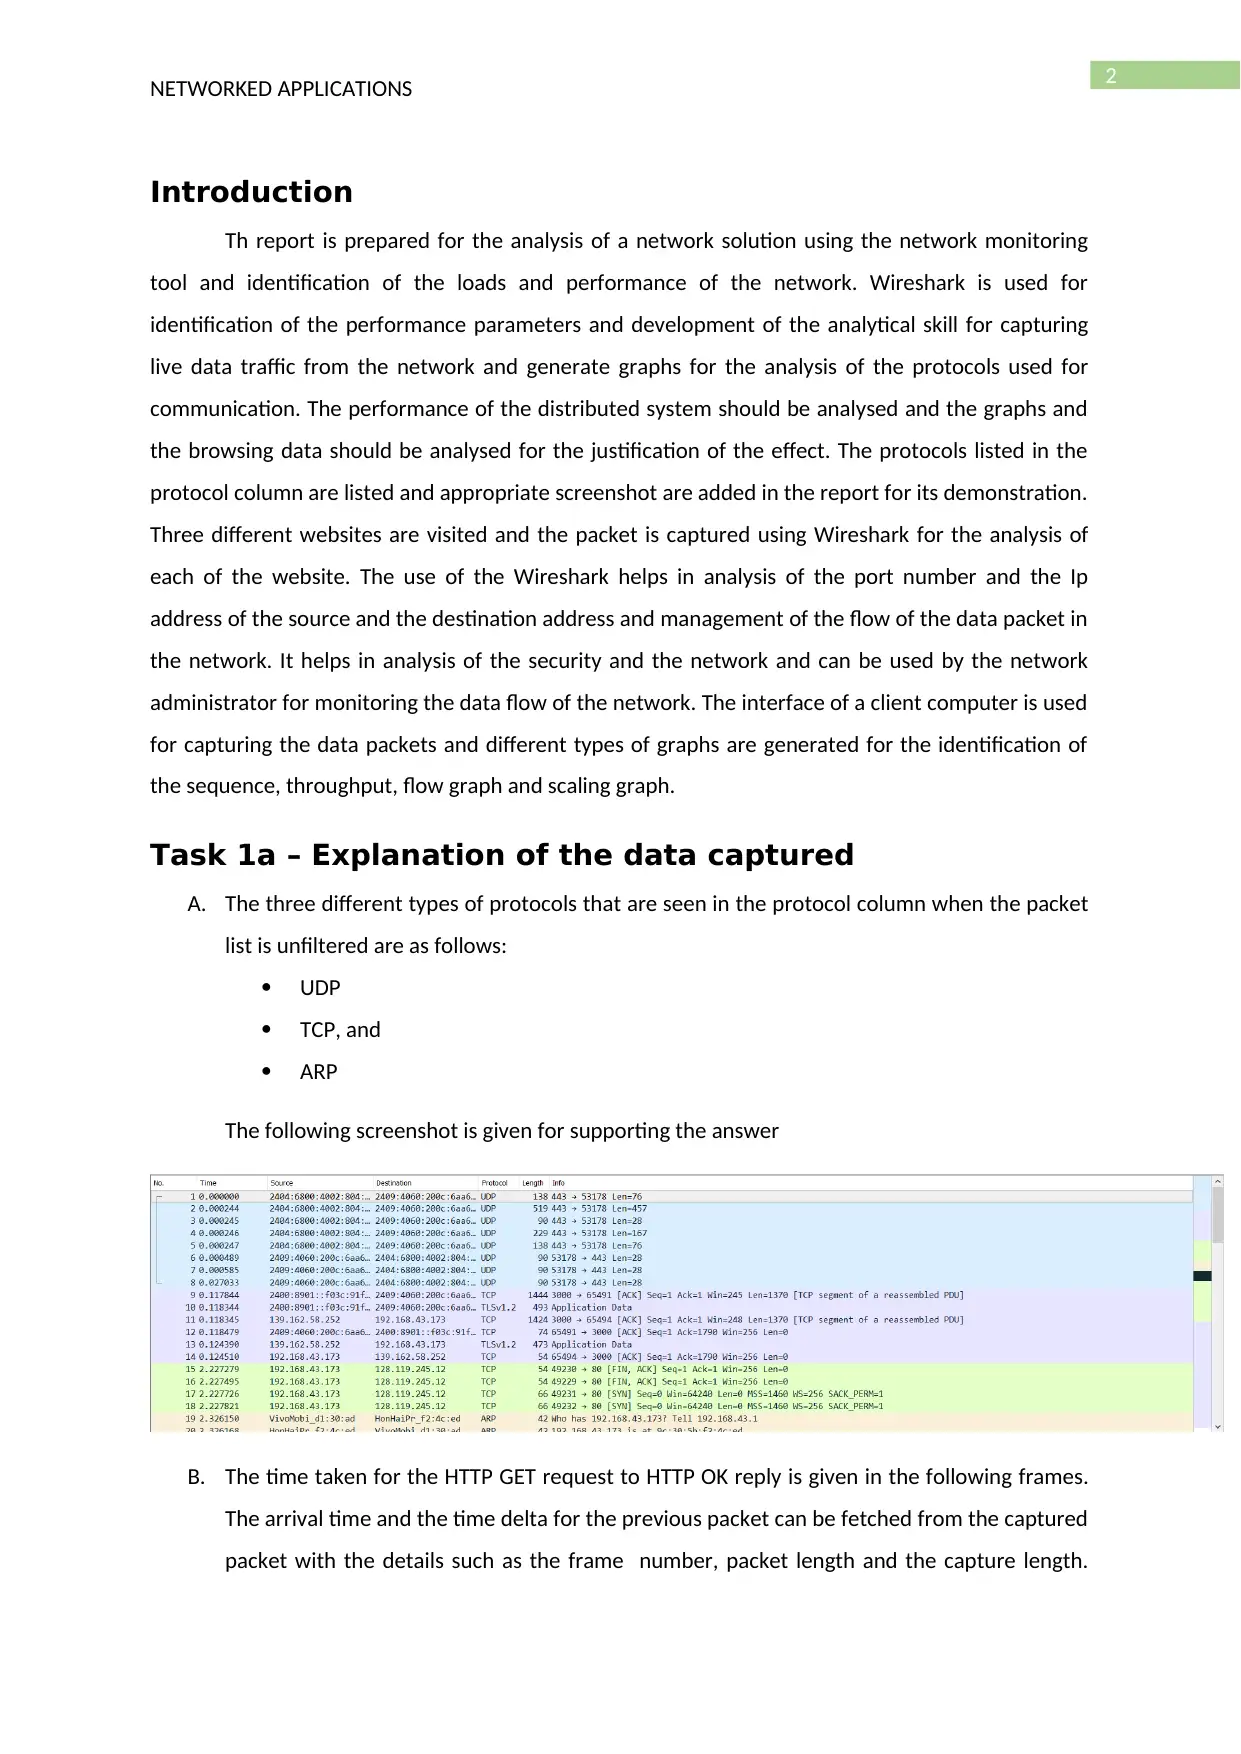
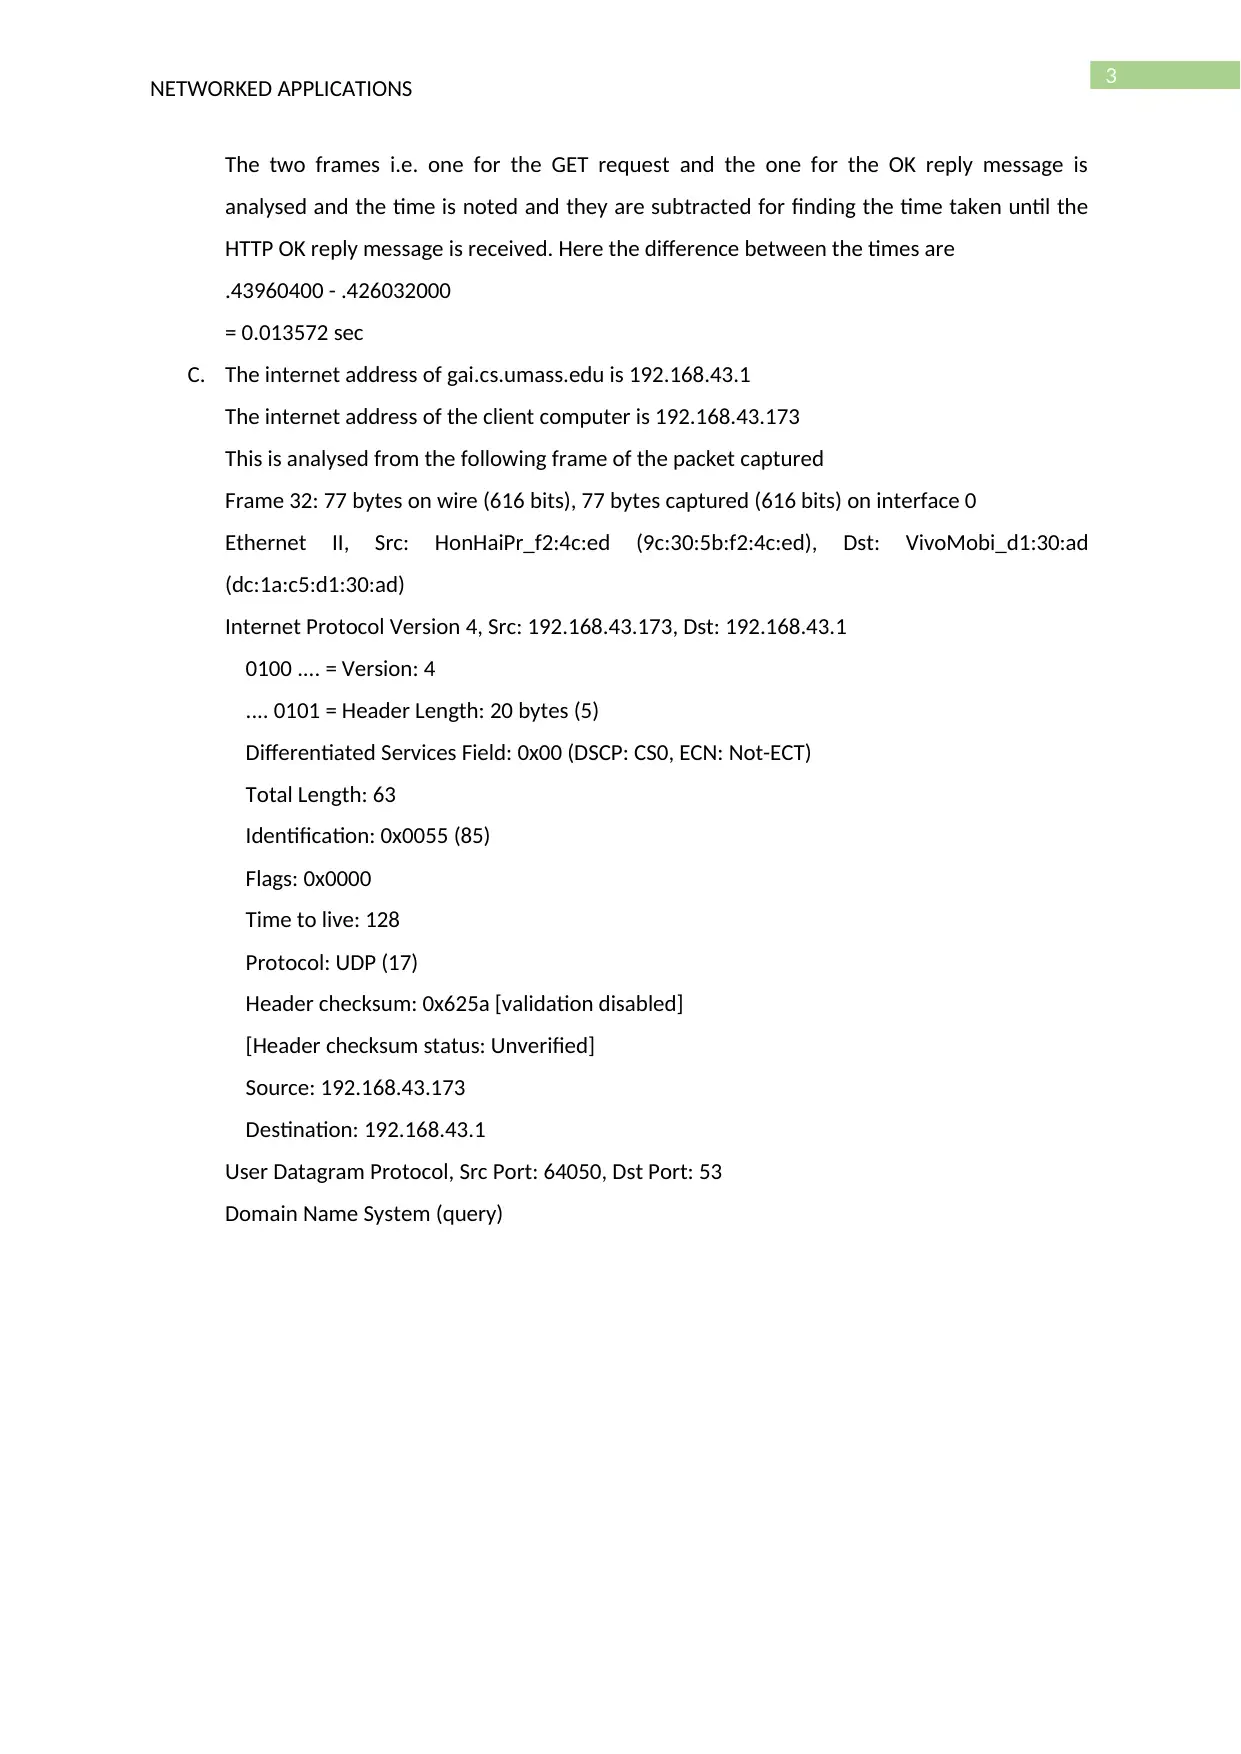
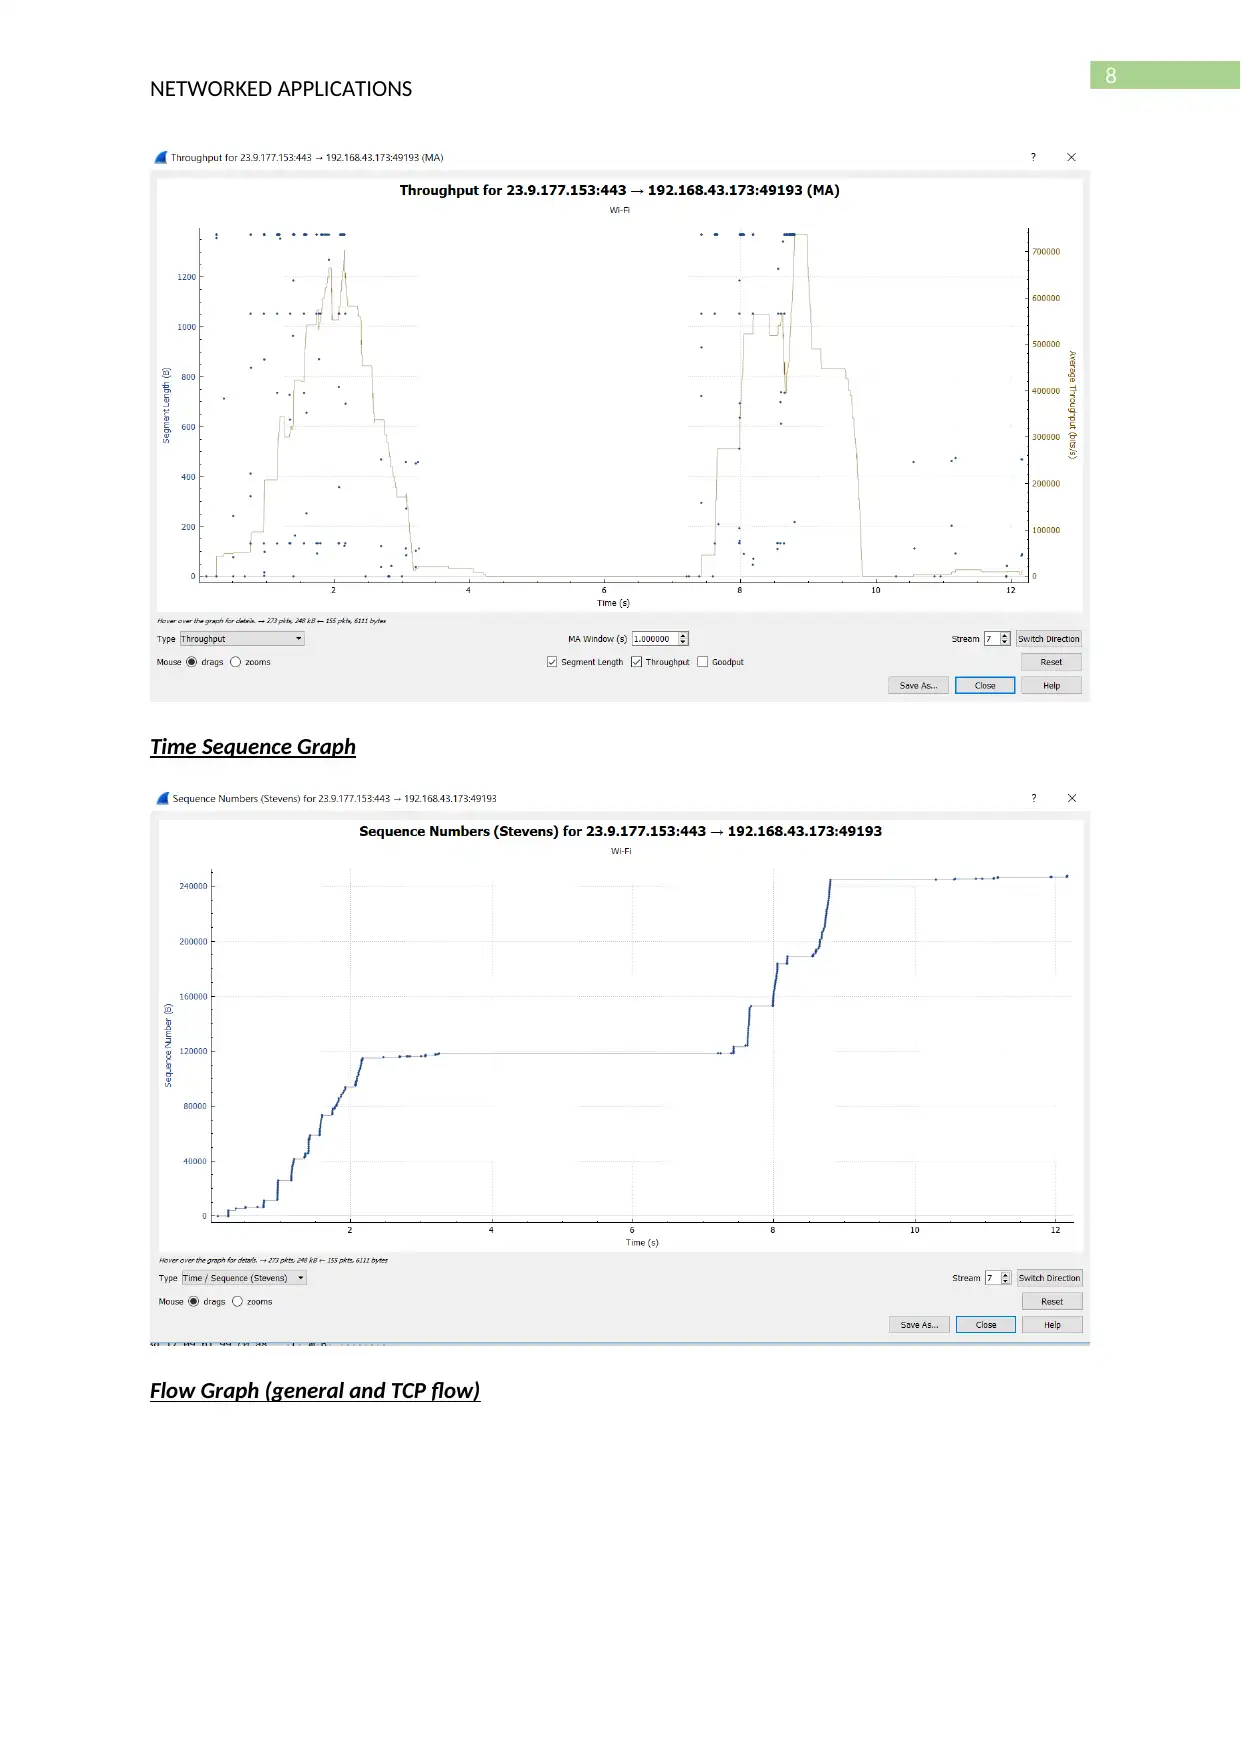
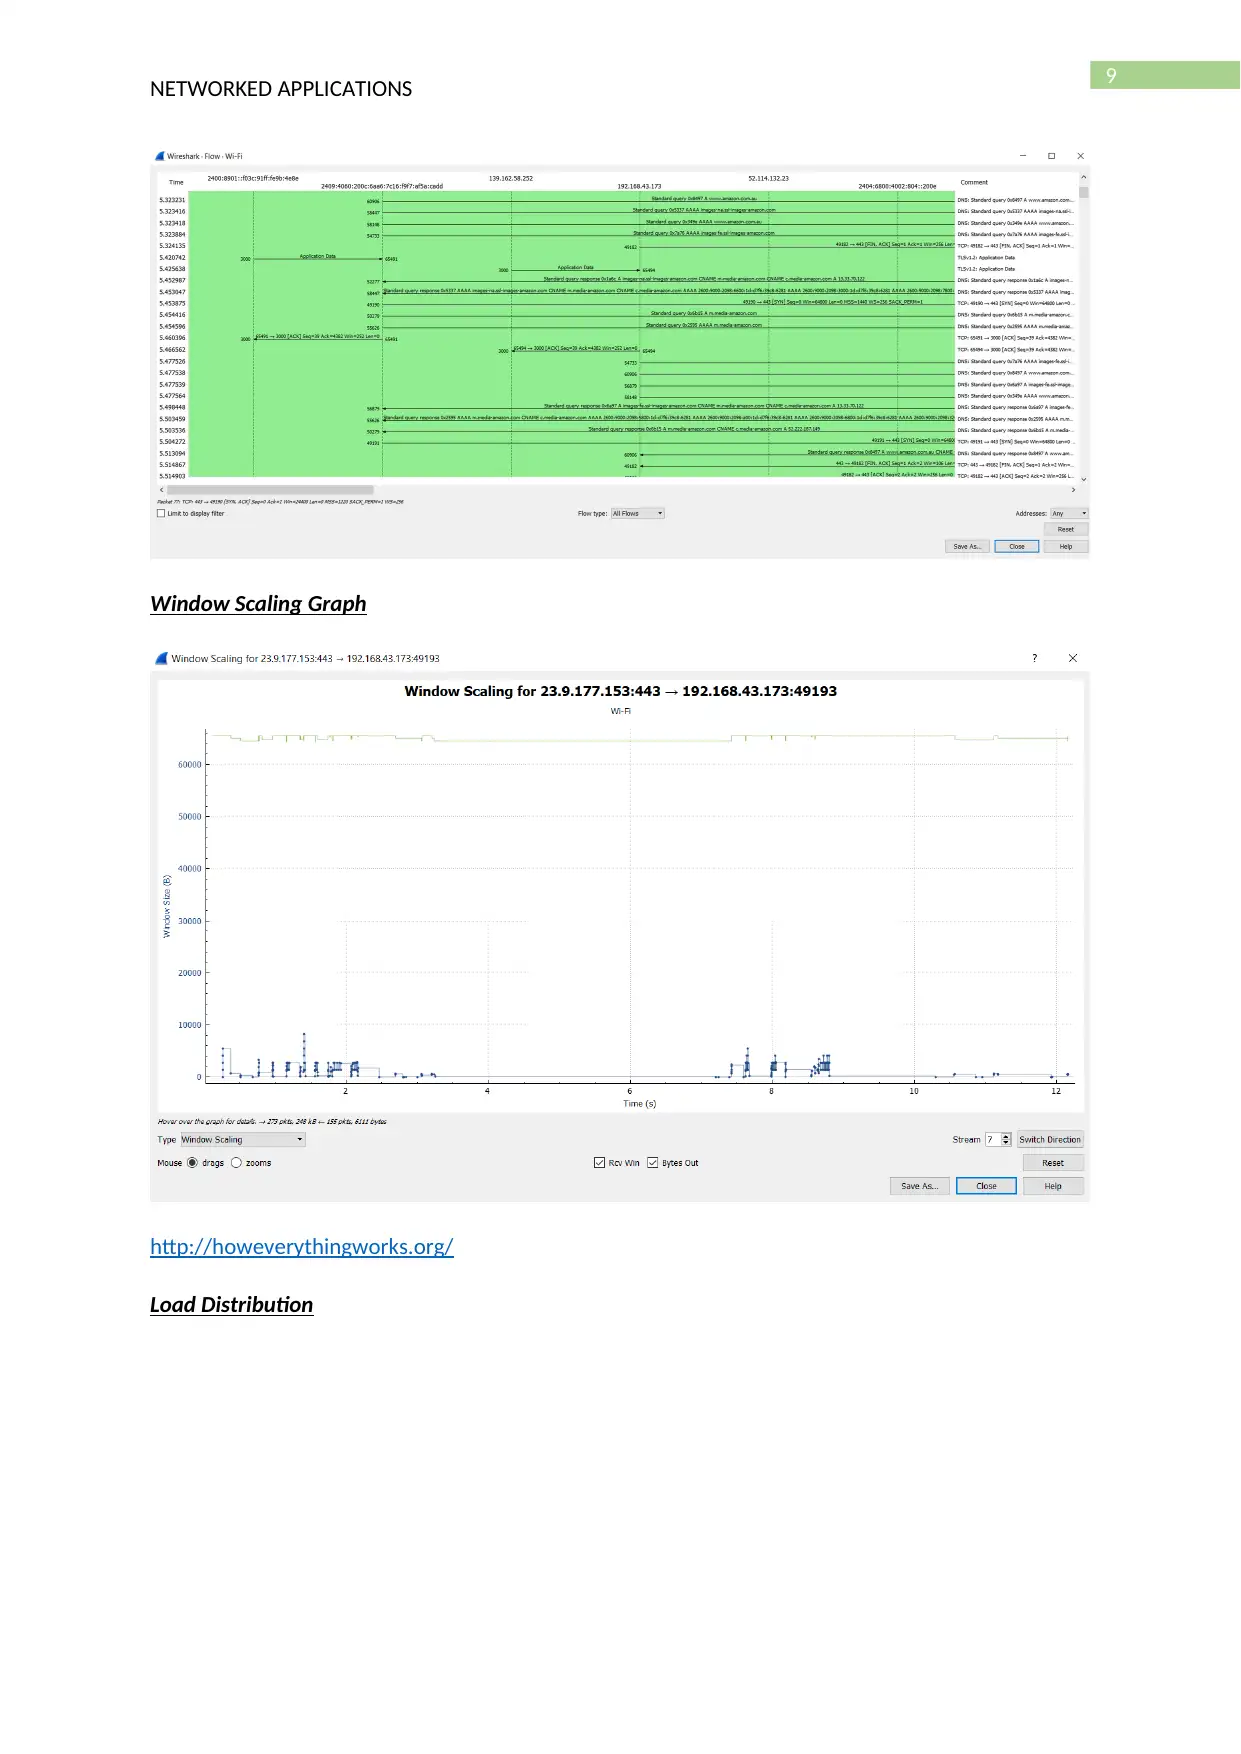
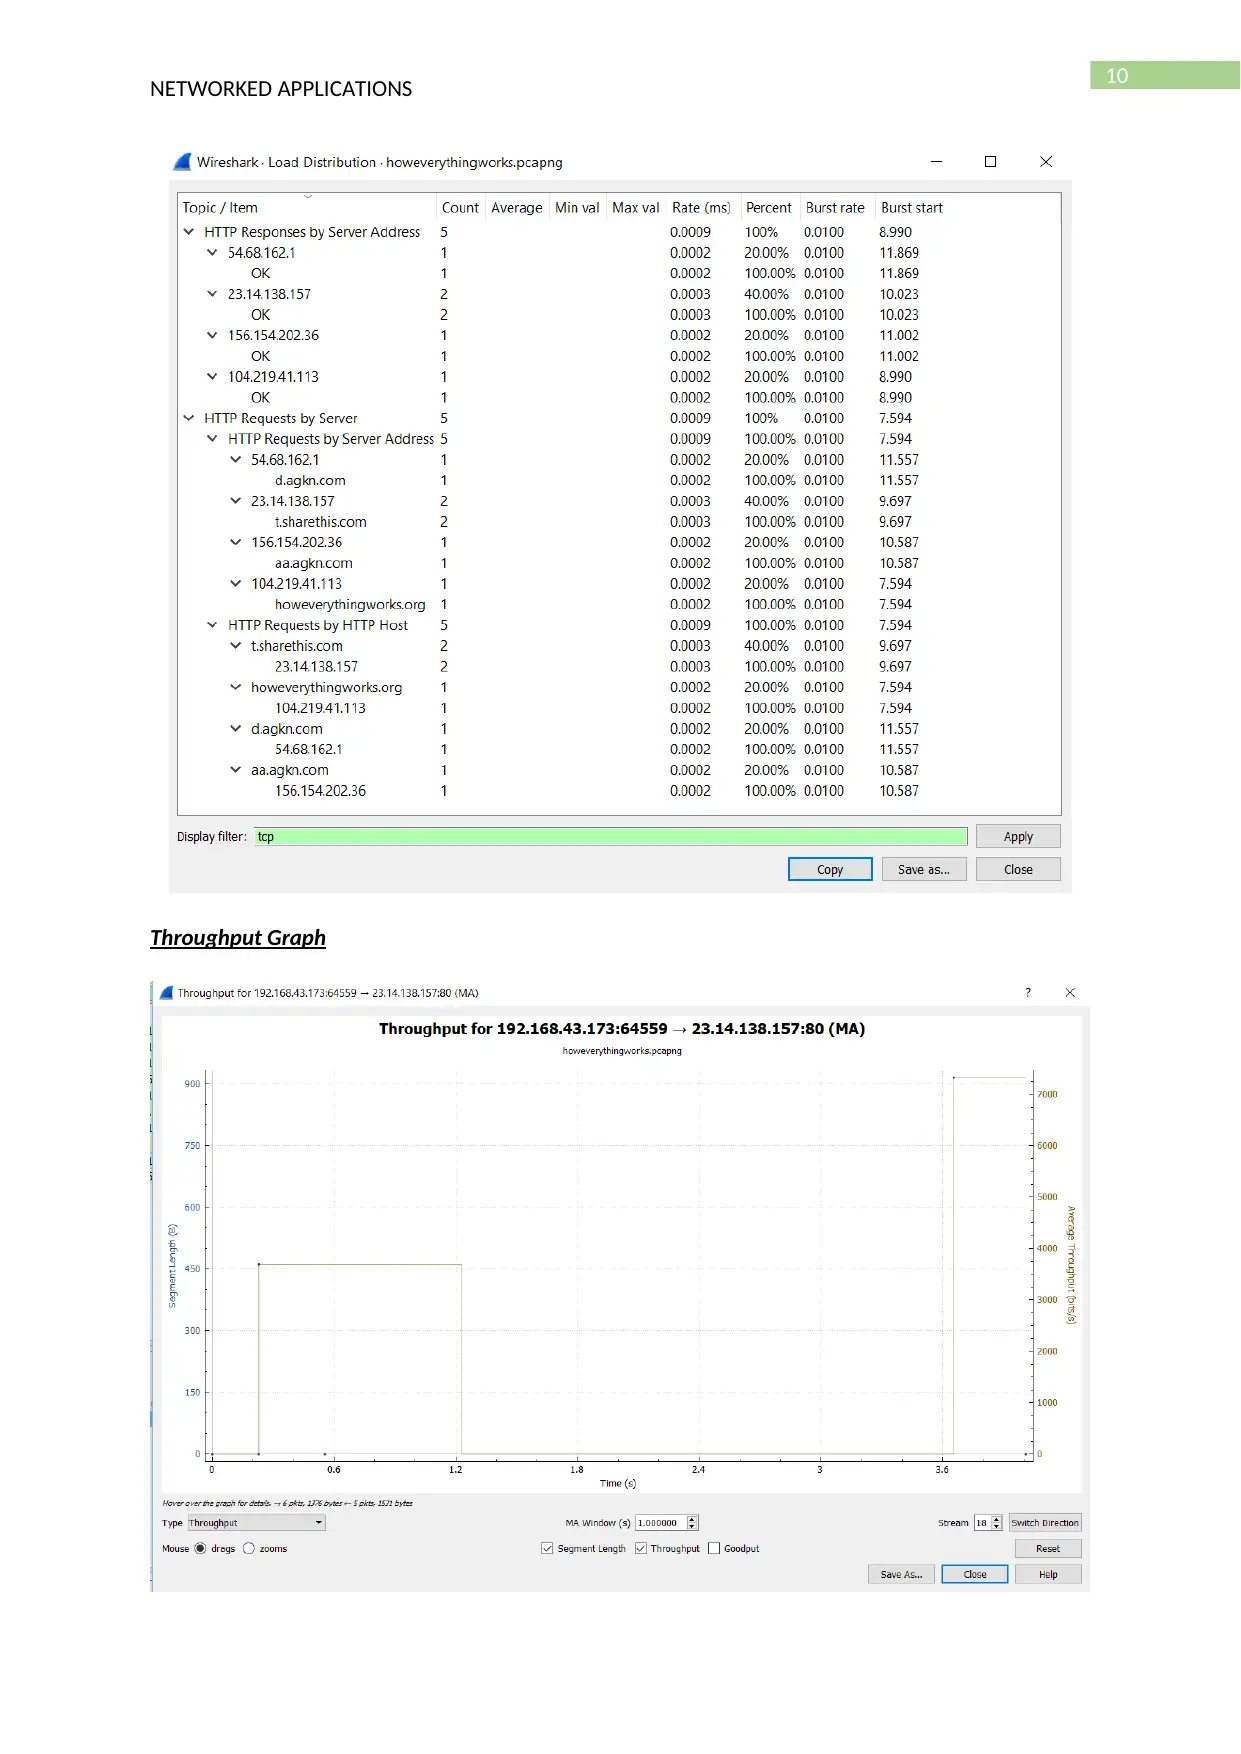
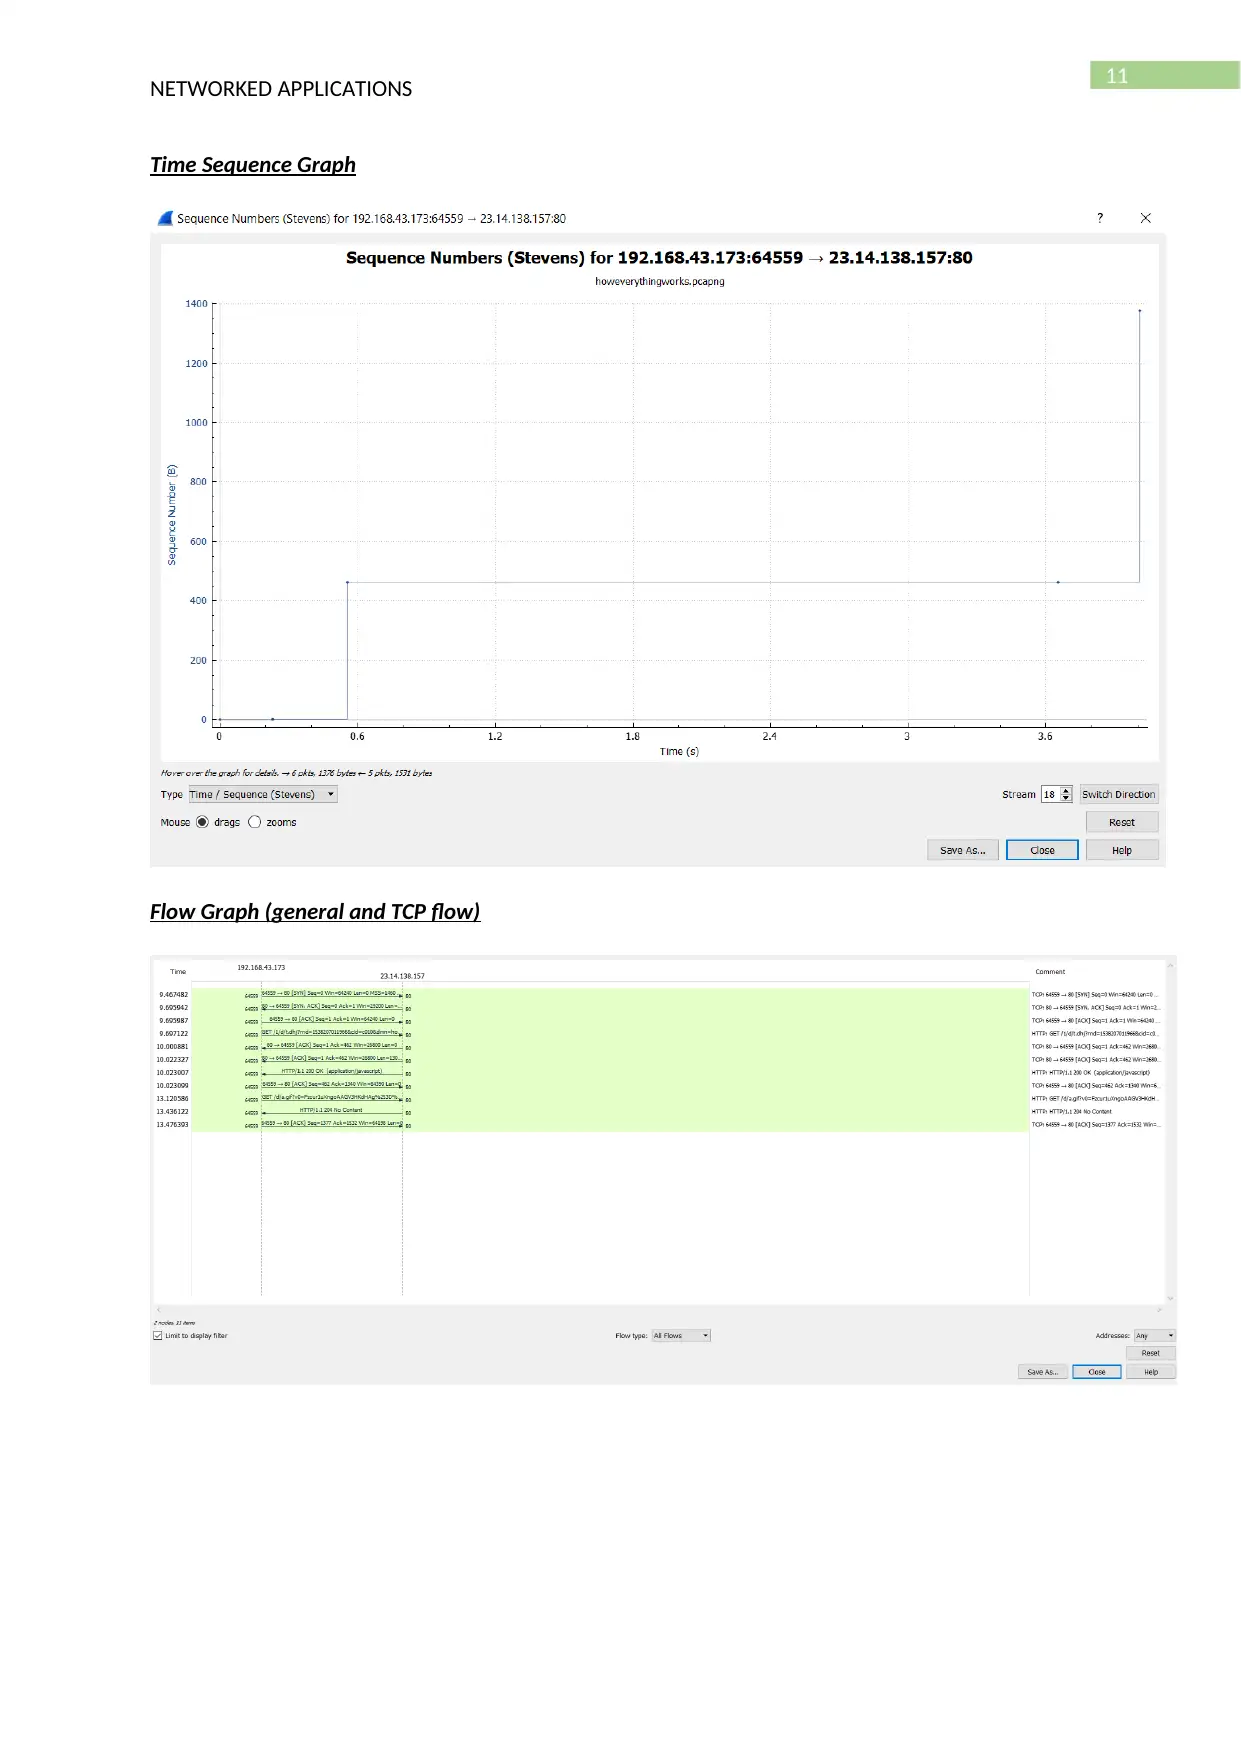
This report provides an analysis of network performance using Wireshark, focusing on identifying network loads and performance metrics. It captures live data traffic from the network to generate graphs for protocol analysis. Three websites are visited, and their packets are captured for analysis, examining parameters like port numbers, IP addresses, and data packet flow. The report includes various graphs, such as throughput, time sequence, flow, and window scaling, to assess website stability, bandwidth utilization, and TCP packet behavior. The analysis concludes that Wireshark is a valuable tool for analyzing data transmission, comparing website performance, and identifying network issues.
Document Page
Running head: NETWORKED APPLICATIONS
Analyse Network Performance
Name of the Student
Name of the University
Author’s Note
tabler-icon-diamond-filled.svg

Paraphrase This Document

Need a fresh take? Get an instant paraphrase of this document with our AI Paraphraser
Document Page
1
NETWORKED APPLICATIONS
Table of Contents
Introduction...........................................................................................................................................2
Task 1a – Explanation of the data captured..........................................................................................2
Task 1b – Significance of the project.....................................................................................................4
Task 2 – Explanation of the output of the graphs in terms of network performance..........................12
Conclusion...........................................................................................................................................12
References...........................................................................................................................................14
Document Page
2
NETWORKED APPLICATIONS
Introduction
Th report is prepared for the analysis of a network solution using the network monitoring
tool and identification of the loads and performance of the network. Wireshark is used for
identification of the performance parameters and development of the analytical skill for capturing
live data traffic from the network and generate graphs for the analysis of the protocols used for
communication. The performance of the distributed system should be analysed and the graphs and
the browsing data should be analysed for the justification of the effect. The protocols listed in the
protocol column are listed and appropriate screenshot are added in the report for its demonstration.
Three different websites are visited and the packet is captured using Wireshark for the analysis of
each of the website. The use of the Wireshark helps in analysis of the port number and the Ip
address of the source and the destination address and management of the flow of the data packet in
the network. It helps in analysis of the security and the network and can be used by the network
administrator for monitoring the data flow of the network. The interface of a client computer is used
for capturing the data packets and different types of graphs are generated for the identification of
the sequence, throughput, flow graph and scaling graph.
Task 1a – Explanation of the data captured
A. The three different types of protocols that are seen in the protocol column when the packet
list is unfiltered are as follows:
UDP
TCP, and
ARP
The following screenshot is given for supporting the answer
B. The time taken for the HTTP GET request to HTTP OK reply is given in the following frames.
The arrival time and the time delta for the previous packet can be fetched from the captured
packet with the details such as the frame number, packet length and the capture length.
Document Page
3
NETWORKED APPLICATIONS
The two frames i.e. one for the GET request and the one for the OK reply message is
analysed and the time is noted and they are subtracted for finding the time taken until the
HTTP OK reply message is received. Here the difference between the times are
.43960400 - .426032000
= 0.013572 sec
C. The internet address of gai.cs.umass.edu is 192.168.43.1
The internet address of the client computer is 192.168.43.173
This is analysed from the following frame of the packet captured
Frame 32: 77 bytes on wire (616 bits), 77 bytes captured (616 bits) on interface 0
Ethernet II, Src: HonHaiPr_f2:4c:ed (9c:30:5b:f2:4c:ed), Dst: VivoMobi_d1:30:ad
(dc:1a:c5:d1:30:ad)
Internet Protocol Version 4, Src: 192.168.43.173, Dst: 192.168.43.1
0100 .... = Version: 4
.... 0101 = Header Length: 20 bytes (5)
Differentiated Services Field: 0x00 (DSCP: CS0, ECN: Not-ECT)
Total Length: 63
Identification: 0x0055 (85)
Flags: 0x0000
Time to live: 128
Protocol: UDP (17)
Header checksum: 0x625a [validation disabled]
[Header checksum status: Unverified]
Source: 192.168.43.173
Destination: 192.168.43.1
User Datagram Protocol, Src Port: 64050, Dst Port: 53
Domain Name System (query)
tabler-icon-diamond-filled.svg

Paraphrase This Document

Need a fresh take? Get an instant paraphrase of this document with our AI Paraphraser
Document Page
4
NETWORKED APPLICATIONS
Task 1b – Significance of the project
The performance of the following websites are analysed in terms of their load distribution,
throughput graph, time sequence graph, flow graph and window scaling graph. Each of the graphs
have different functionality such as:
Throughput graph – It is used for the analysis of the average throughput and the goodput
Window Scaling – It is used for the analysis of the window size and the outstanding bytes
Time sequence – it is used for the generation of a simple graph that is quite similar with the tcptrace
and includes the forward segments, selective acknowledgement, zero windows and the reverse
window size.
Flow Graph – It is used for the demonstration of the flow of the data packets and the messages
between the client and the server.
There are different filters that can eb applied in wireshark for getting more specific result and
optimizing the result of the analysis of the network performance.
https://www.sbs.com.au/news/
Load Distribution
Document Page
5
NETWORKED APPLICATIONS
Throughput Graph
Time Sequence Graph
Document Page
6
NETWORKED APPLICATIONS
Flow Graph (general and TCP flow)
Window Scaling Graph
tabler-icon-diamond-filled.svg

Paraphrase This Document

Need a fresh take? Get an instant paraphrase of this document with our AI Paraphraser
Document Page
7
NETWORKED APPLICATIONS
https://www.amazon.com.au
Load Distribution
Throughput Graph
Document Page
8
NETWORKED APPLICATIONS
Time Sequence Graph
Flow Graph (general and TCP flow)
Document Page
9
NETWORKED APPLICATIONS
Window Scaling Graph
http://howeverythingworks.org/
Load Distribution
tabler-icon-diamond-filled.svg

Paraphrase This Document

Need a fresh take? Get an instant paraphrase of this document with our AI Paraphraser
Document Page
10
NETWORKED APPLICATIONS
Throughput Graph
Document Page
11
NETWORKED APPLICATIONS
Time Sequence Graph
Flow Graph (general and TCP flow)
chevron_up_icon
1 out of 15
circle_padding
hide_on_mobile
zoom_out_icon
[object Object]