Scheduling and Network Analysis for Maintenance Project Management
VerifiedAdded on 2023/06/04
|14
|2079
|119
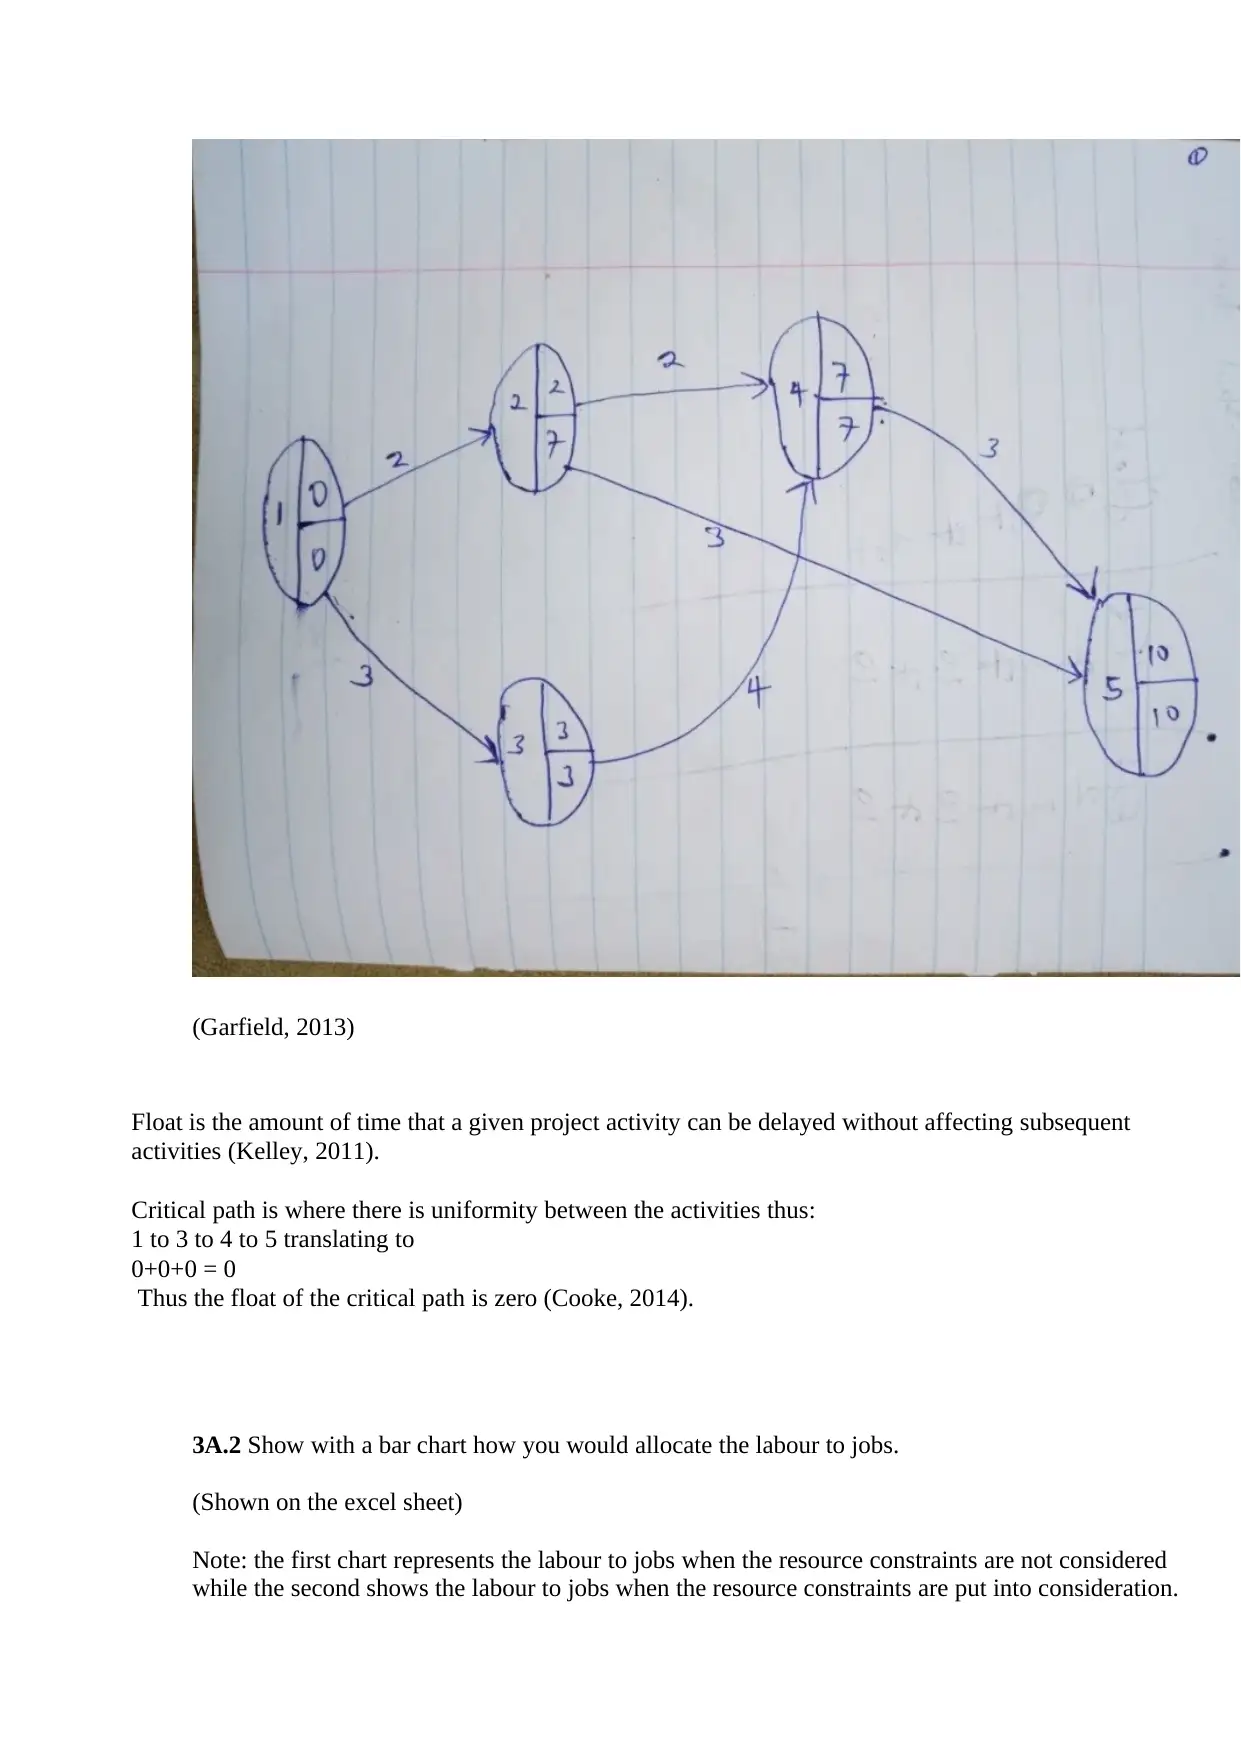
Project
AI Summary
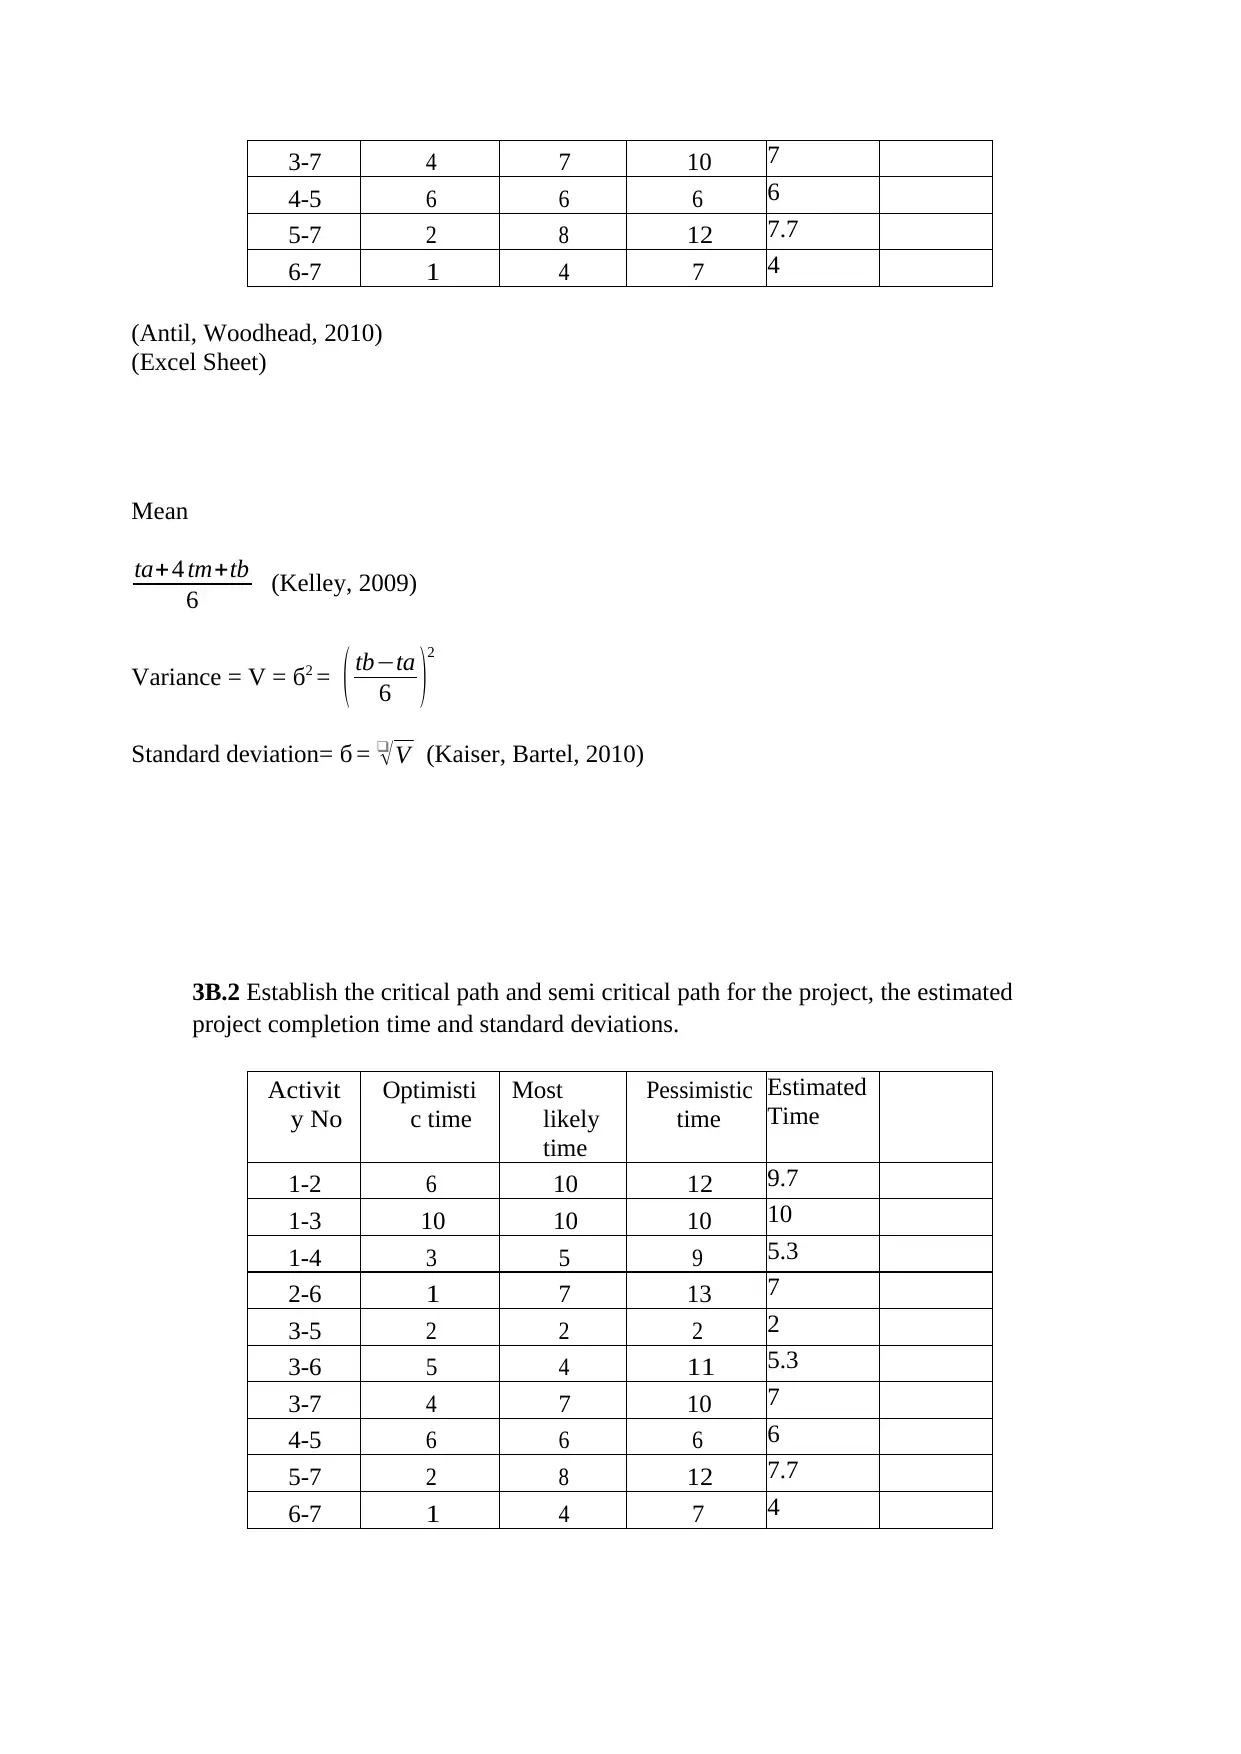
This project focuses on network scheduling and analysis within the context of a maintenance project. It includes worked solutions for activities, graphical charts, and detailed explanations. The project addresses constraints such as limited personnel and the requirement to finish tasks once started. It involves completing a table, drawing a network diagram to identify the critical path, and creating bar charts for labor allocation, considering both resource-unconstrained and resource-constrained scenarios. Furthermore, the project analyzes the impact of unexpected worker absence on the project schedule and explores project crashing to optimize duration and costs, including both direct and indirect expenses. The analysis includes calculating estimated times, standard deviations, and probabilities for project completion under various conditions, using critical path method and considering the cost implications of crashing activities.


1 out of 14
Related Documents


Your All-in-One AI-Powered Toolkit for Academic Success.
+13062052269
info@desklib.com
Available 24*7 on WhatsApp / Email
![[object Object]](/_next/static/media/star-bottom.7253800d.svg)
Copyright © 2020–2026 A2Z Services. All Rights Reserved. Developed and managed by ZUCOL.