Comprehensive Wireshark Report: Network Analysis and Performance

Verified

Added on  2023/06/03

|23
|1706
|301
Report
AI Summary
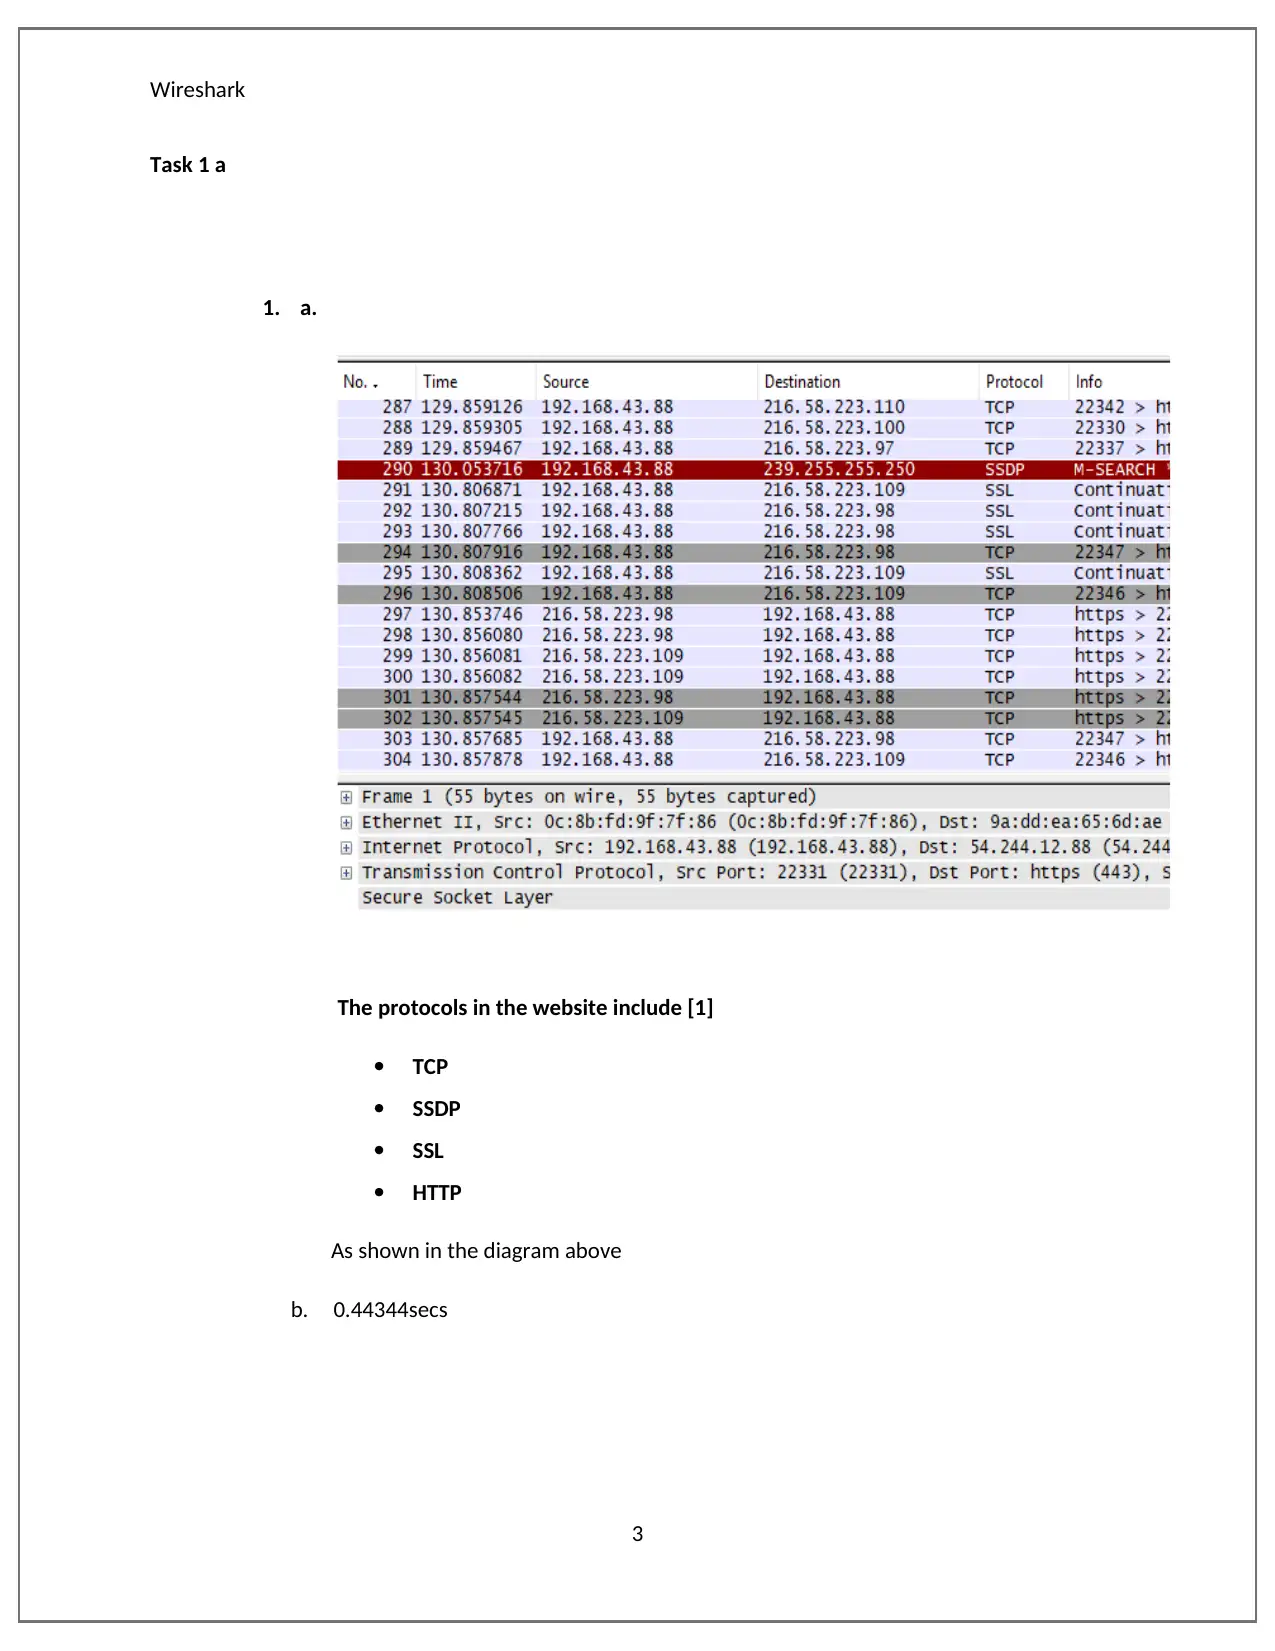
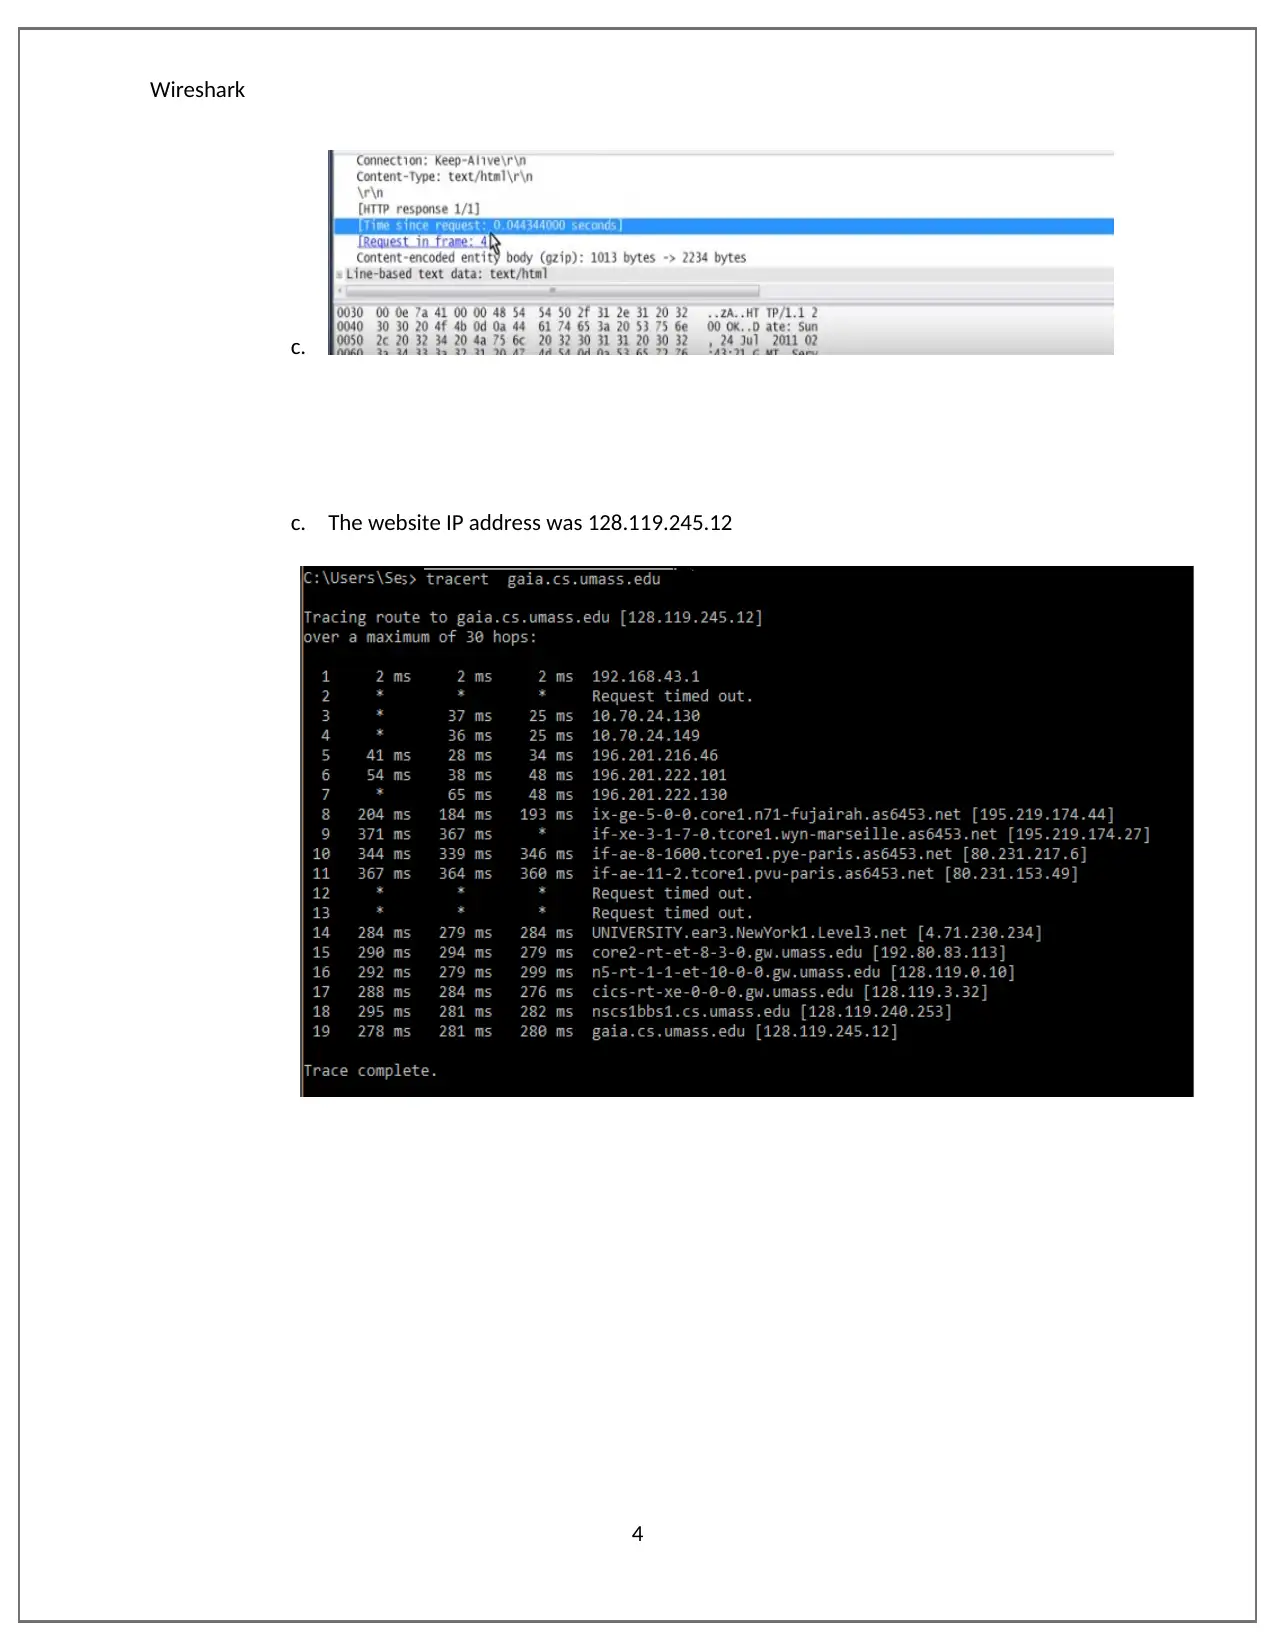
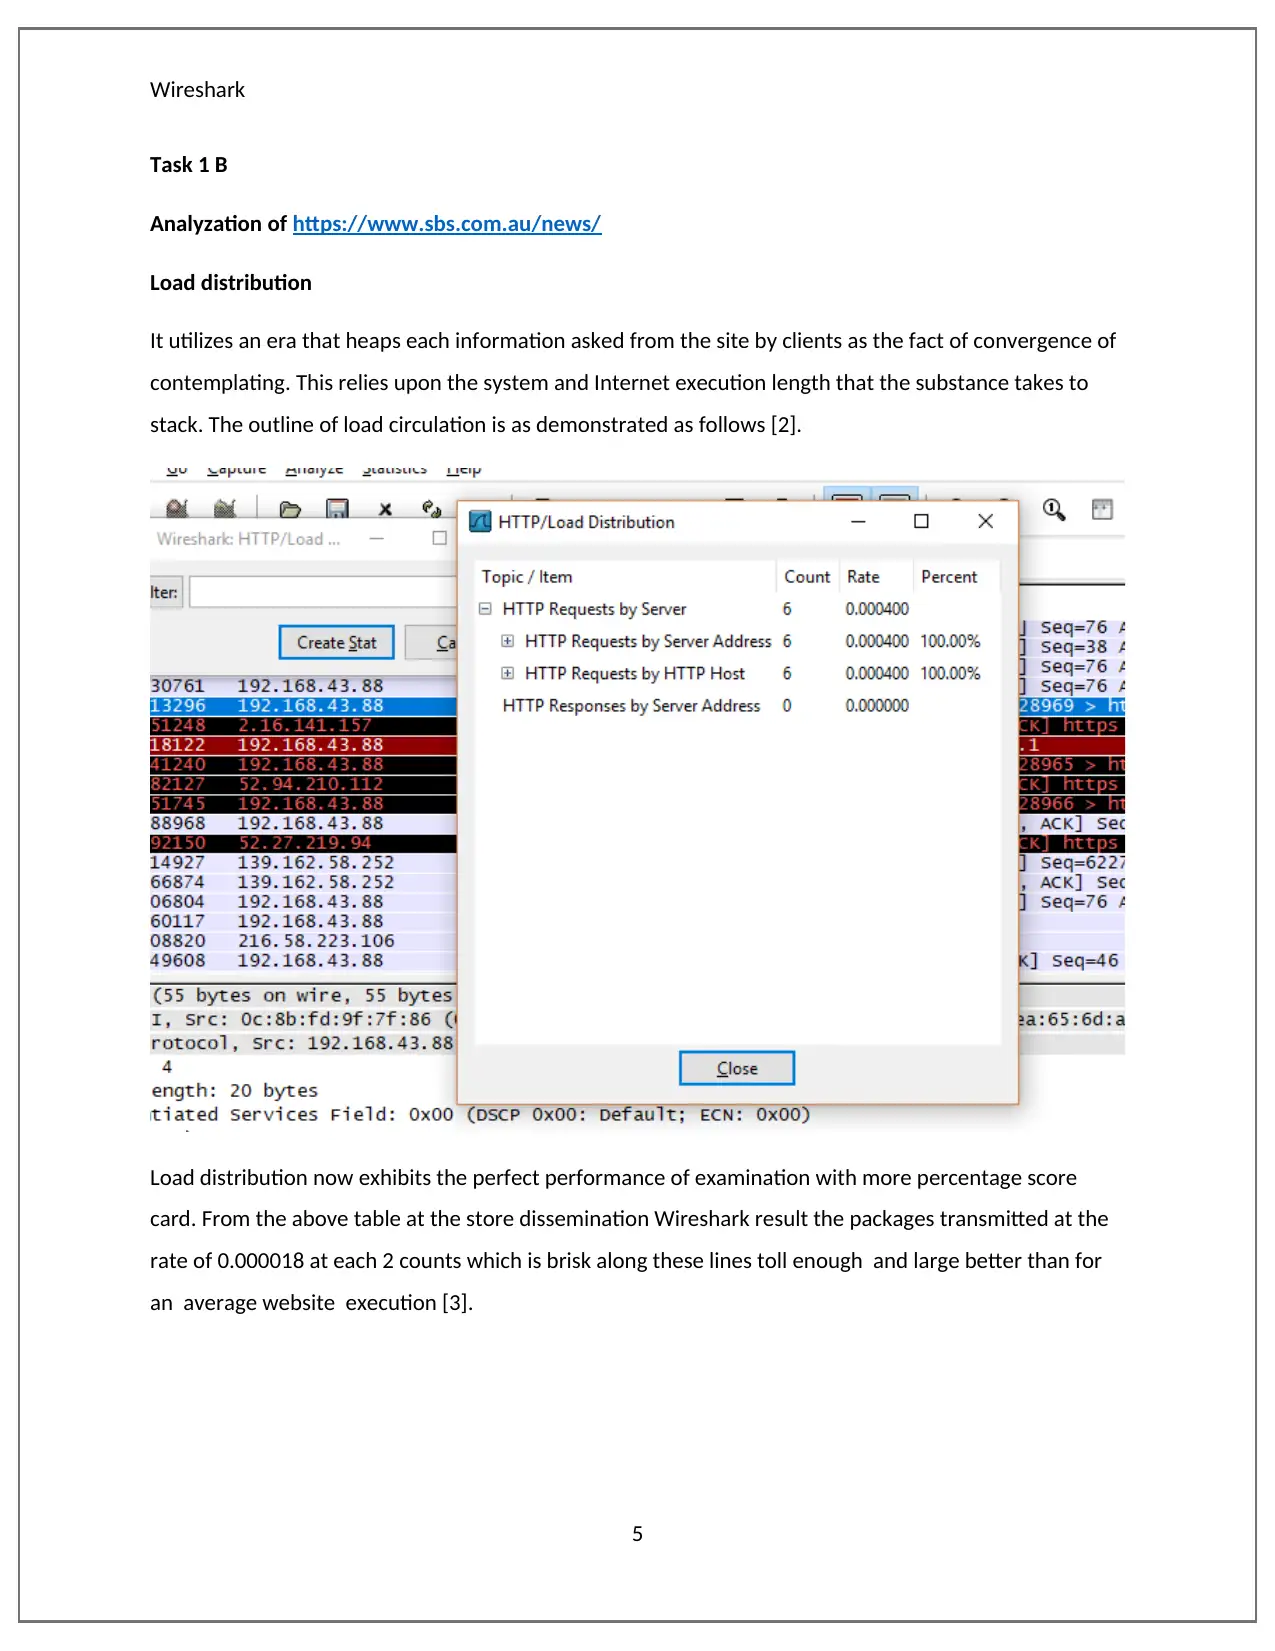
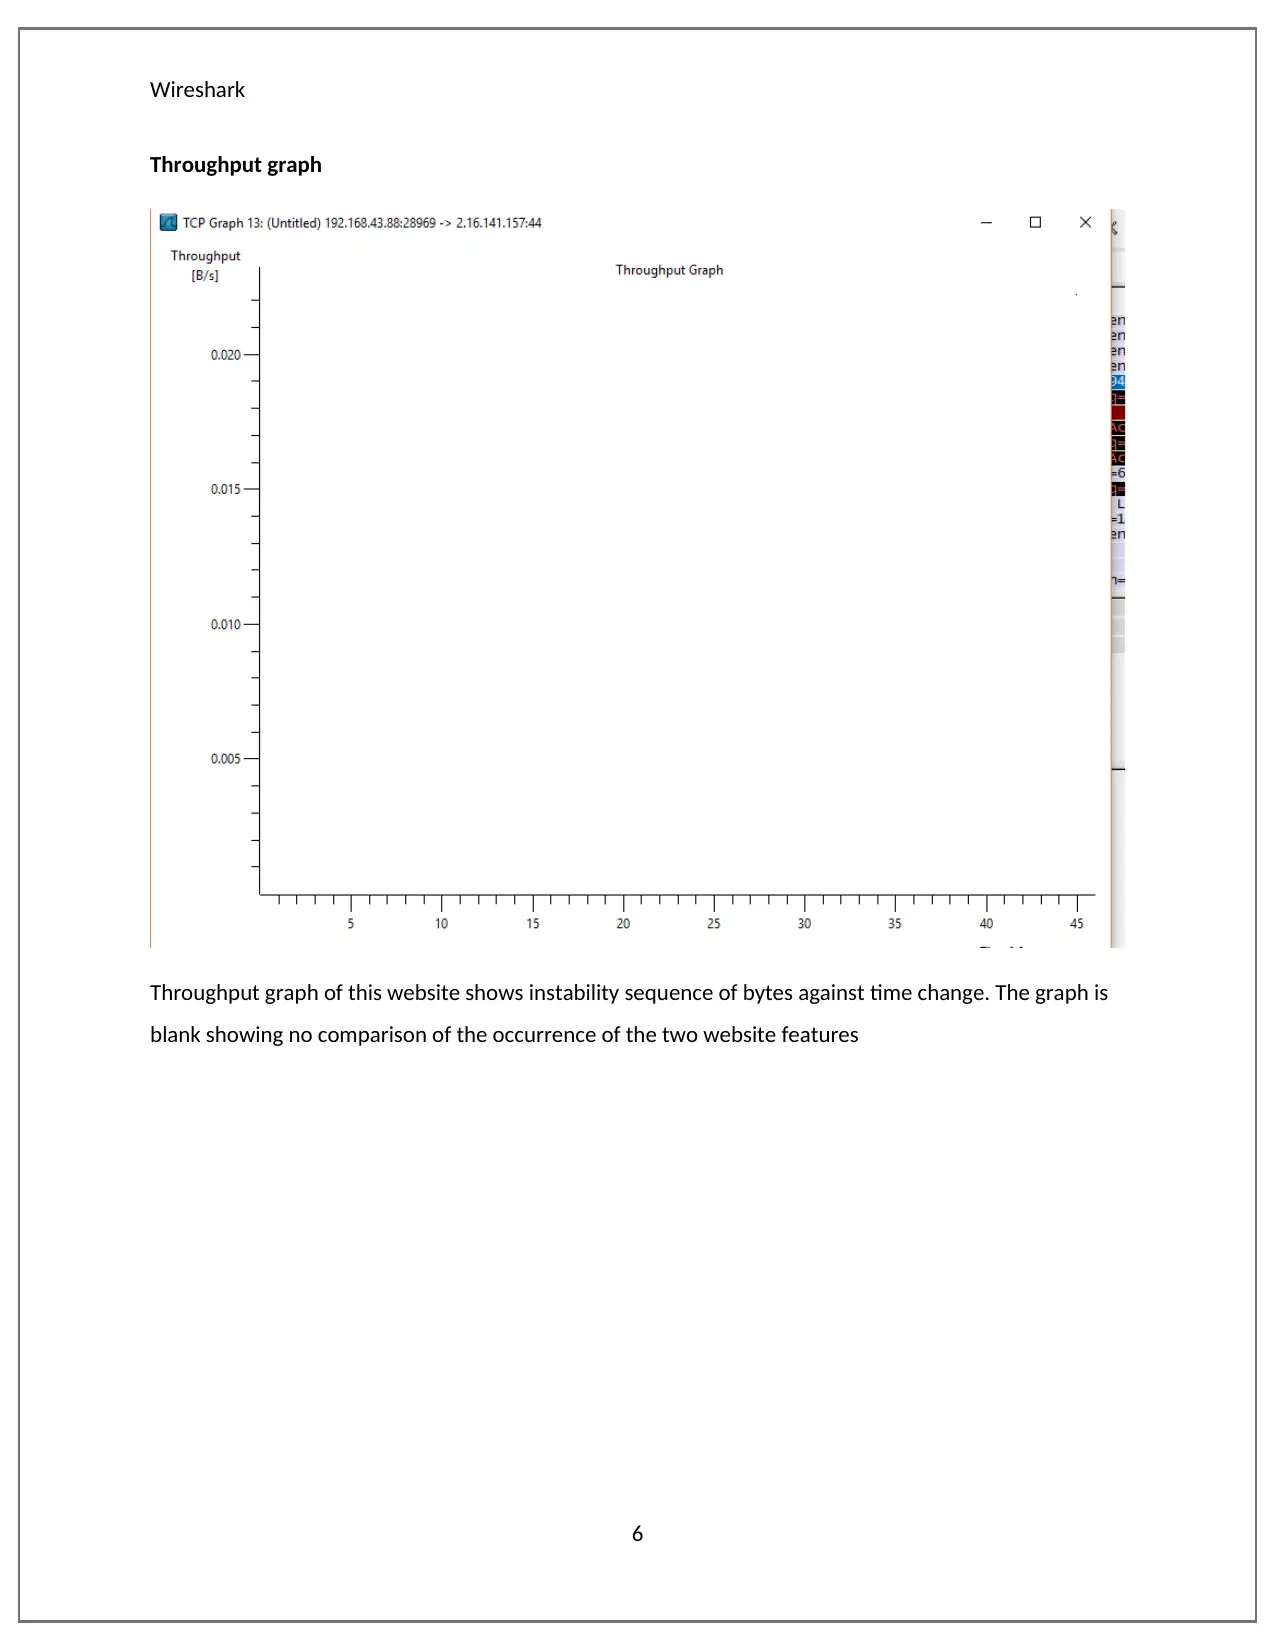
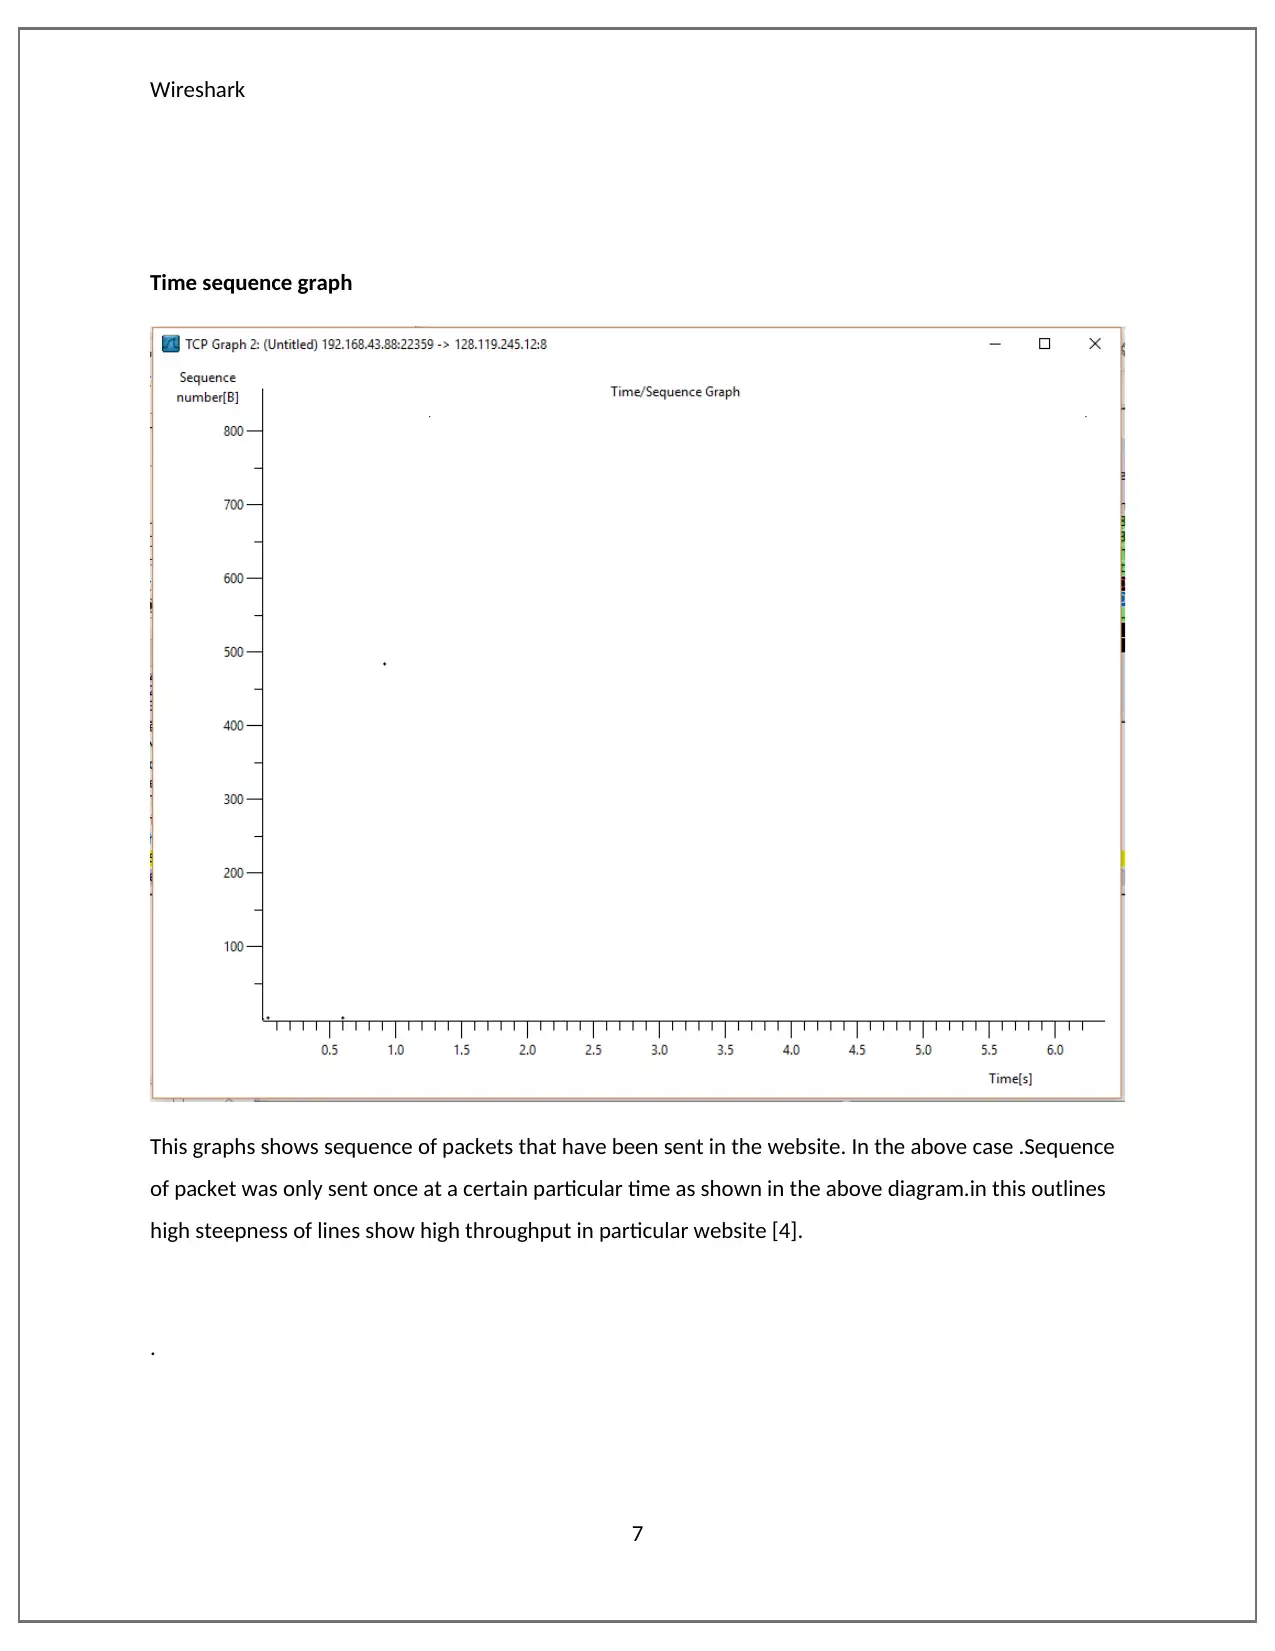
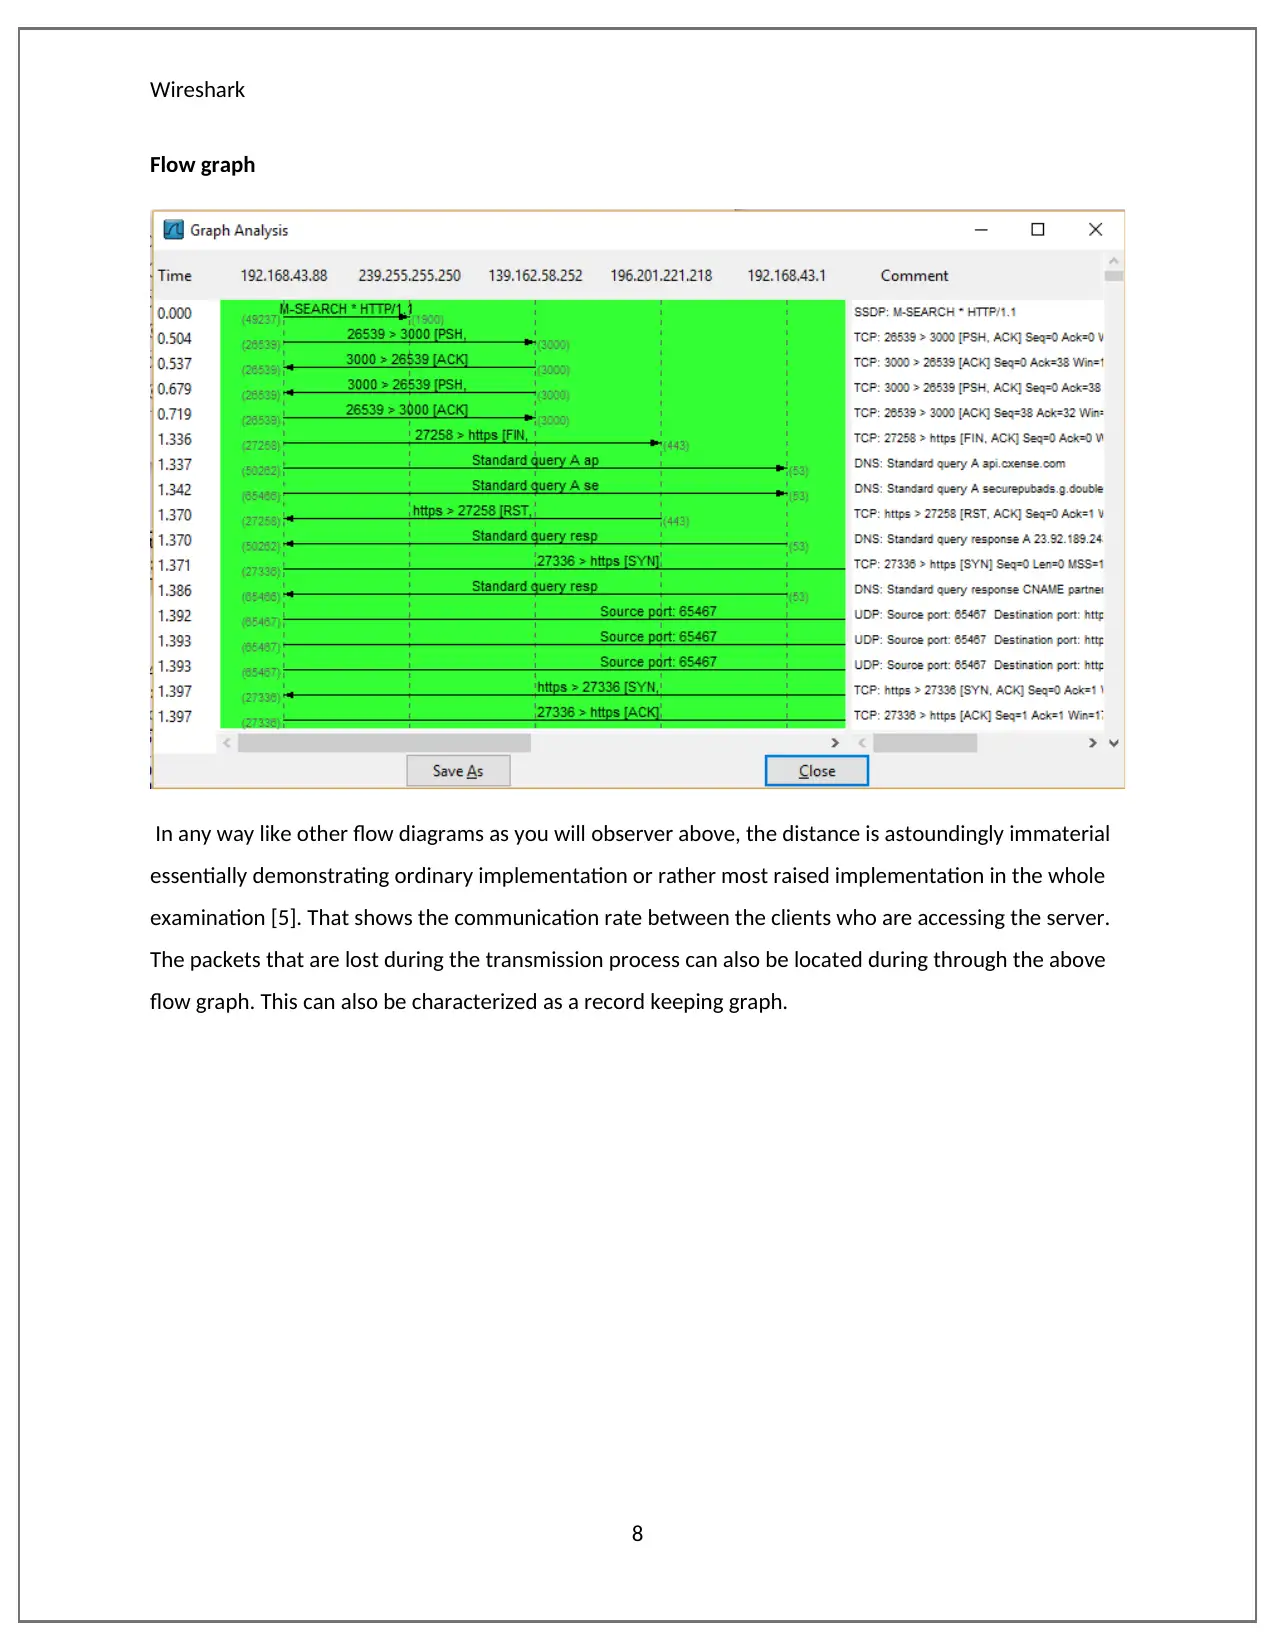
This report provides a detailed analysis of network packets using Wireshark, examining various websites to understand their load distribution, throughput, and time sequence. The analysis compares packet flows across different websites, highlighting variations in server responses to client requests. Wireshark, a packet sniffer, captures and analyzes network traffic by setting the network card in promiscuous mode. The report includes graphs illustrating throughput, time sequence, and flow, offering insights into network performance and communication rates. Specific websites such as sbs.com.au, amazon.com.au, and howeverythingworks.org are analyzed to demonstrate the software's capabilities in evaluating network behavior. This document explains how different website packets have been analyzed with Wireshark. The result that are produced by the software are totally different from each other. This is an indication that servers respond differently to request send by clients. Desklib provides a platform for students to access similar solved assignments and study tools.
Document Page
tabler-icon-diamond-filled.svg

Paraphrase This Document

Need a fresh take? Get an instant paraphrase of this document with our AI Paraphraser
Document Page
Wireshark
Wireshark
1
[Year]
S |
Document Page
Wireshark
Introduction.
A packet sniffer is software that captures and analyze packets that are flowing in any given network. The
sniffer always set the network card in a promiscuous mode so that it can track each packet that is
flowing in a given network. This explains how different websites packets are analyzed using Wireshark
software through techniques such as load distribution. The analyzation is compared between each other
and graphs are plotted using the software as below.
2
Document Page
Wireshark
Task 1 a
1. a.
The protocols in the website include [1]
TCP
SSDP
SSL
HTTP
As shown in the diagram above
b. 0.44344secs
3
tabler-icon-diamond-filled.svg

Paraphrase This Document

Need a fresh take? Get an instant paraphrase of this document with our AI Paraphraser
Document Page
Wireshark
c.
c. The website IP address was 128.119.245.12
4
Document Page
Wireshark
Task 1 B
Analyzation of https://www.sbs.com.au/news/
Load distribution
It utilizes an era that heaps each information asked from the site by clients as the fact of convergence of
contemplating. This relies upon the system and Internet execution length that the substance takes to
stack. The outline of load circulation is as demonstrated as follows [2].
Load distribution now exhibits the perfect performance of examination with more percentage score
card. From the above table at the store dissemination Wireshark result the packages transmitted at the
rate of 0.000018 at each 2 counts which is brisk along these lines toll enough and large better than for
an average website execution [3].
5
Document Page
Wireshark
Throughput graph
Throughput graph of this website shows instability sequence of bytes against time change. The graph is
blank showing no comparison of the occurrence of the two website features
6
tabler-icon-diamond-filled.svg

Paraphrase This Document

Need a fresh take? Get an instant paraphrase of this document with our AI Paraphraser
Document Page
Wireshark
Time sequence graph
This graphs shows sequence of packets that have been sent in the website. In the above case .Sequence
of packet was only sent once at a certain particular time as shown in the above diagram.in this outlines
high steepness of lines show high throughput in particular website [4].
.
7
Document Page
Wireshark
Flow graph
In any way like other flow diagrams as you will observer above, the distance is astoundingly immaterial
essentially demonstrating ordinary implementation or rather most raised implementation in the whole
examination [5]. That shows the communication rate between the clients who are accessing the server.
The packets that are lost during the transmission process can also be located during through the above
flow graph. This can also be characterized as a record keeping graph.
8
Document Page
Wireshark
Window scaling
Window scaling is just like TCP window, which uses memorial pads.With data loaded in it , it supports
implementation of the goals tends to back off thusly the degree of the beneficiary gap and the swiftness
are clearly relating.
9
tabler-icon-diamond-filled.svg

Paraphrase This Document

Need a fresh take? Get an instant paraphrase of this document with our AI Paraphraser
Document Page
Wireshark
Analyzation of https://www.amazon.com.au
Load distribution
Load distribution appointments bases on the way the website is loaded with data by the client.
Depending upon the system the rate of loading data to the website varies. From the results above the
request that are received by the server are at an average rate of 6 counts taking an average rate of
0.000400 milliseconds. The percentage in this rate is 100%
10
Document Page
Wireshark
Throughput graph
This graphs shows the comparison of data between the throughputs on the server against the time in
milliseconds. Throughput is mainly evaluated mainly in bytes and address proportion that clients receive
from the server in seconds. Here the throughput is highly scattered in the graph this shows that there
were a lot of rates of communication the graph at one specified time.
11
chevron_up_icon
1 out of 23
circle_padding
hide_on_mobile
zoom_out_icon
[object Object]