Information Technology: Website Analysis and Wireshark Packet Capture

Verified

Added on  2023/06/11

|21
|1687
|212
Report
AI Summary
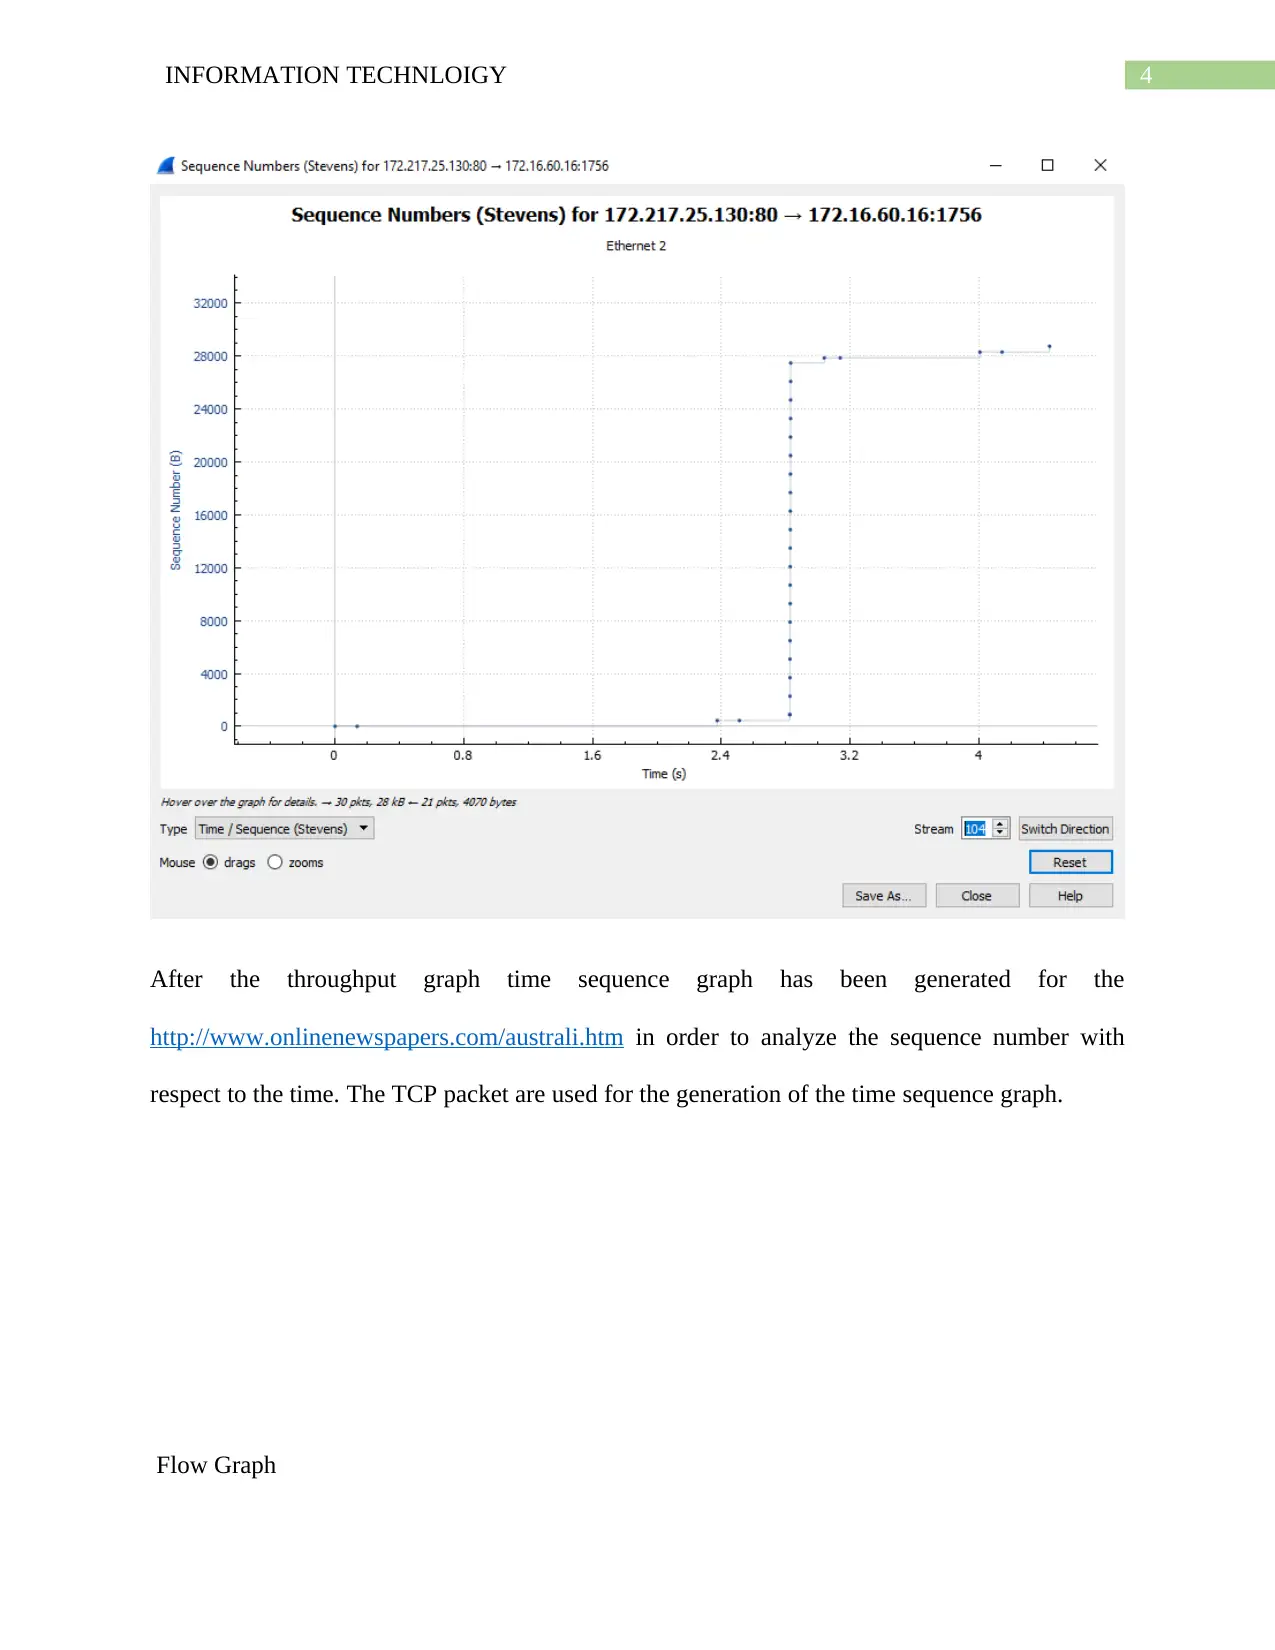
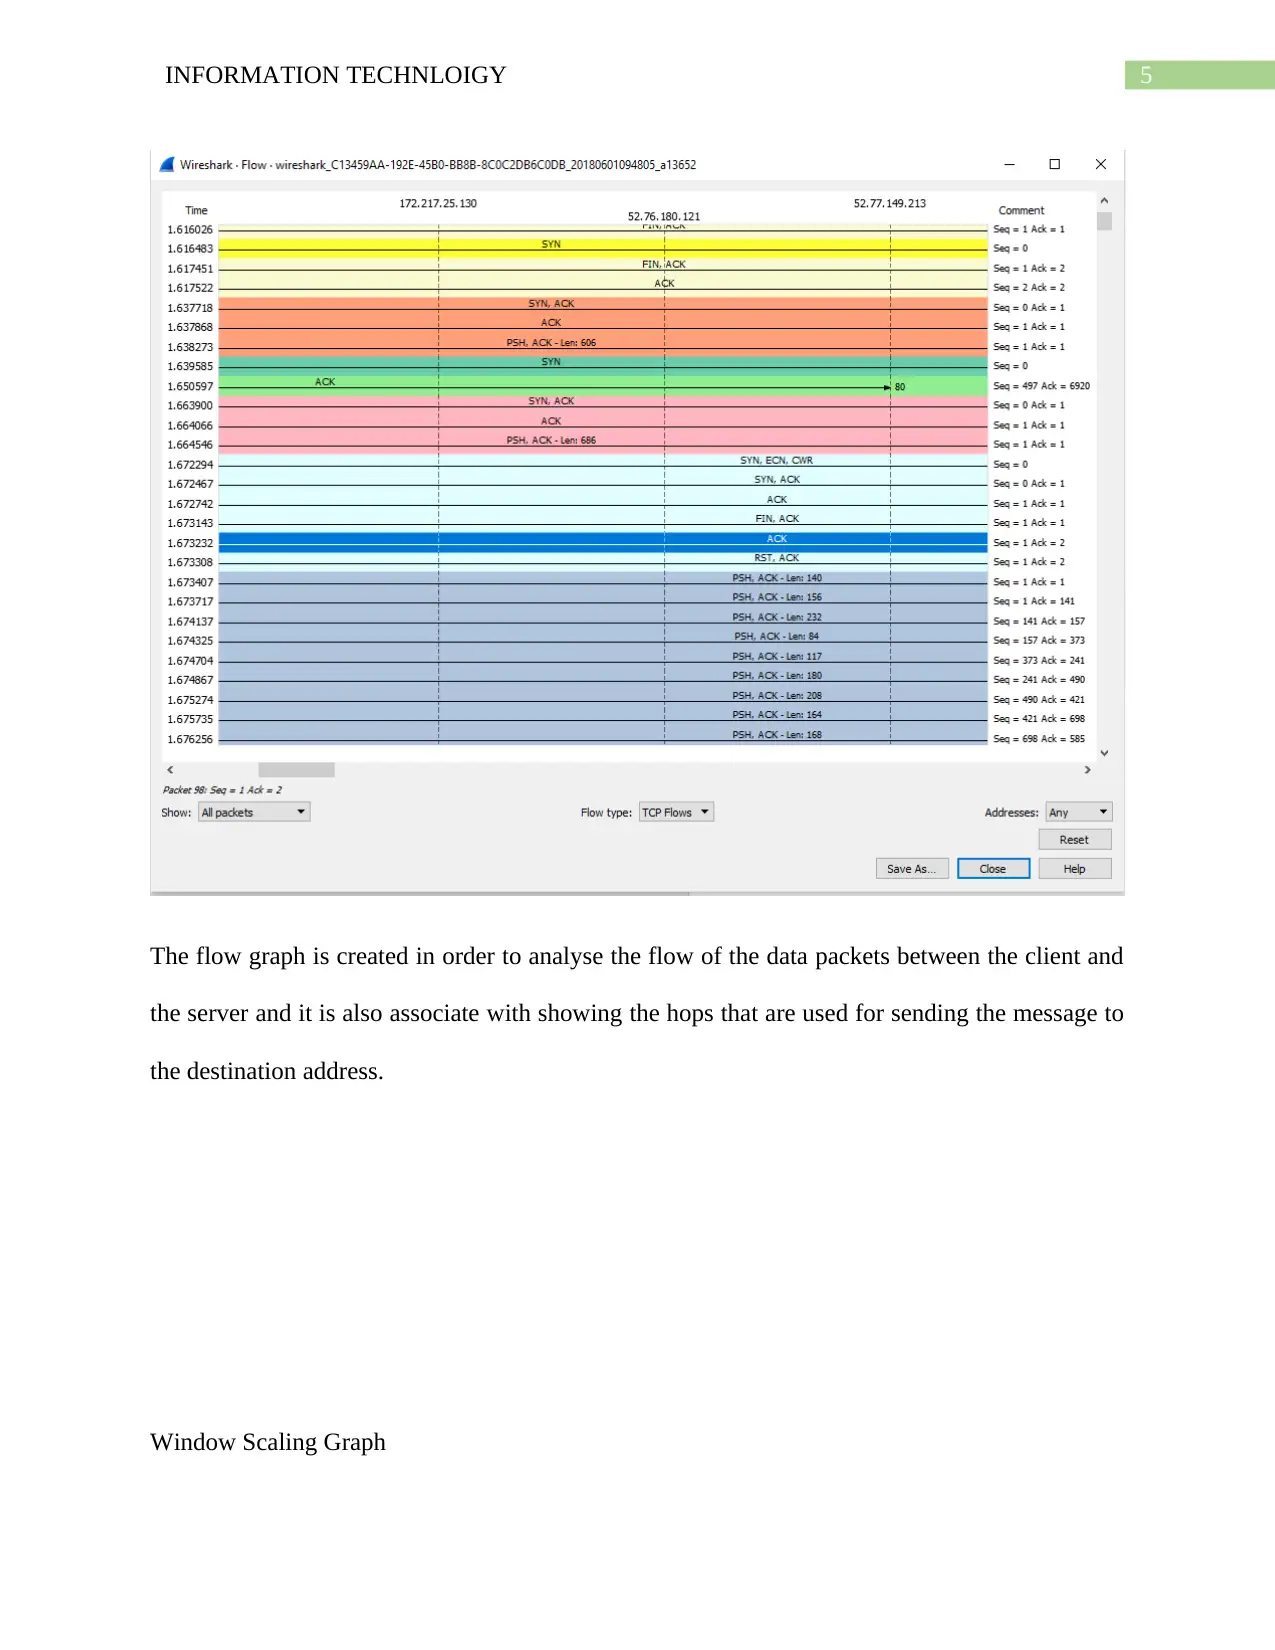
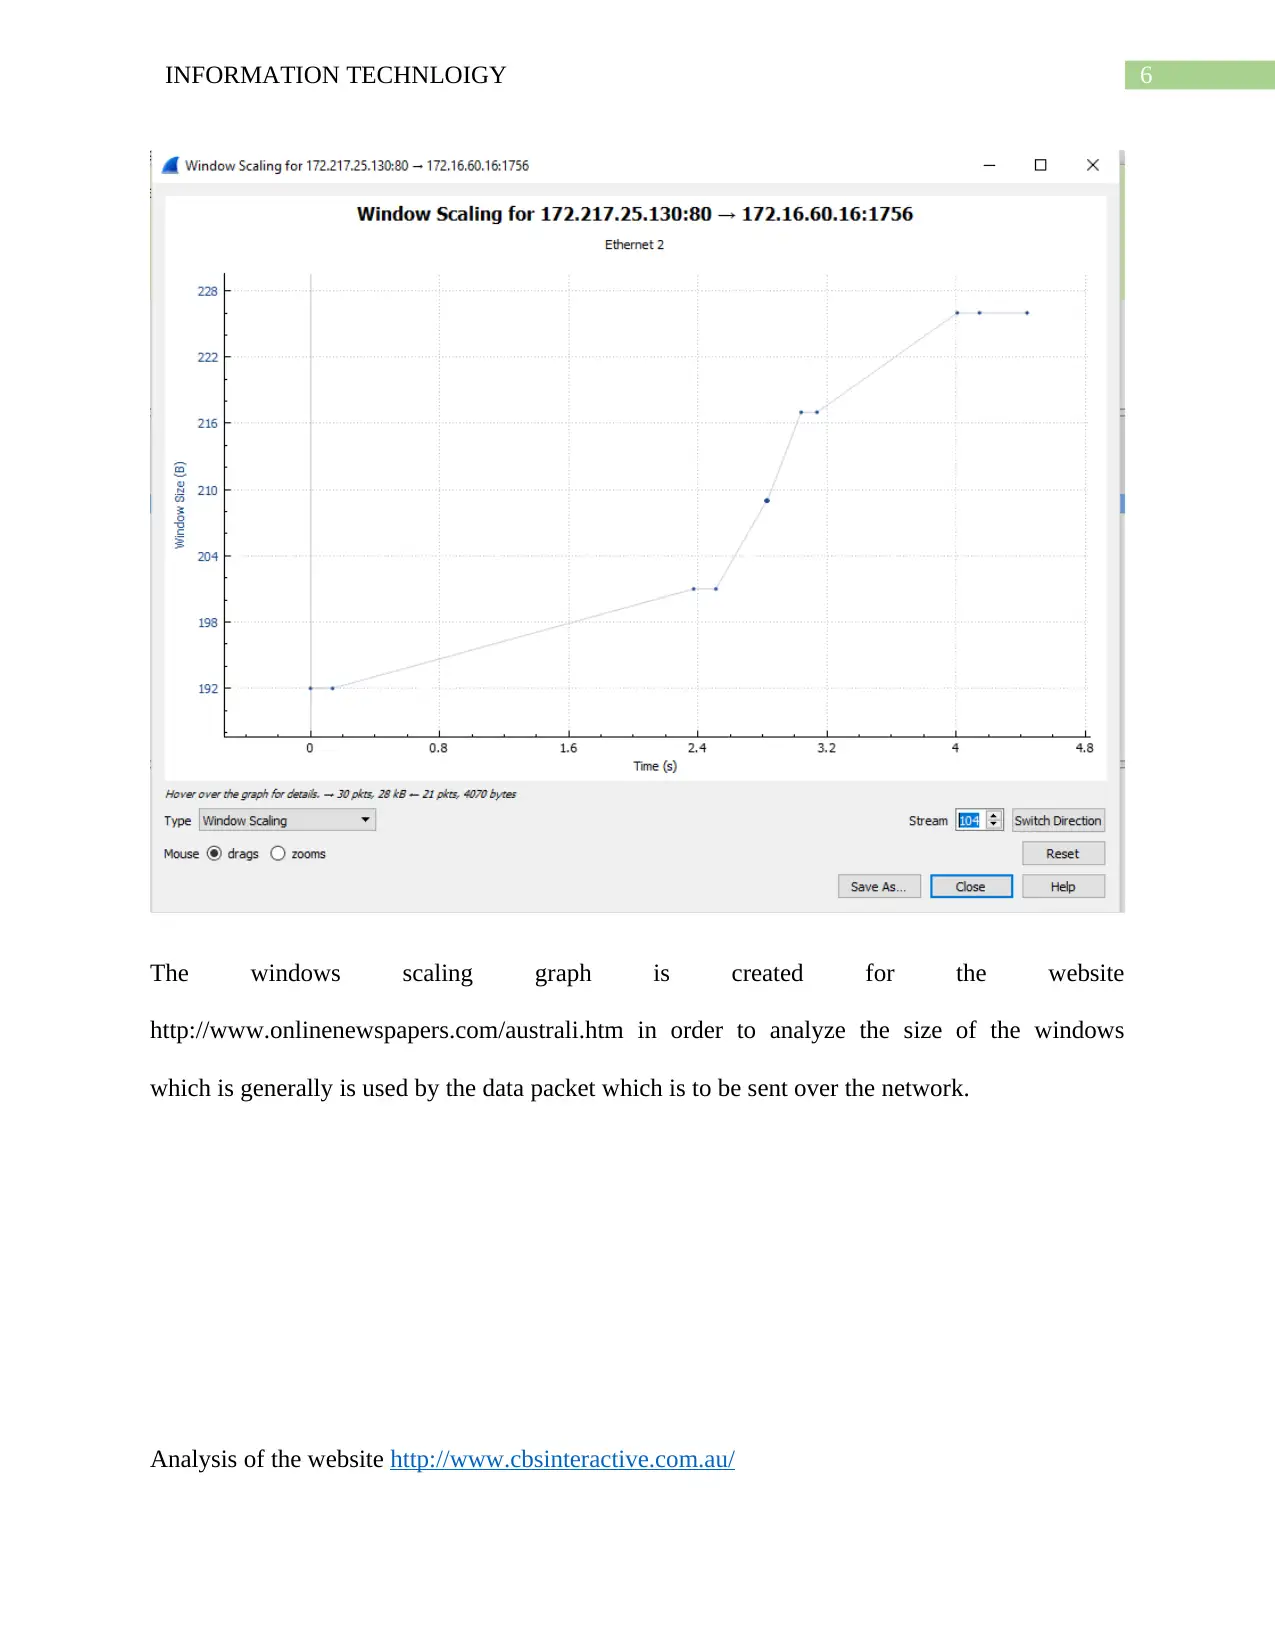
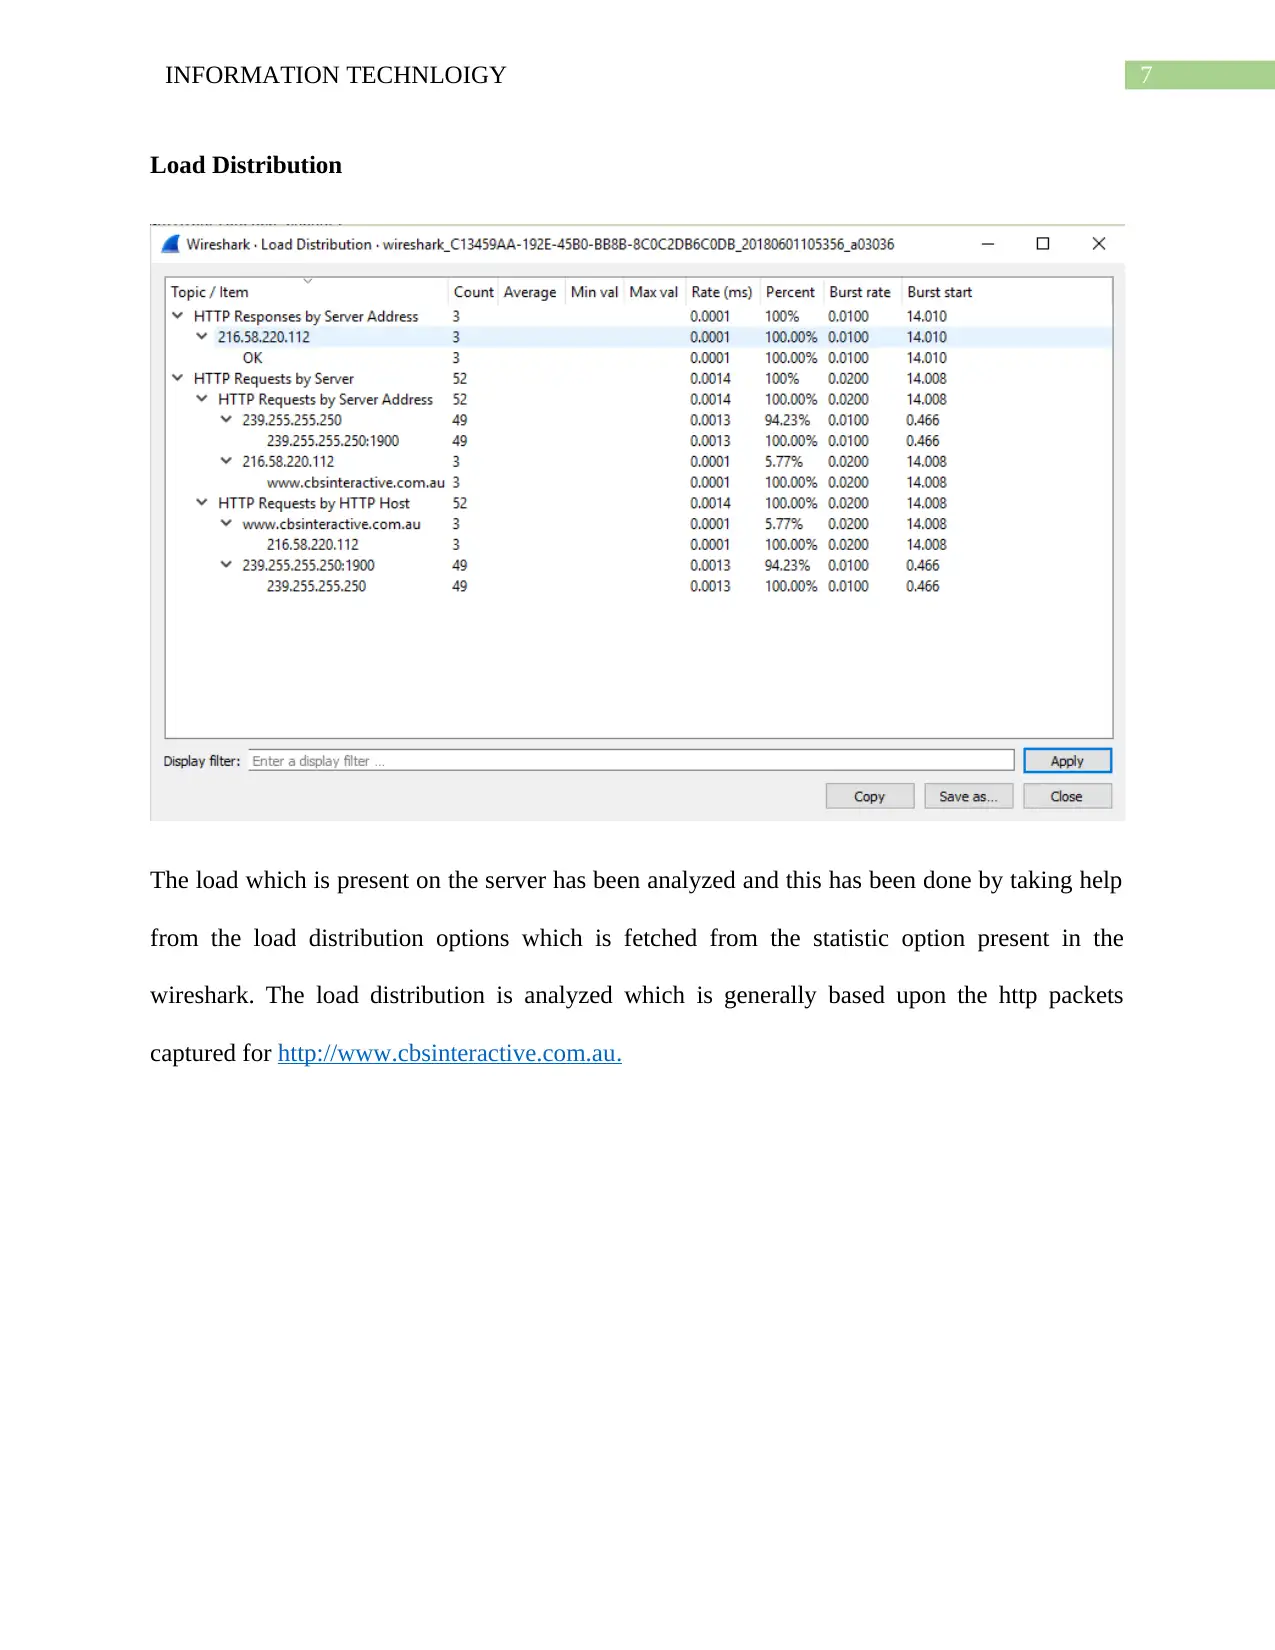
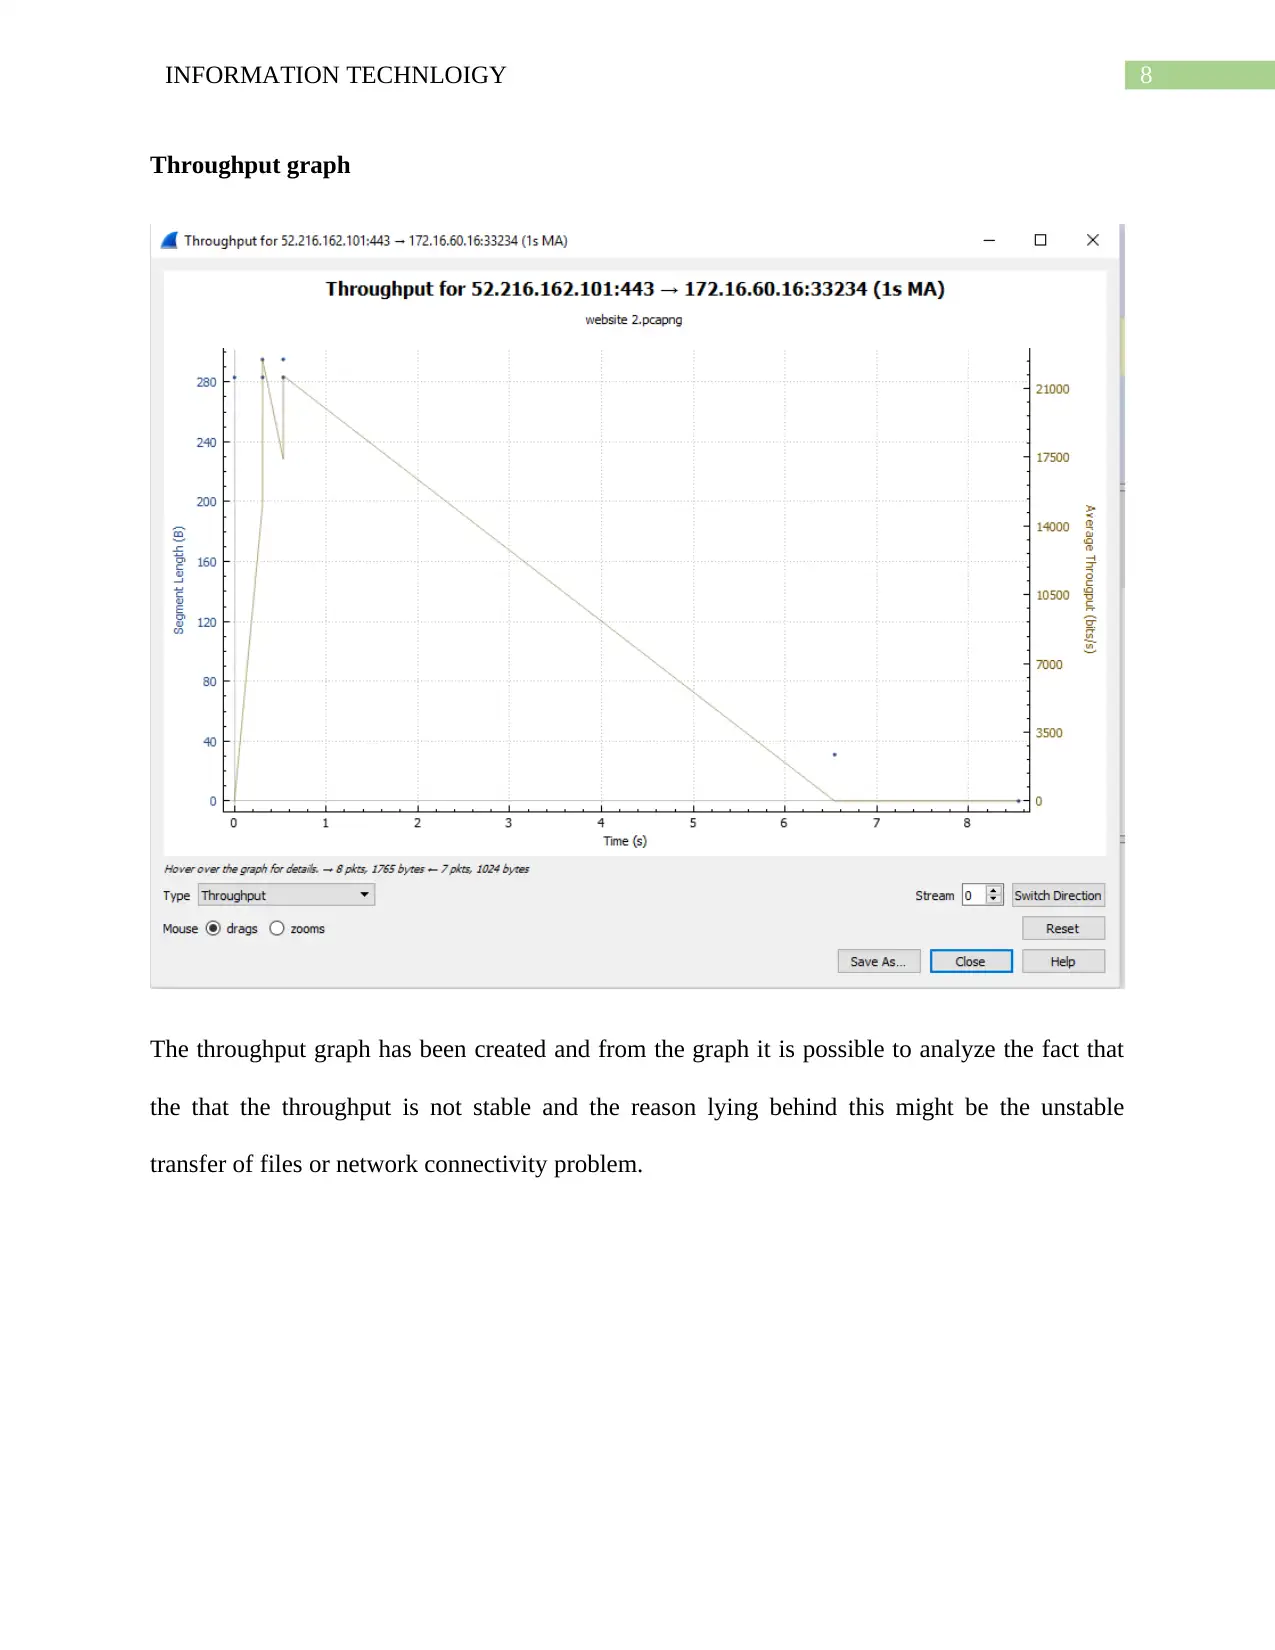
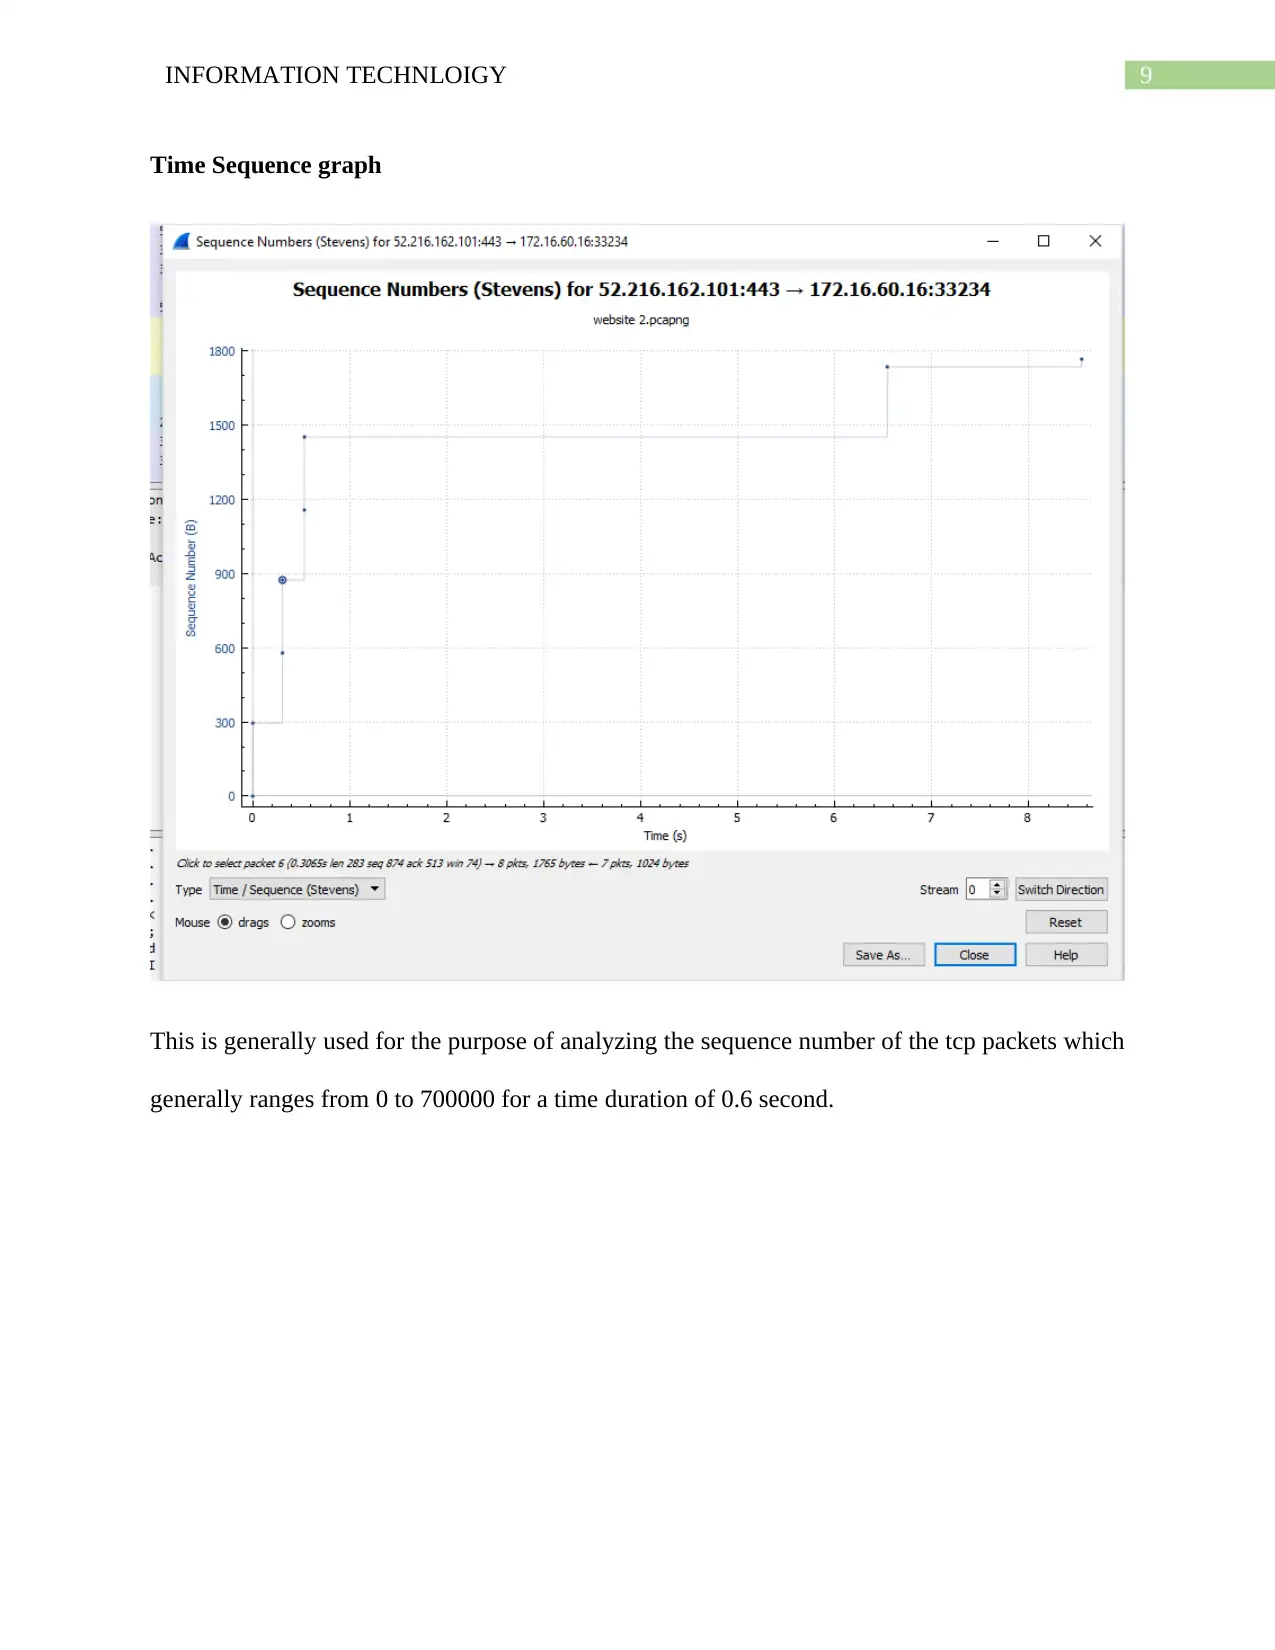
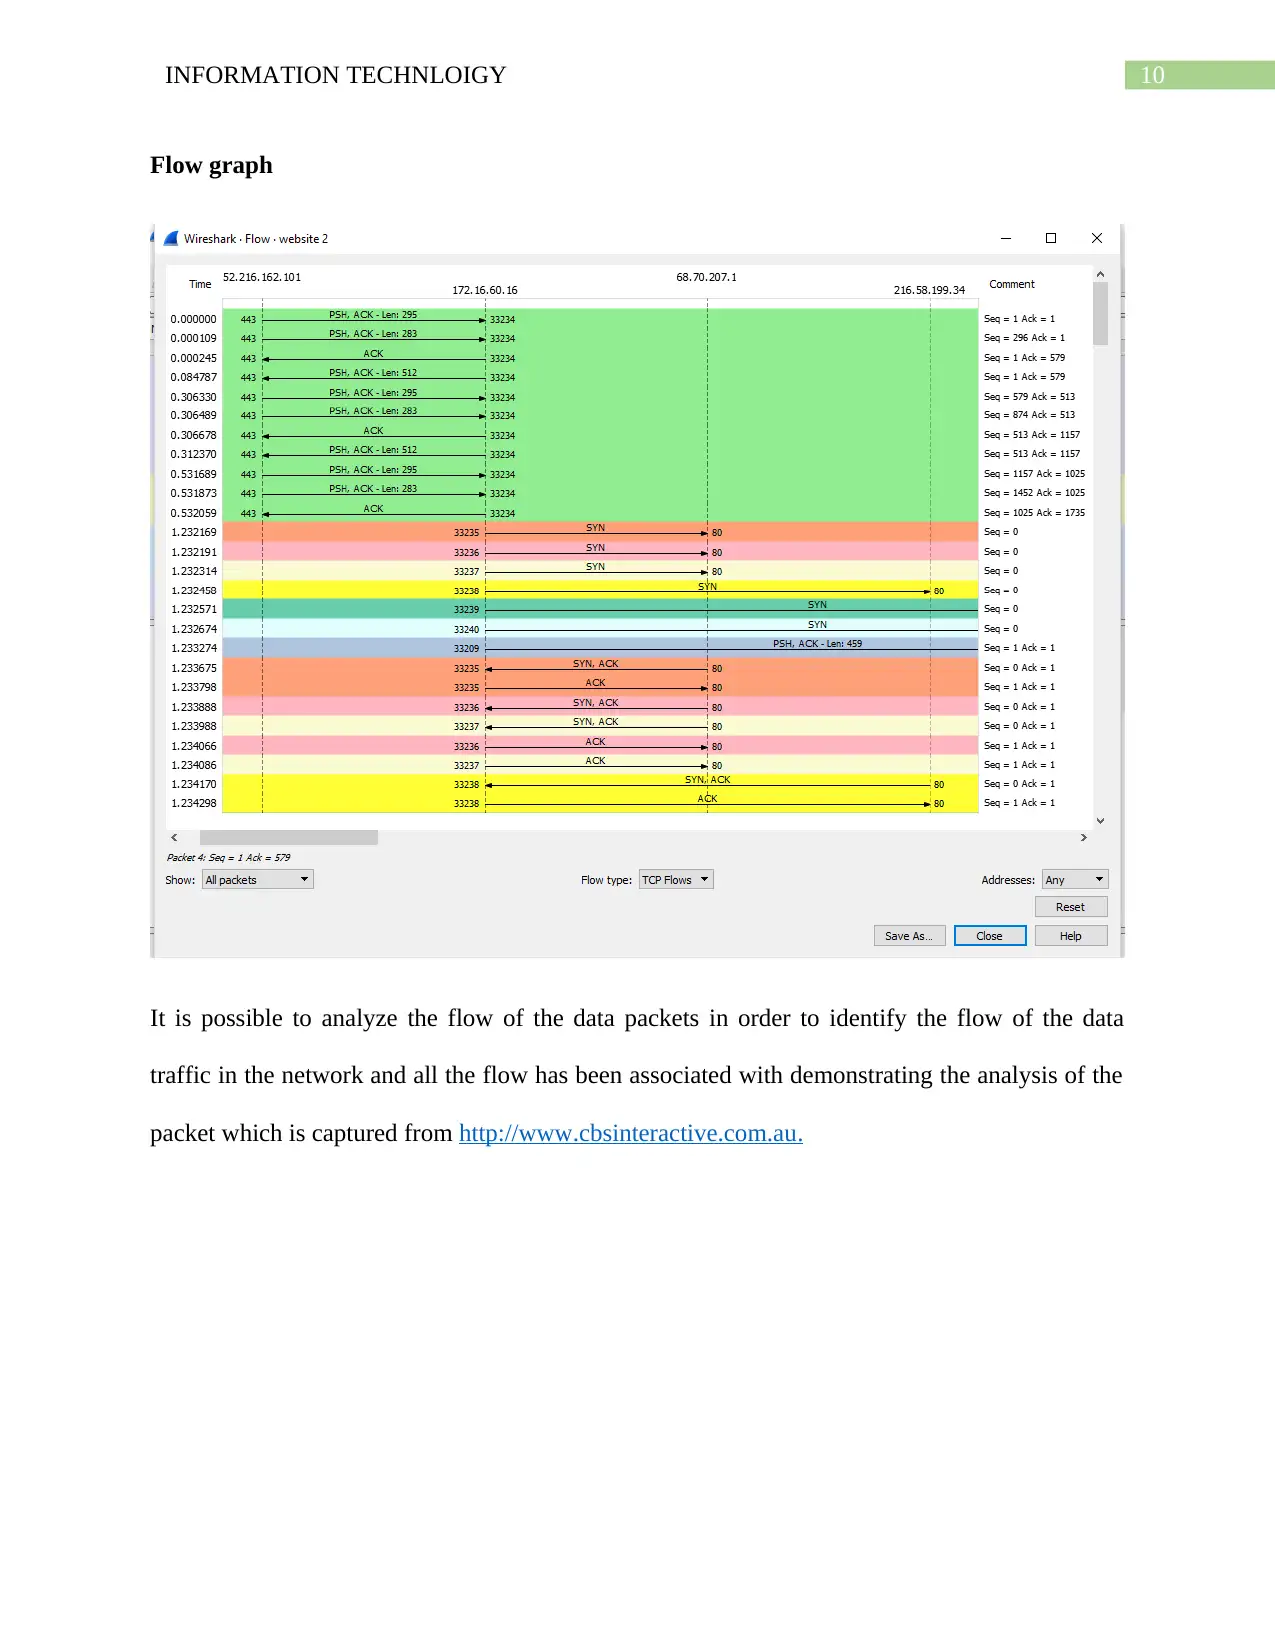
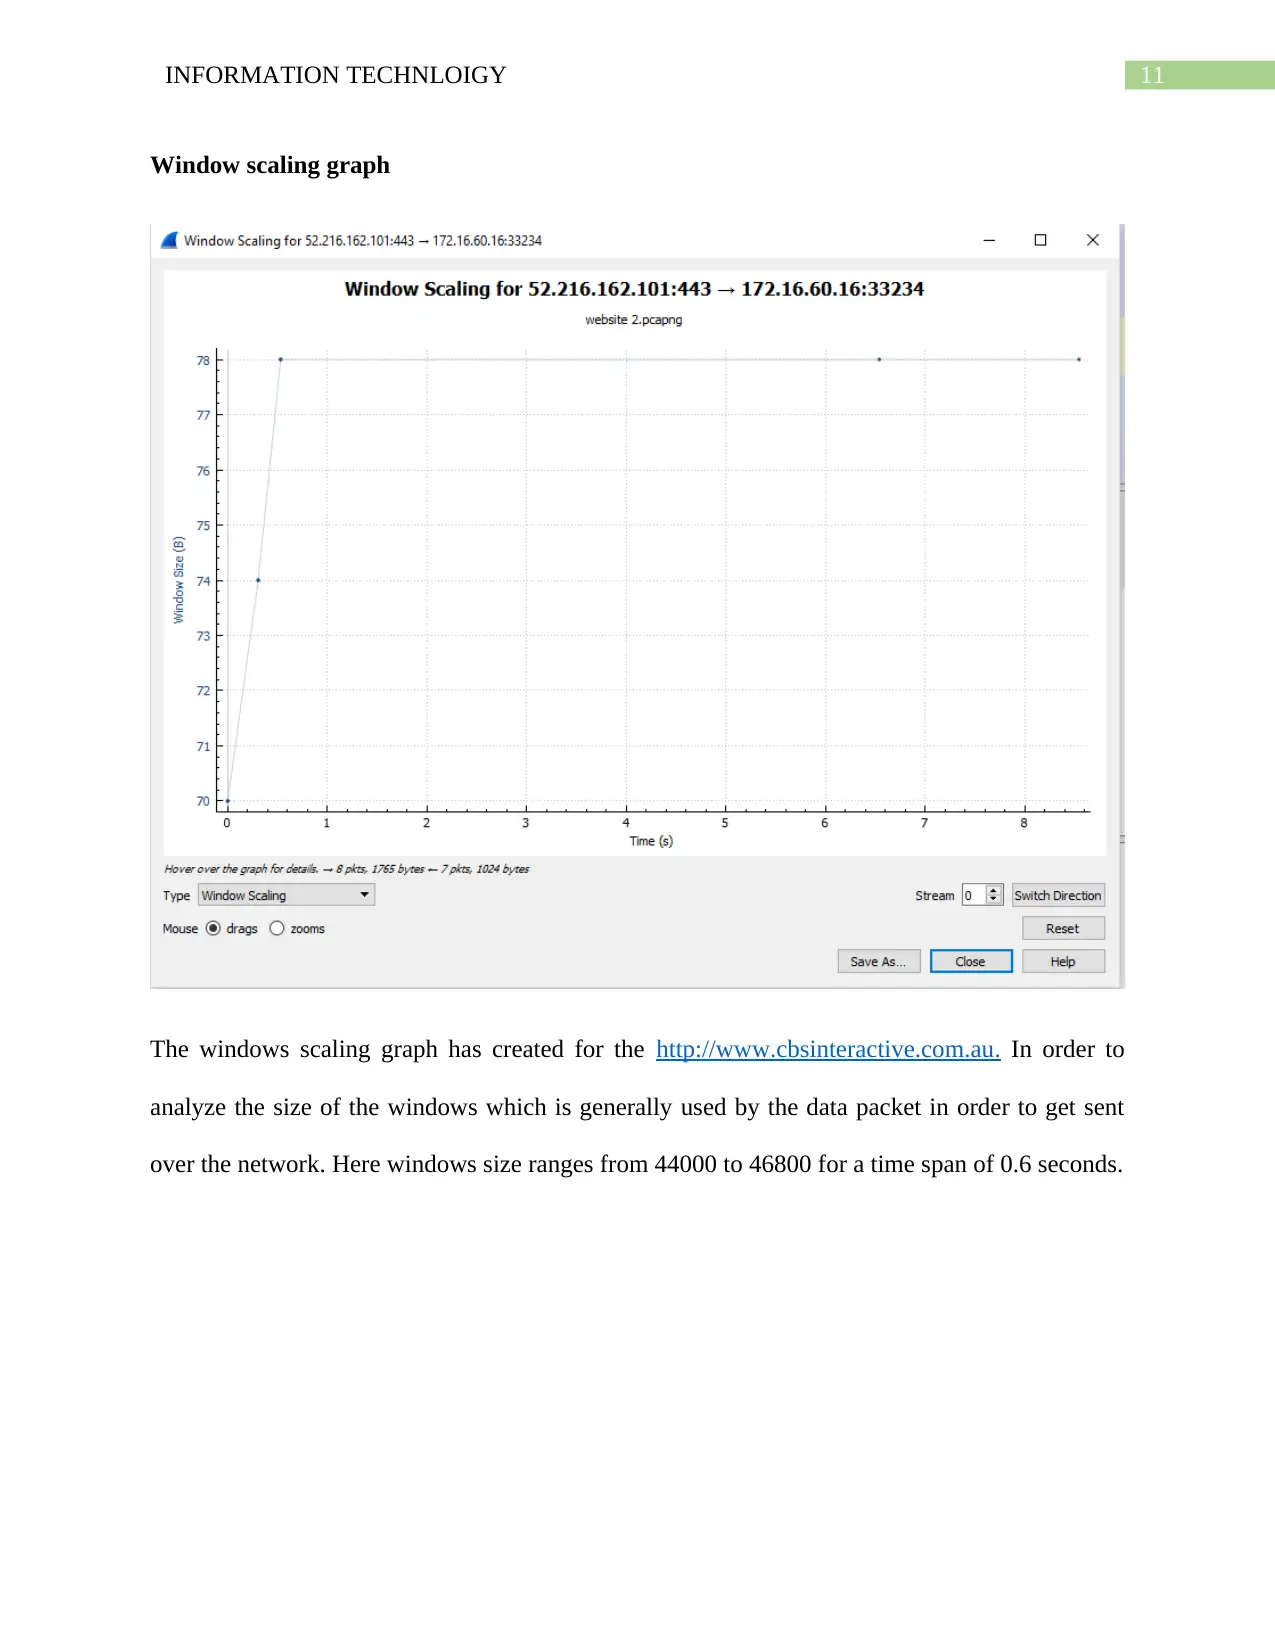
This report provides a comparative analysis of three websites using Wireshark packet capture to assess their performance. The analysis includes load distribution, throughput, time sequence, flow graphs, and window scaling graphs. The study investigates HTTP and TCP packets, focusing on server response times, data packet flow between client and server, and window sizes. A separate analysis of audio delivery from a website is also conducted, examining throughput and time sequence graphs. The report concludes that Wireshark is a valuable tool for analyzing network performance, identifying vulnerabilities, and troubleshooting network issues by capturing live packets, filtering data, and generating statistics.
Document Page
Running head: INFORMATION TECHNLOIGY
Information technology
[Name of the student]
[Name of the University]
[Author note]
tabler-icon-diamond-filled.svg

Paraphrase This Document

Need a fresh take? Get an instant paraphrase of this document with our AI Paraphraser
Document Page
1INFORMATION TECHNLOIGY
Introduction:
The main purpose of creating this report includes the comparison between the three websites
which is to be done in the task one whereas in task two the load distribution has been analyzed
along with the throughput, time sequence, flow graph and the windows scaling graph as well.
The wireshark packet capture has been enabled on the websites which are visited in order to
analyze the performance of the website along with finding the distribution of the load. After this
the port numbers as well as the synchronizing messages are also analyzed in order to find out the
flow of the data traffic inside the network. Besides this various kinds of filters are used in order
to analyze the transmission of the data. The sending and receiving of the data packets is
generally done by the IP addresses and the source ports. The data packets are analyzed in order
to measure the performance of the network. After the analysis is completed a general overview
of the load on the server is is provided along with the response time that is required for getting
the acknowledgement. Network administrators can use this wireshark for the purpose of
analyzing the performance of the network. Along with this the security problems as well as the
other problems can also be analyzed associated with learning about the various kind of protocols.
The contents of the packets captured from the network is examined and different media and
interface can be used for the capturing of the live data packets from the network.
Task 1:
In this section the major task is to investigate the website and analyze the http and the tcp packet.
The major three websites which have been analyzed in order to generate the load distribution,
throughput, time sequence, flow graph and the windows scaling graph. The three websites have
been listed below:
Document Page
2INFORMATION TECHNLOIGY
http://www.onlinenewspapers.com/australi.htm,
http://www.cbsinteractive.com.au,
http://www.newspapers.com.au/
Analysis of the website http://www.onlinenewspapers.com/australi.htm
Load Distribution
The load distribution is generally used for the purpose of analyzing the load from the http packet
that is captured for the network. The analysis of the load distribution has been done by analyzing
the response time of the server along with the load on the server which is given as percentage.
Throughput Graph
Document Page
3INFORMATION TECHNLOIGY
The figure which has been shown above is associated with depicting the throughput graph
generated from the packet captured for http://www.onlinenewspapers.com/australi.htm. The
graph is created based on the segment length and the time.
Time Sequence Graph
tabler-icon-diamond-filled.svg

Paraphrase This Document

Need a fresh take? Get an instant paraphrase of this document with our AI Paraphraser
Document Page
4INFORMATION TECHNLOIGY
After the throughput graph time sequence graph has been generated for the
http://www.onlinenewspapers.com/australi.htm in order to analyze the sequence number with
respect to the time. The TCP packet are used for the generation of the time sequence graph.
Flow Graph
Document Page
5INFORMATION TECHNLOIGY
The flow graph is created in order to analyse the flow of the data packets between the client and
the server and it is also associate with showing the hops that are used for sending the message to
the destination address.
Window Scaling Graph
Document Page
6INFORMATION TECHNLOIGY
The windows scaling graph is created for the website
http://www.onlinenewspapers.com/australi.htm in order to analyze the size of the windows
which is generally is used by the data packet which is to be sent over the network.
Analysis of the website http://www.cbsinteractive.com.au/
tabler-icon-diamond-filled.svg

Paraphrase This Document

Need a fresh take? Get an instant paraphrase of this document with our AI Paraphraser
Document Page
7INFORMATION TECHNLOIGY
Load Distribution
The load which is present on the server has been analyzed and this has been done by taking help
from the load distribution options which is fetched from the statistic option present in the
wireshark. The load distribution is analyzed which is generally based upon the http packets
captured for http://www.cbsinteractive.com.au.
Document Page
8INFORMATION TECHNLOIGY
Throughput graph
The throughput graph has been created and from the graph it is possible to analyze the fact that
the that the throughput is not stable and the reason lying behind this might be the unstable
transfer of files or network connectivity problem.
Document Page
9INFORMATION TECHNLOIGY
Time Sequence graph
This is generally used for the purpose of analyzing the sequence number of the tcp packets which
generally ranges from 0 to 700000 for a time duration of 0.6 second.
tabler-icon-diamond-filled.svg

Paraphrase This Document

Need a fresh take? Get an instant paraphrase of this document with our AI Paraphraser
Document Page
10INFORMATION TECHNLOIGY
Flow graph
It is possible to analyze the flow of the data packets in order to identify the flow of the data
traffic in the network and all the flow has been associated with demonstrating the analysis of the
packet which is captured from http://www.cbsinteractive.com.au.
Document Page
11INFORMATION TECHNLOIGY
Window scaling graph
The windows scaling graph has created for the http://www.cbsinteractive.com.au. In order to
analyze the size of the windows which is generally used by the data packet in order to get sent
over the network. Here windows size ranges from 44000 to 46800 for a time span of 0.6 seconds.
chevron_up_icon
1 out of 21
circle_padding
hide_on_mobile
zoom_out_icon
[object Object]