Network Performance Analysis of Applications using Wireshark Tool
VerifiedAdded on 2023/06/11
|16
|1577
|72
Report
AI Summary
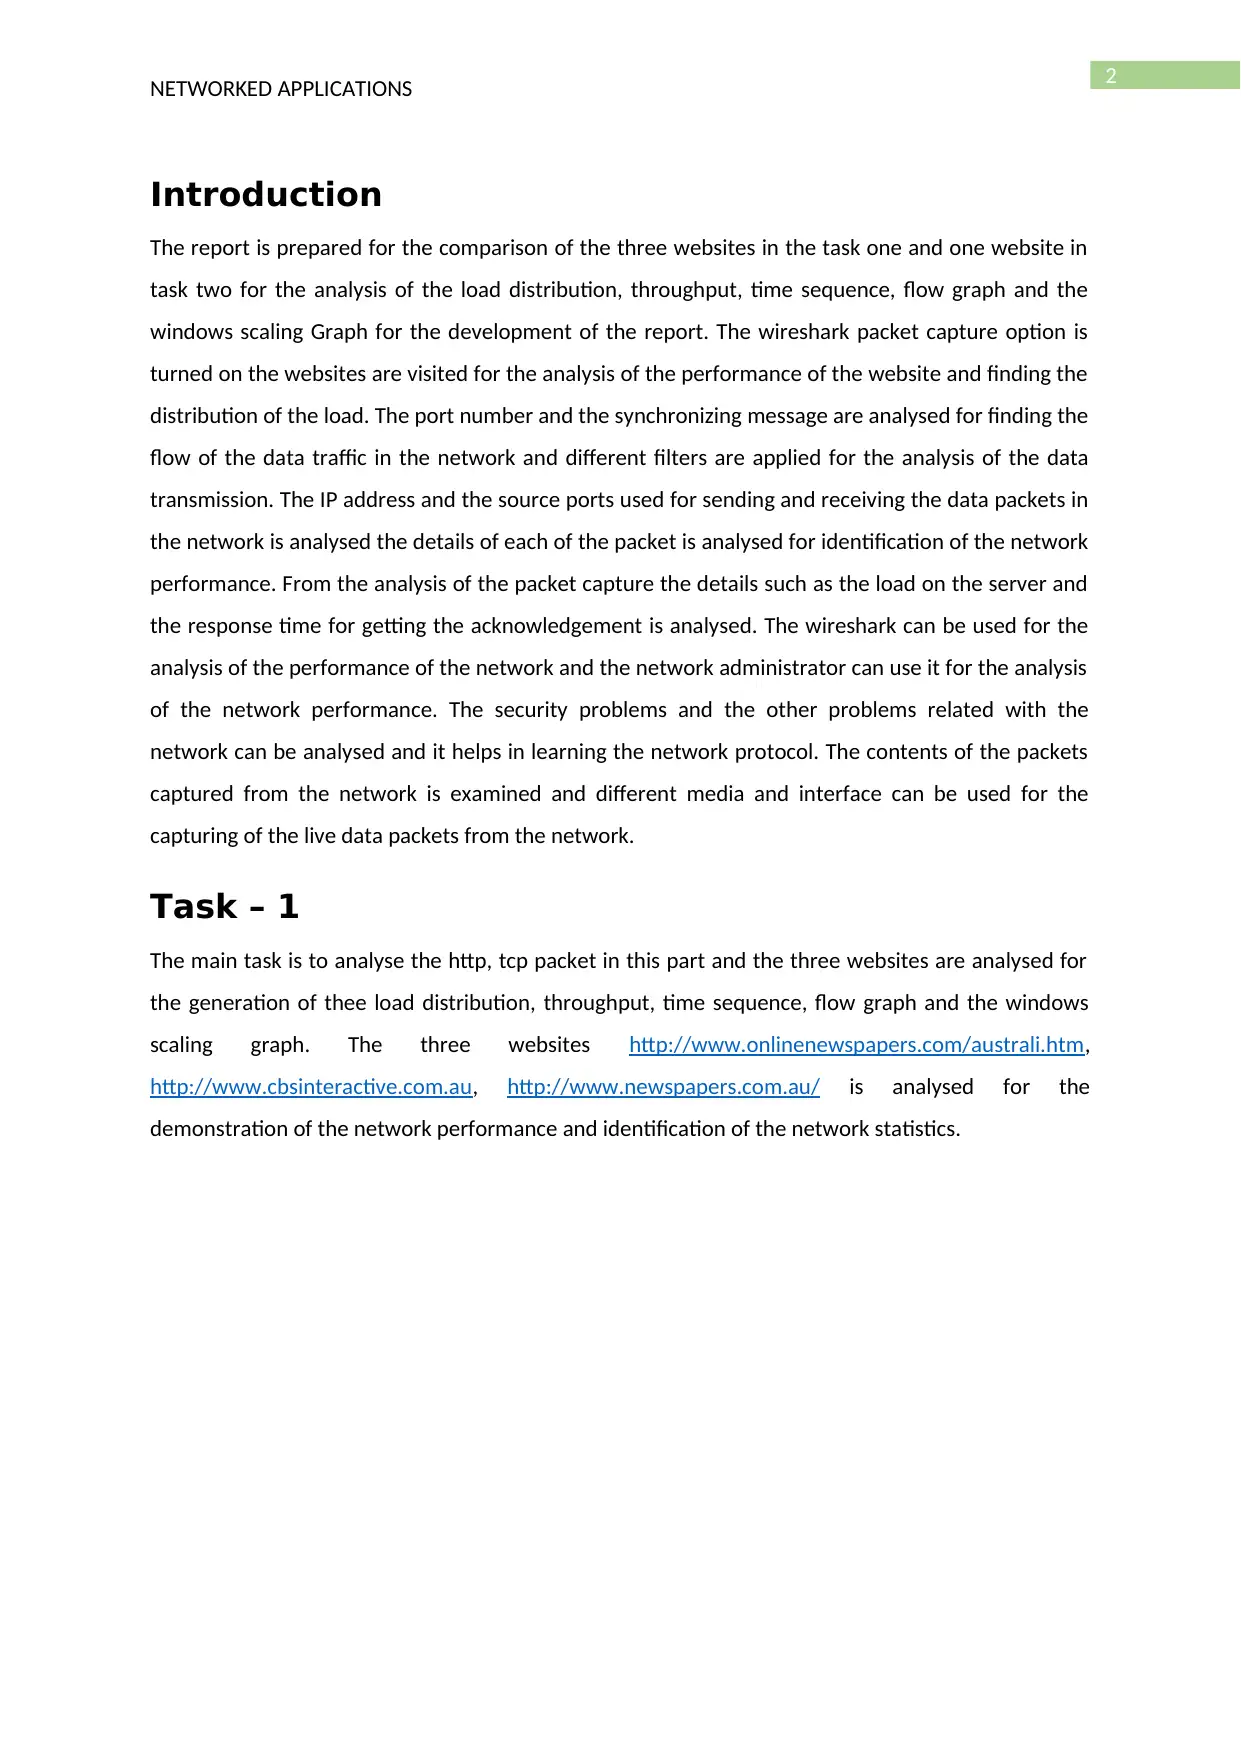
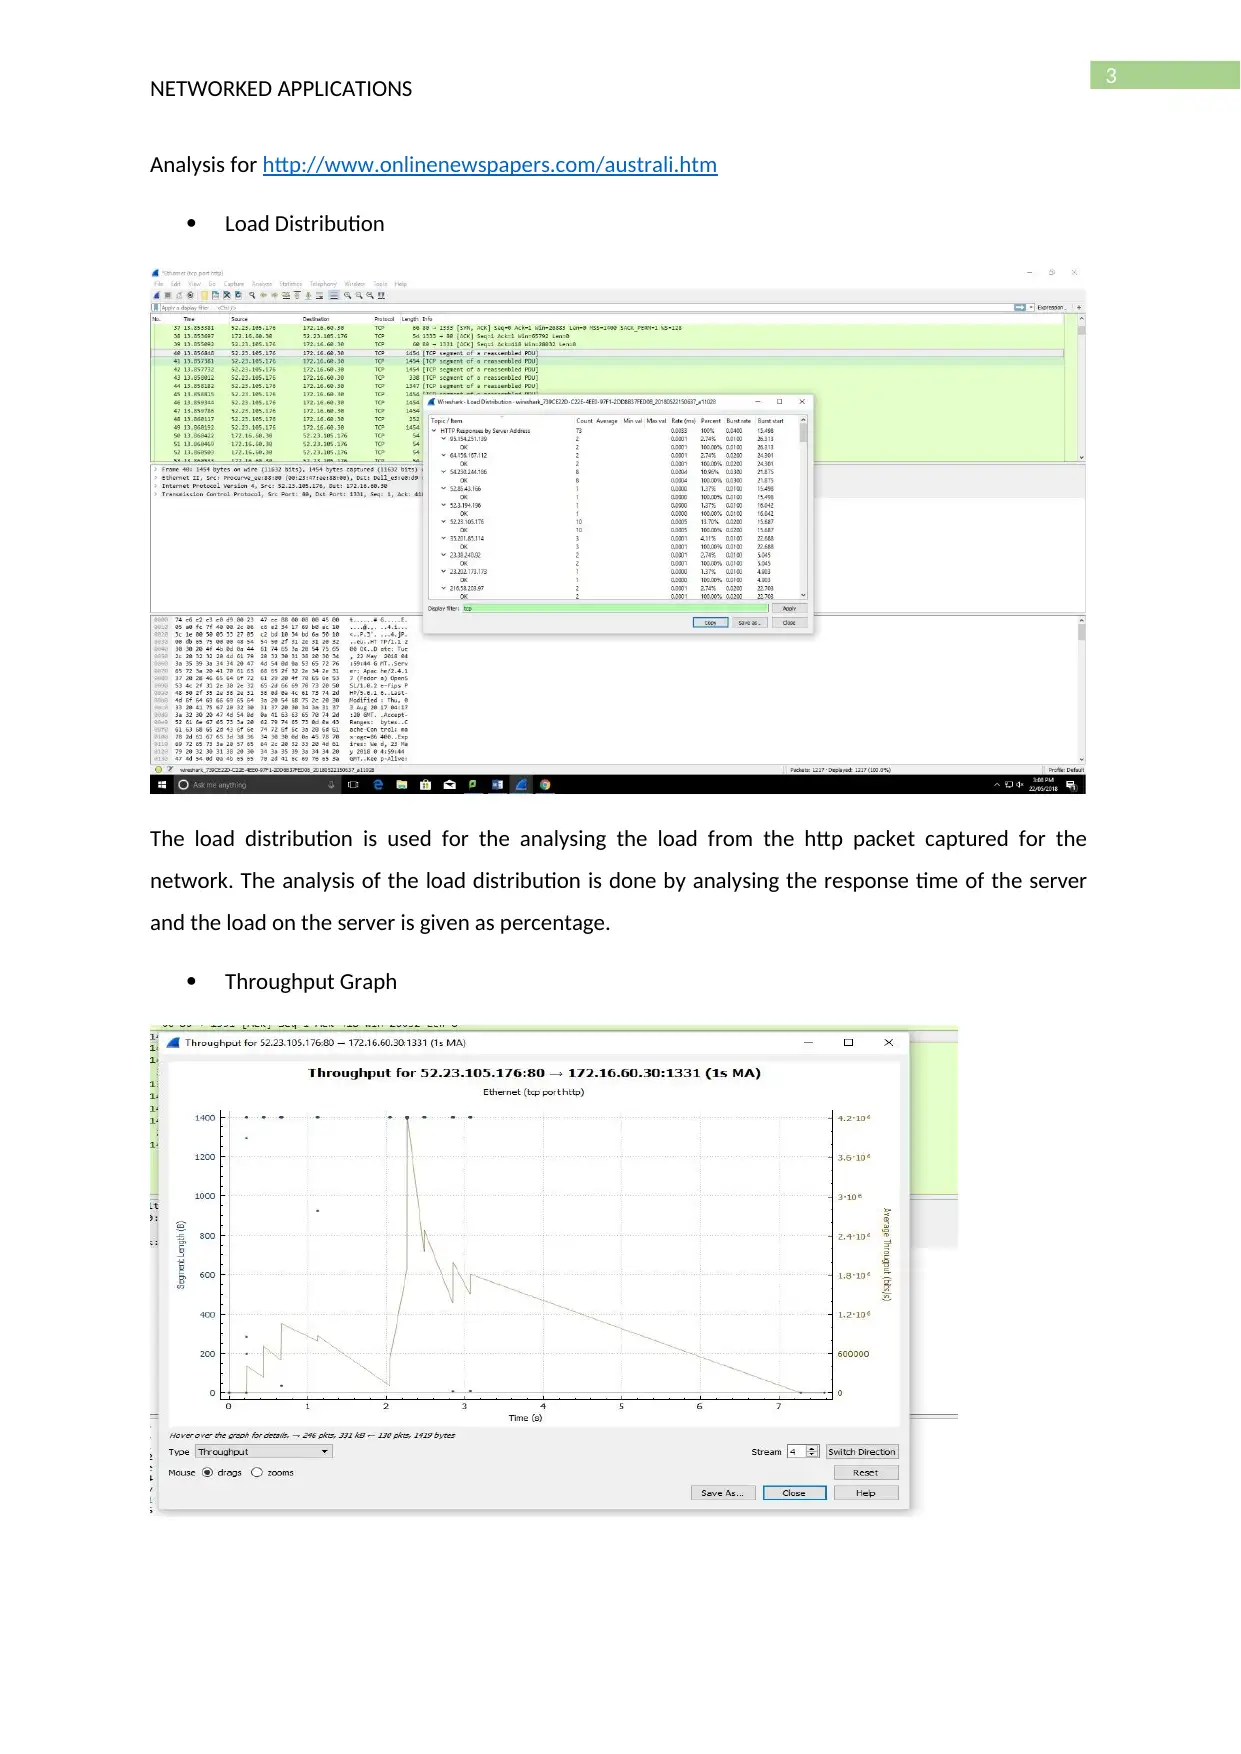
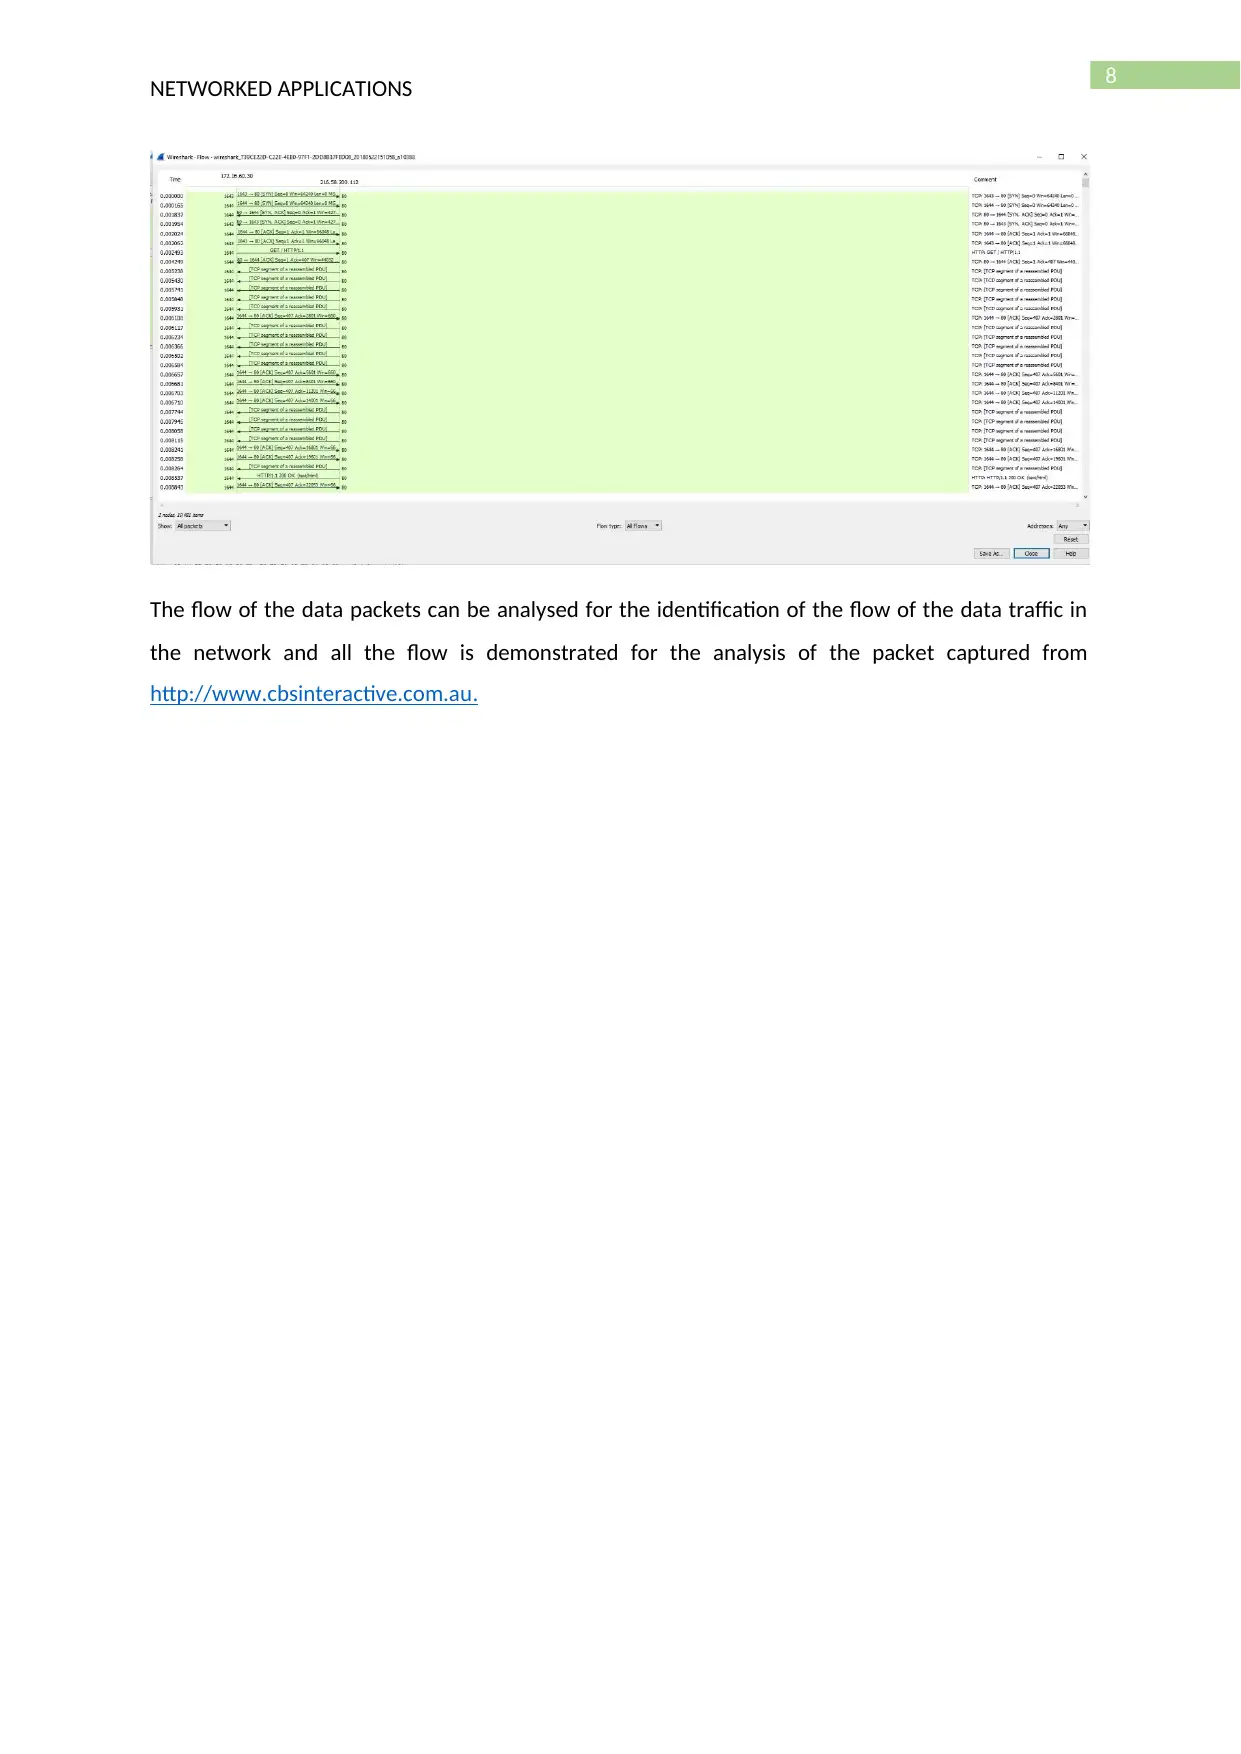
This report provides a detailed analysis of network performance for various web applications using Wireshark. It examines HTTP and TCP packets to evaluate load distribution, throughput, time sequence, flow graphs, and window scaling. The analysis includes three websites (http://www.cbsinteractive.com.au, http://www.onlinenewspapers.com/australi.htm, http://www.newspapers.com.au/) and an investigation into audio delivery from http://www.abc.net.au/radio/listen-online. The report highlights how Wireshark can be used to capture and analyze network traffic, identify potential security vulnerabilities, and troubleshoot network issues, ultimately improving network efficiency and performance. The study concludes that network performance analysis helps in understanding data traffic flow and optimizing network protocols.

Running head: NETWORKED APPLICATIONS
Analyse Network Performance
Name of the Student
Name of the University
Author’s Note
Analyse Network Performance
Name of the Student
Name of the University
Author’s Note
Paraphrase This Document
Need a fresh take? Get an instant paraphrase of this document with our AI Paraphraser

1
NETWORKED APPLICATIONS
Table of Contents
Introduction...........................................................................................................................................2
Task – 1..................................................................................................................................................2
Task – 2................................................................................................................................................13
Conclusion...........................................................................................................................................14
Bibliography.........................................................................................................................................15

2
NETWORKED APPLICATIONS
Introduction
The report is prepared for the comparison of the three websites in the task one and one website in
task two for the analysis of the load distribution, throughput, time sequence, flow graph and the
windows scaling Graph for the development of the report. The wireshark packet capture option is
turned on the websites are visited for the analysis of the performance of the website and finding the
distribution of the load. The port number and the synchronizing message are analysed for finding the
flow of the data traffic in the network and different filters are applied for the analysis of the data
transmission. The IP address and the source ports used for sending and receiving the data packets in
the network is analysed the details of each of the packet is analysed for identification of the network
performance. From the analysis of the packet capture the details such as the load on the server and
the response time for getting the acknowledgement is analysed. The wireshark can be used for the
analysis of the performance of the network and the network administrator can use it for the analysis
of the network performance. The security problems and the other problems related with the
network can be analysed and it helps in learning the network protocol. The contents of the packets
captured from the network is examined and different media and interface can be used for the
capturing of the live data packets from the network.
Task – 1
The main task is to analyse the http, tcp packet in this part and the three websites are analysed for
the generation of thee load distribution, throughput, time sequence, flow graph and the windows
scaling graph. The three websites http://www.onlinenewspapers.com/australi.htm,
http://www.cbsinteractive.com.au, http://www.newspapers.com.au/ is analysed for the
demonstration of the network performance and identification of the network statistics.
⊘ This is a preview!⊘
Do you want full access?
Subscribe today to unlock all pages.

Trusted by 1+ million students worldwide

3
NETWORKED APPLICATIONS
Analysis for http://www.onlinenewspapers.com/australi.htm
Load Distribution
The load distribution is used for the analysing the load from the http packet captured for the
network. The analysis of the load distribution is done by analysing the response time of the server
and the load on the server is given as percentage.
Throughput Graph
Paraphrase This Document
Need a fresh take? Get an instant paraphrase of this document with our AI Paraphraser

4
NETWORKED APPLICATIONS
The above figure shows the throughput graph generated from the packet captured for
http://www.onlinenewspapers.com/australi.htm. The graph is created based on the segment length
and the time.
Time Sequence Graph
The time sequence graph is generated for the http://www.onlinenewspapers.com/australi.htm for
the analysis of the sequence number with respect to the time. The TCP packet are used for the
generation of the time sequence graph.
Flow Graph

5
NETWORKED APPLICATIONS
The flow graph is created for the analysis of the flow of the data packets between the client and the
server and it shows the hops used for sending the message to the destination address.
Window Scaling Graph
The windows scaling graph is created for the http://www.onlinenewspapers.com/australi.htm for
the analysis of the windows size that is used by the data packet to be sent over the network.
⊘ This is a preview!⊘
Do you want full access?
Subscribe today to unlock all pages.

Trusted by 1+ million students worldwide

6
NETWORKED APPLICATIONS
Analysis for http://www.cbsinteractive.com.au
Load Distribution
The load on the server is analysed from the load distribution options that can be fetched from the
statistic option in the wireshark. The load distribution is analysed based on the http packets captured
for http://www.cbsinteractive.com.au.
Throughput graph
Paraphrase This Document
Need a fresh take? Get an instant paraphrase of this document with our AI Paraphraser

7
NETWORKED APPLICATIONS
The throughput graph is created and from the graph it ca be analysed that the throughput is not
stable and the reason can be unstable transfer of files or network connectivity problem.
Time Sequence graph
It is used for the analysis of the sequence number of the tcp packets and it ranges from 0 to 700000
for a time duration of 0.6 second.
Flow graph

8
NETWORKED APPLICATIONS
The flow of the data packets can be analysed for the identification of the flow of the data traffic in
the network and all the flow is demonstrated for the analysis of the packet captured from
http://www.cbsinteractive.com.au.
NETWORKED APPLICATIONS
The flow of the data packets can be analysed for the identification of the flow of the data traffic in
the network and all the flow is demonstrated for the analysis of the packet captured from
http://www.cbsinteractive.com.au.
⊘ This is a preview!⊘
Do you want full access?
Subscribe today to unlock all pages.

Trusted by 1+ million students worldwide

9
NETWORKED APPLICATIONS
Window scaling graph
The windows scaling graph is created for the http://www.cbsinteractive.com.au. for the analysis of
the windows size that is used by the data packet to be sent over the network. Here windows size
ranges from 44000 to 46800 for a time span of 0.6 seconds.
NETWORKED APPLICATIONS
Window scaling graph
The windows scaling graph is created for the http://www.cbsinteractive.com.au. for the analysis of
the windows size that is used by the data packet to be sent over the network. Here windows size
ranges from 44000 to 46800 for a time span of 0.6 seconds.
Paraphrase This Document
Need a fresh take? Get an instant paraphrase of this document with our AI Paraphraser

10
NETWORKED APPLICATIONS
Analysis for http://www.newspapers.com.au/
Load Distribution
The url http://www.newspapers.com.au/ is used for the analysis of the load on the server and tcp
display filter is used for the analysis of the load.
Throughput graph
NETWORKED APPLICATIONS
Analysis for http://www.newspapers.com.au/
Load Distribution
The url http://www.newspapers.com.au/ is used for the analysis of the load on the server and tcp
display filter is used for the analysis of the load.
Throughput graph

11
NETWORKED APPLICATIONS
The through put of the server is analysed for the http://www.newspapers.com.au/ and the graph
shows the average response time of the server.
Time Sequence graph
The sequence graph is analysed for the analysis of the sequence number with respect to the time.
Flow graph
NETWORKED APPLICATIONS
The through put of the server is analysed for the http://www.newspapers.com.au/ and the graph
shows the average response time of the server.
Time Sequence graph
The sequence graph is analysed for the analysis of the sequence number with respect to the time.
Flow graph
⊘ This is a preview!⊘
Do you want full access?
Subscribe today to unlock all pages.

Trusted by 1+ million students worldwide
1 out of 16
Related Documents

Your All-in-One AI-Powered Toolkit for Academic Success.
+13062052269
info@desklib.com
Available 24*7 on WhatsApp / Email
Unlock your academic potential
Copyright © 2020–2025 A2Z Services. All Rights Reserved. Developed and managed by ZUCOL.