CP5631 Network Design: Expanding Australian Data Analytics Company
VerifiedAdded on 2023/06/12
|16
|2905
|105
Report
AI Summary
This report presents a comprehensive network assessment and redesign for an Australian data analytics company expanding with new branches. The project encompasses network design, IP address allocation through subnetting, hardware device selection, budget estimation, and cloud computing proposal analysis. Objectives include enabling internet access, wireless LAN, database sharing, web services, data backup, and cloud service utilization. The report details subnetting calculations for various locations (Sydney, Melbourne, Brisbane, Canberra, Adelaide, and Hobart), IP address assignments, subnet masks, and address ranges. It also includes a weighted decision matrix for selecting appropriate network devices (routers, switches, and wireless access points) based on feasibility, efficiency, number of ports, durability, and cost. Furthermore, the report explores cloud computing options and provides recommendations for network implementation. Desklib offers a wealth of similar solved assignments and past papers to aid students in their studies.

1PART 1 - Executive summary
Network Assessment and Designing
NETWORK ASSESSMENT AND DESIGNING
By (Student’s names)
[Class Name]
[Professors’ Name]
[University’s Name]
[City and town where the university is located]
[Date]
Network Assessment and Designing
NETWORK ASSESSMENT AND DESIGNING
By (Student’s names)
[Class Name]
[Professors’ Name]
[University’s Name]
[City and town where the university is located]
[Date]
Paraphrase This Document
Need a fresh take? Get an instant paraphrase of this document with our AI Paraphraser
2PART 1 - Executive summary
Network Assessment and Designing
Table of Contents
1 PART 1 - Executive summary..................................................................................................2
2 PART 2 - Network diagram.....................................................................................................3
3 PART 3 – Sub-netting the network and assigning IP addresses to devices............................3
3.1 Sub-netting........................................................................................................................4
4 PART 4 - Researching and sourcing appropriate devices........................................................9
4.1 Executive summary...........................................................................................................9
4.2 Weighted Decision Matrix - hardware resource requirements analysis...........................9
4.3 Budget.............................................................................................................................11
5 PART 5 - Cloud computing proposal.....................................................................................11
5.1 Using desktop Environment provided by a Cloud service provider (such as Amazon). 12
5.2 Using desktop environment provided by a private cloud infrastructure based in Sydney
12
5.3 Continuing to use workstations.......................................................................................12
5.4 Recommendation............................................................................................................13
6 Reference................................................................................................................................13
3PART 1 - Executive summary
Network Assessment and Designing
1 PART 1 - Executive summary
This report cover the Australian data analytic company that requires the assessment of the
current network so that it can be re-designed in order to accommodate the newly opened braches
which need new equipments.
The main purpose of this project is to design the network, allocate IP addresses to the various
subnets, and calculate the expected budget to implement the entire network.
This project has a large scope where it involves the sub-netting of the proposed network
branches by assigning respective IP addresses, identification of the hardware devices to be used,
approximation of the network budget and analyzing the various cloud computing proposals and
through this the management will be able to identify the best way to implement the network.
This project had been carried out in order to achieve some set objectives by the company which
includes the following:
i. Enable the company have internet access.
ii. To enable the company wide local area network to have wireless access.
iii. To enable the share the database facilities.
iv. To enable the company have the web services to the users.
v. To enable the network users back up their information.
vi. To enable the company to make use of the cloud based services in their operations.
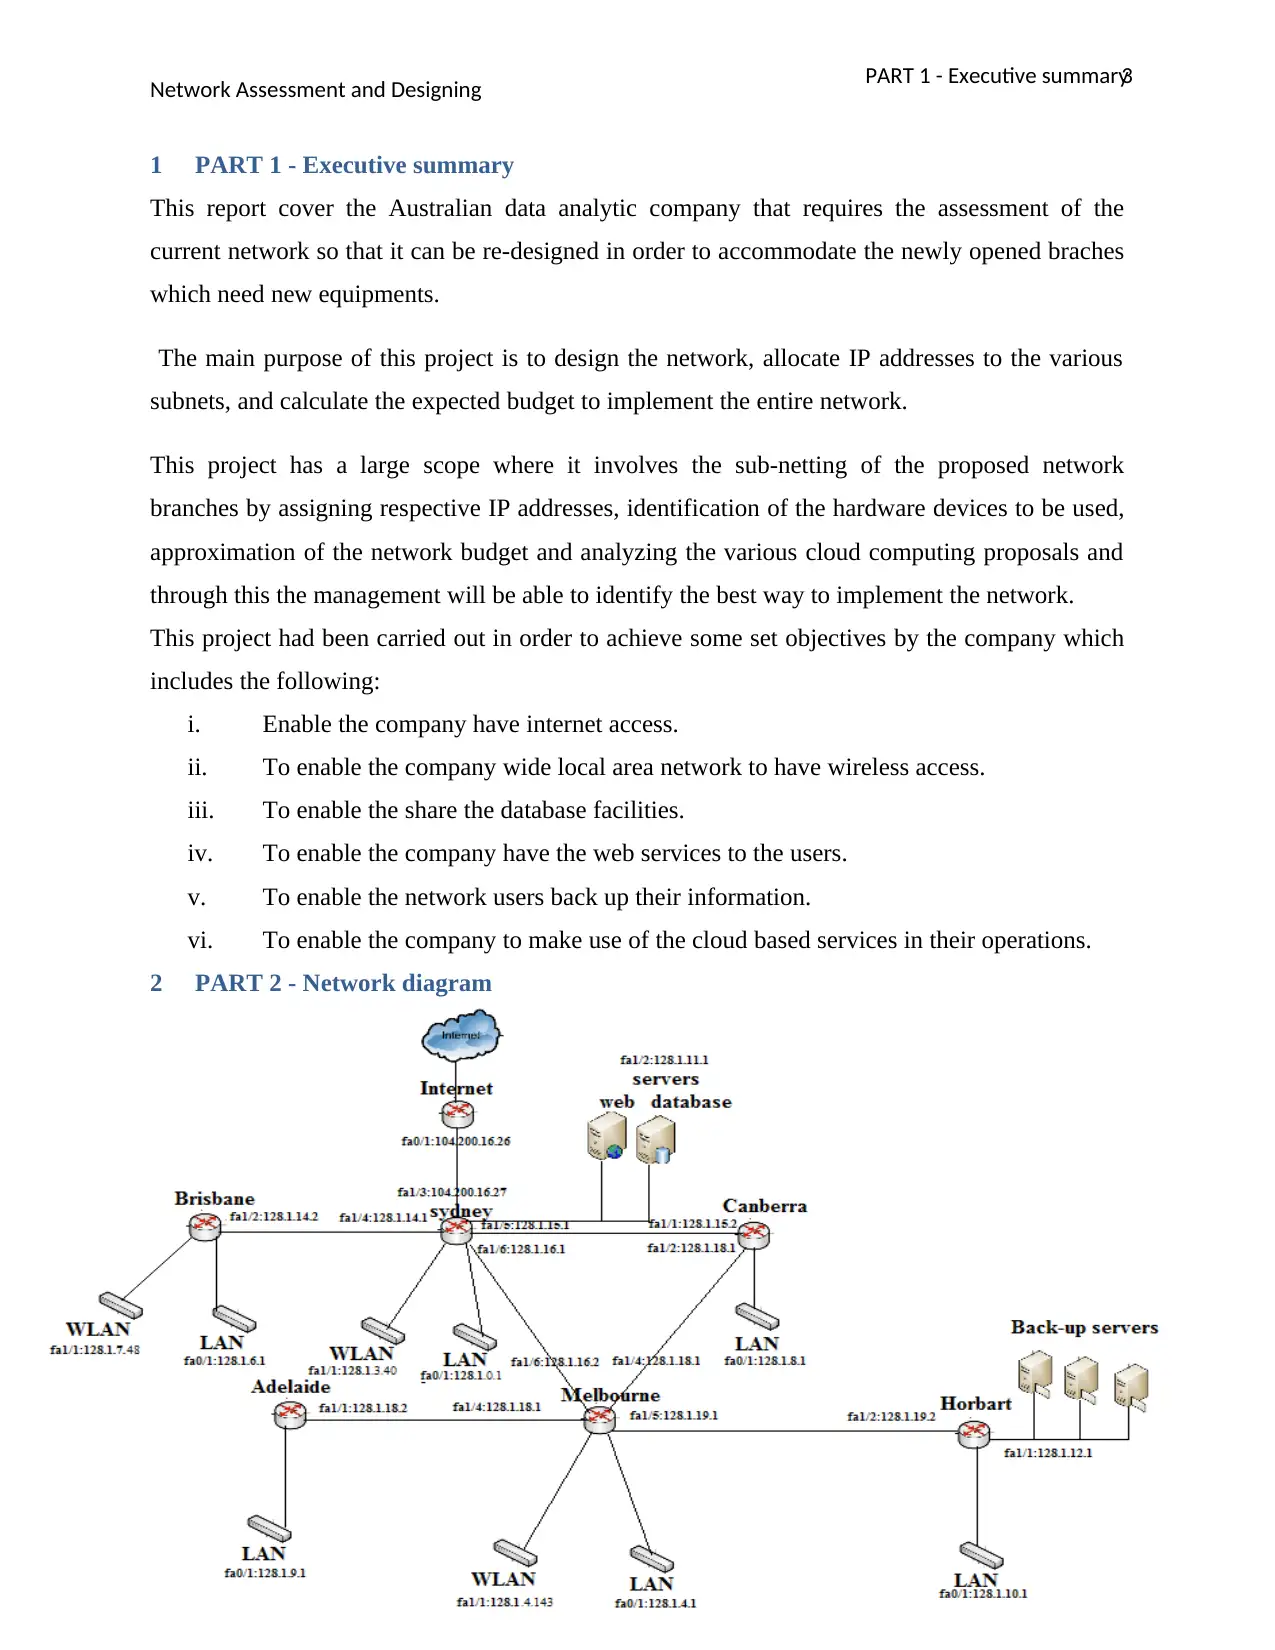
2 PART 2 - Network diagram
Network Assessment and Designing
1 PART 1 - Executive summary
This report cover the Australian data analytic company that requires the assessment of the
current network so that it can be re-designed in order to accommodate the newly opened braches
which need new equipments.
The main purpose of this project is to design the network, allocate IP addresses to the various
subnets, and calculate the expected budget to implement the entire network.
This project has a large scope where it involves the sub-netting of the proposed network
branches by assigning respective IP addresses, identification of the hardware devices to be used,
approximation of the network budget and analyzing the various cloud computing proposals and
through this the management will be able to identify the best way to implement the network.
This project had been carried out in order to achieve some set objectives by the company which
includes the following:
i. Enable the company have internet access.
ii. To enable the company wide local area network to have wireless access.
iii. To enable the share the database facilities.
iv. To enable the company have the web services to the users.
v. To enable the network users back up their information.
vi. To enable the company to make use of the cloud based services in their operations.
2 PART 2 - Network diagram
⊘ This is a preview!⊘
Do you want full access?
Subscribe today to unlock all pages.
Trusted by 1+ million students worldwide
4PART 1 - Executive summary
Network Assessment and Designing
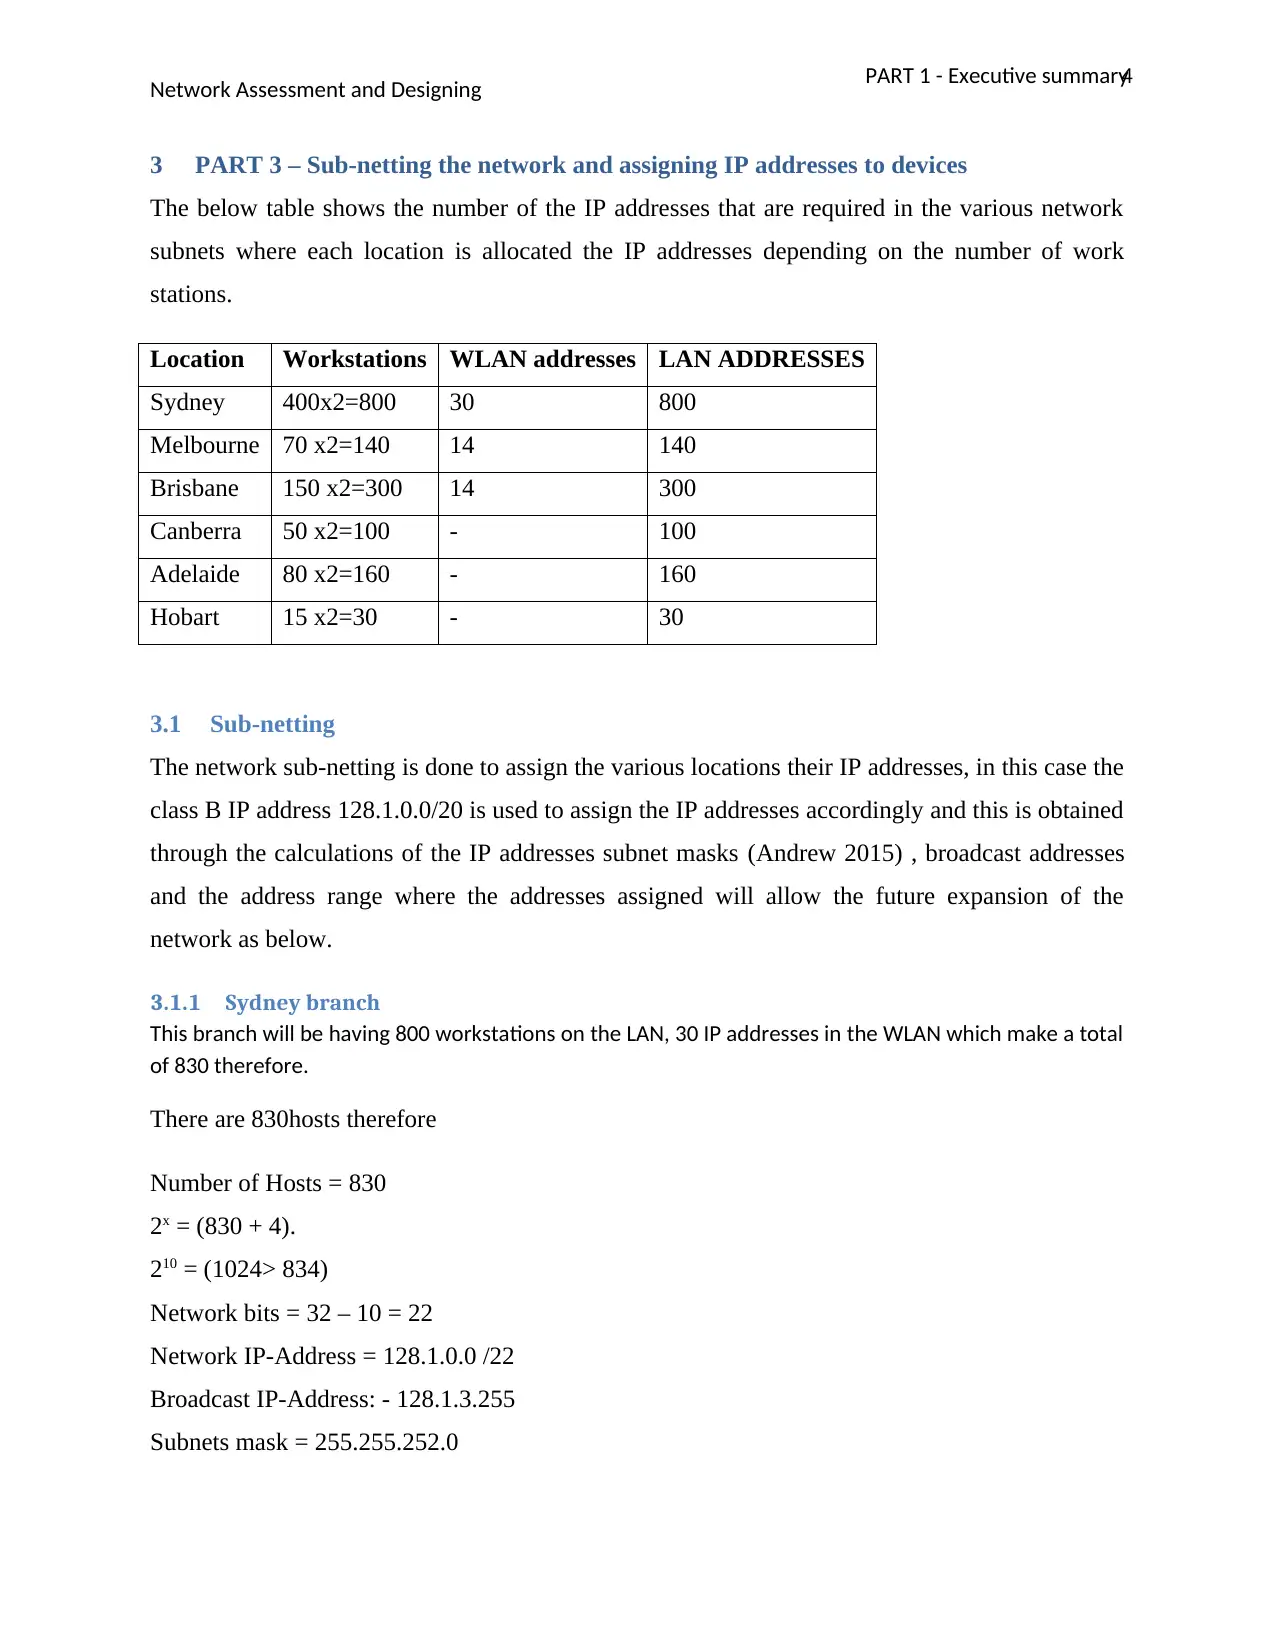
3 PART 3 – Sub-netting the network and assigning IP addresses to devices
The below table shows the number of the IP addresses that are required in the various network
subnets where each location is allocated the IP addresses depending on the number of work
stations.
Location Workstations WLAN addresses LAN ADDRESSES
Sydney 400x2=800 30 800
Melbourne 70 x2=140 14 140
Brisbane 150 x2=300 14 300
Canberra 50 x2=100 - 100
Adelaide 80 x2=160 - 160
Hobart 15 x2=30 - 30
3.1 Sub-netting
The network sub-netting is done to assign the various locations their IP addresses, in this case the
class B IP address 128.1.0.0/20 is used to assign the IP addresses accordingly and this is obtained
through the calculations of the IP addresses subnet masks (Andrew 2015) , broadcast addresses
and the address range where the addresses assigned will allow the future expansion of the
network as below.
3.1.1 Sydney branch
This branch will be having 800 workstations on the LAN, 30 IP addresses in the WLAN which make a total
of 830 therefore.
There are 830hosts therefore
Number of Hosts = 830
2x = (830 + 4).
210 = (1024> 834)
Network bits = 32 – 10 = 22
Network IP-Address = 128.1.0.0 /22
Broadcast IP-Address: - 128.1.3.255
Subnets mask = 255.255.252.0
Network Assessment and Designing
3 PART 3 – Sub-netting the network and assigning IP addresses to devices
The below table shows the number of the IP addresses that are required in the various network
subnets where each location is allocated the IP addresses depending on the number of work
stations.
Location Workstations WLAN addresses LAN ADDRESSES
Sydney 400x2=800 30 800
Melbourne 70 x2=140 14 140
Brisbane 150 x2=300 14 300
Canberra 50 x2=100 - 100
Adelaide 80 x2=160 - 160
Hobart 15 x2=30 - 30
3.1 Sub-netting
The network sub-netting is done to assign the various locations their IP addresses, in this case the
class B IP address 128.1.0.0/20 is used to assign the IP addresses accordingly and this is obtained
through the calculations of the IP addresses subnet masks (Andrew 2015) , broadcast addresses
and the address range where the addresses assigned will allow the future expansion of the
network as below.
3.1.1 Sydney branch
This branch will be having 800 workstations on the LAN, 30 IP addresses in the WLAN which make a total
of 830 therefore.
There are 830hosts therefore
Number of Hosts = 830
2x = (830 + 4).
210 = (1024> 834)
Network bits = 32 – 10 = 22
Network IP-Address = 128.1.0.0 /22
Broadcast IP-Address: - 128.1.3.255
Subnets mask = 255.255.252.0
Paraphrase This Document
Need a fresh take? Get an instant paraphrase of this document with our AI Paraphraser
5PART 1 - Executive summary
Network Assessment and Designing
Range IP address = 128.1.0.1- 128.1.3.254
3.1.1.1 Sydney branch LAN subnet
There are 800 hosts therefore
Number of Hosts = 800
2x = (800 + 2).
210 = (1024> 802)
Network bits = 32 – 10 = 22
Network IP-Address = 128.1.0.0 /22
Broadcast IP-Address: - 128.1.3.38
Range IP address = 128.1.0.1-128.1.3.37
Subnets mask = 255.255.252.0
3.1.1.2 Sydney branch WAN subnet
There are 30 hosts therefore
Number of Hosts = 30
2x = (30 + 2).
210 = (1024> 32)
Network bits = 32 – 10 = 22
Network IP-Address = 128.1.3.39/22
Broadcast IP-Address: - 128.1.3.72
Subnets mask = 255.255.252.0
Range IP address =128.1.3.40-128.1.3.71 (Behrouz 2016).
3.1.2 Melbourne branch
This branch will be having 140 workstations on the LAN and 14 IP addresses in the WLAN which make a
total of 154 therefore.
There are 154 hosts therefore
Number of Hosts = 154
2x = (154 + 2).
28 = (256> 156)
Network Assessment and Designing
Range IP address = 128.1.0.1- 128.1.3.254
3.1.1.1 Sydney branch LAN subnet
There are 800 hosts therefore
Number of Hosts = 800
2x = (800 + 2).
210 = (1024> 802)
Network bits = 32 – 10 = 22
Network IP-Address = 128.1.0.0 /22
Broadcast IP-Address: - 128.1.3.38
Range IP address = 128.1.0.1-128.1.3.37
Subnets mask = 255.255.252.0
3.1.1.2 Sydney branch WAN subnet
There are 30 hosts therefore
Number of Hosts = 30
2x = (30 + 2).
210 = (1024> 32)
Network bits = 32 – 10 = 22
Network IP-Address = 128.1.3.39/22
Broadcast IP-Address: - 128.1.3.72
Subnets mask = 255.255.252.0
Range IP address =128.1.3.40-128.1.3.71 (Behrouz 2016).
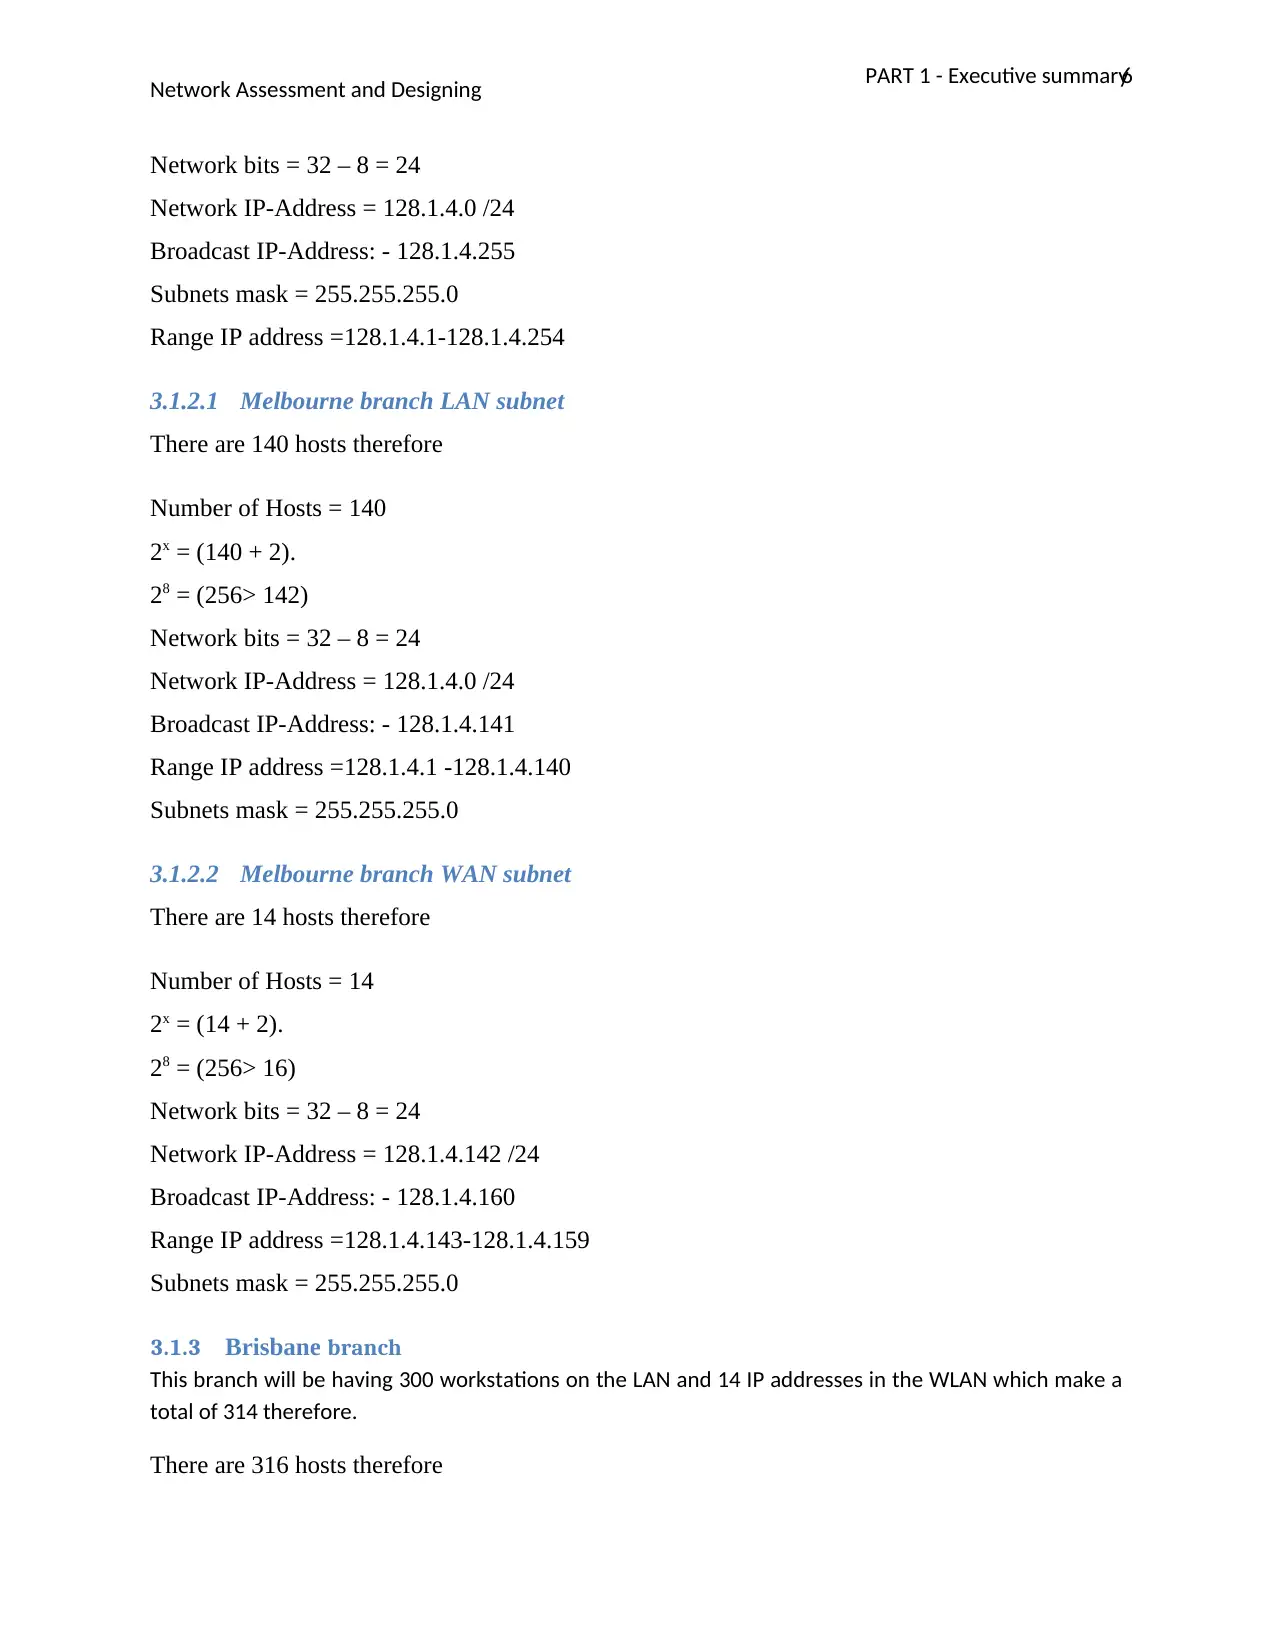
3.1.2 Melbourne branch
This branch will be having 140 workstations on the LAN and 14 IP addresses in the WLAN which make a
total of 154 therefore.
There are 154 hosts therefore
Number of Hosts = 154
2x = (154 + 2).
28 = (256> 156)
6PART 1 - Executive summary
Network Assessment and Designing
Network bits = 32 – 8 = 24
Network IP-Address = 128.1.4.0 /24
Broadcast IP-Address: - 128.1.4.255
Subnets mask = 255.255.255.0
Range IP address =128.1.4.1-128.1.4.254
3.1.2.1 Melbourne branch LAN subnet
There are 140 hosts therefore
Number of Hosts = 140
2x = (140 + 2).
28 = (256> 142)
Network bits = 32 – 8 = 24
Network IP-Address = 128.1.4.0 /24
Broadcast IP-Address: - 128.1.4.141
Range IP address =128.1.4.1 -128.1.4.140
Subnets mask = 255.255.255.0
3.1.2.2 Melbourne branch WAN subnet
There are 14 hosts therefore
Number of Hosts = 14
2x = (14 + 2).
28 = (256> 16)
Network bits = 32 – 8 = 24
Network IP-Address = 128.1.4.142 /24
Broadcast IP-Address: - 128.1.4.160
Range IP address =128.1.4.143-128.1.4.159
Subnets mask = 255.255.255.0
3.1.3 Brisbane branch
This branch will be having 300 workstations on the LAN and 14 IP addresses in the WLAN which make a
total of 314 therefore.
There are 316 hosts therefore
⊘ This is a preview!⊘
Do you want full access?
Subscribe today to unlock all pages.
Trusted by 1+ million students worldwide
7PART 1 - Executive summary
Network Assessment and Designing
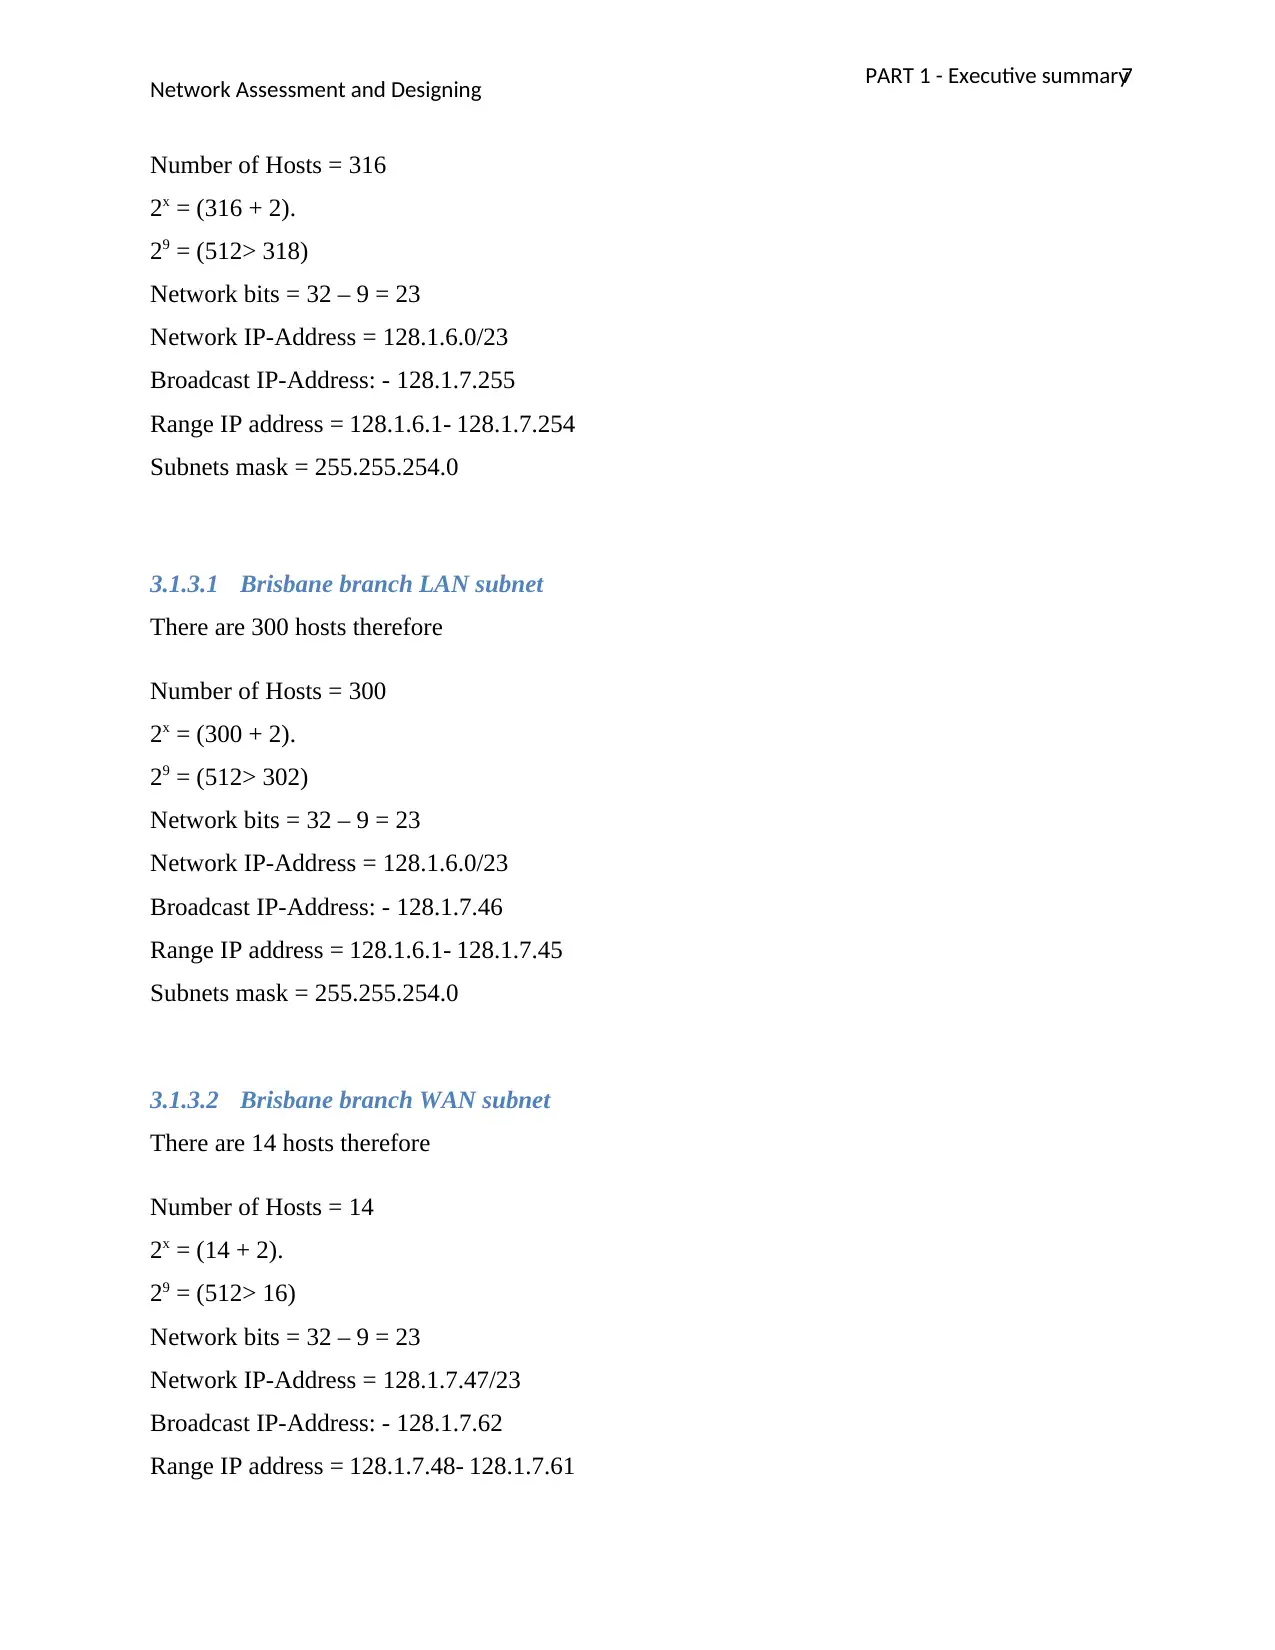
Number of Hosts = 316
2x = (316 + 2).
29 = (512> 318)
Network bits = 32 – 9 = 23
Network IP-Address = 128.1.6.0/23
Broadcast IP-Address: - 128.1.7.255
Range IP address = 128.1.6.1- 128.1.7.254
Subnets mask = 255.255.254.0
3.1.3.1 Brisbane branch LAN subnet
There are 300 hosts therefore
Number of Hosts = 300
2x = (300 + 2).
29 = (512> 302)
Network bits = 32 – 9 = 23
Network IP-Address = 128.1.6.0/23
Broadcast IP-Address: - 128.1.7.46
Range IP address = 128.1.6.1- 128.1.7.45
Subnets mask = 255.255.254.0
3.1.3.2 Brisbane branch WAN subnet
There are 14 hosts therefore
Number of Hosts = 14
2x = (14 + 2).
29 = (512> 16)
Network bits = 32 – 9 = 23
Network IP-Address = 128.1.7.47/23
Broadcast IP-Address: - 128.1.7.62
Range IP address = 128.1.7.48- 128.1.7.61
Network Assessment and Designing
Number of Hosts = 316
2x = (316 + 2).
29 = (512> 318)
Network bits = 32 – 9 = 23
Network IP-Address = 128.1.6.0/23
Broadcast IP-Address: - 128.1.7.255
Range IP address = 128.1.6.1- 128.1.7.254
Subnets mask = 255.255.254.0
3.1.3.1 Brisbane branch LAN subnet
There are 300 hosts therefore
Number of Hosts = 300
2x = (300 + 2).
29 = (512> 302)
Network bits = 32 – 9 = 23
Network IP-Address = 128.1.6.0/23
Broadcast IP-Address: - 128.1.7.46
Range IP address = 128.1.6.1- 128.1.7.45
Subnets mask = 255.255.254.0
3.1.3.2 Brisbane branch WAN subnet
There are 14 hosts therefore
Number of Hosts = 14
2x = (14 + 2).
29 = (512> 16)
Network bits = 32 – 9 = 23
Network IP-Address = 128.1.7.47/23
Broadcast IP-Address: - 128.1.7.62
Range IP address = 128.1.7.48- 128.1.7.61
Paraphrase This Document
Need a fresh take? Get an instant paraphrase of this document with our AI Paraphraser
8PART 1 - Executive summary
Network Assessment and Designing
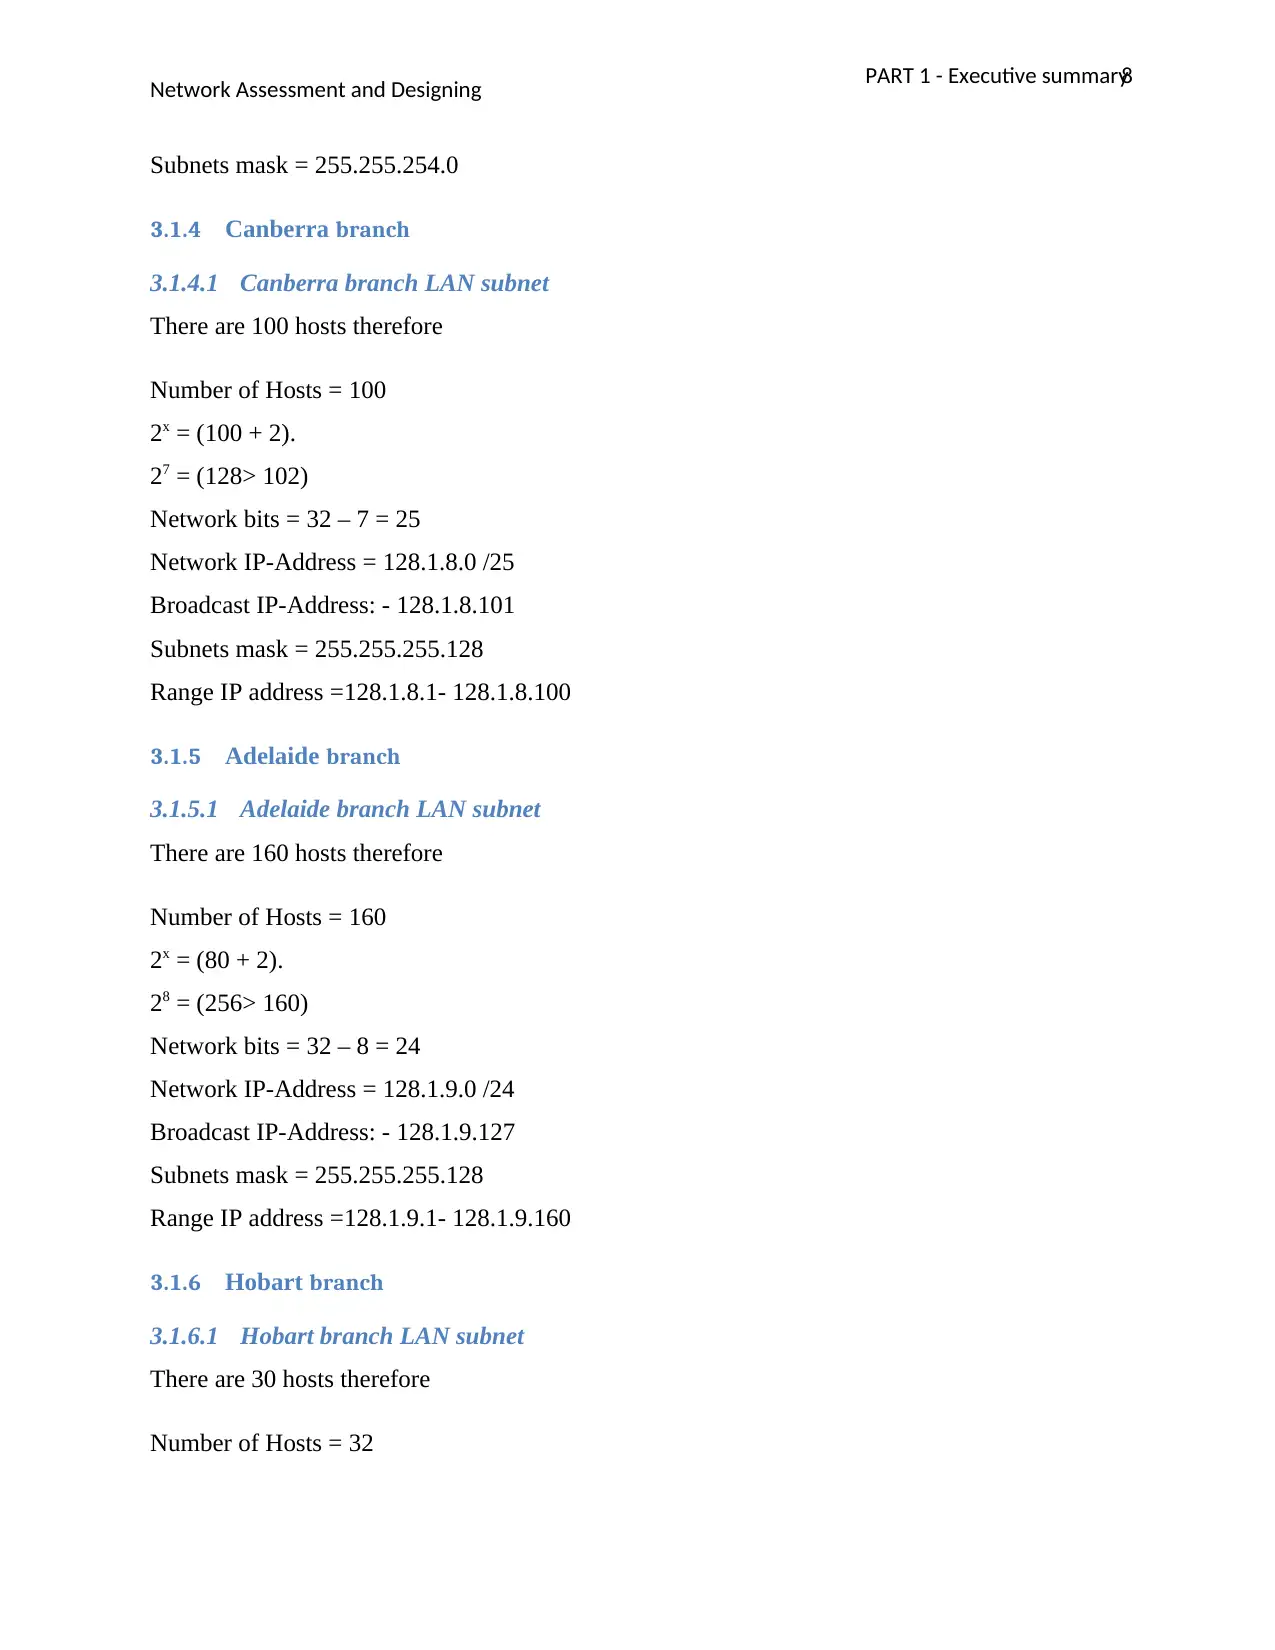
Subnets mask = 255.255.254.0
3.1.4 Canberra branch
3.1.4.1 Canberra branch LAN subnet
There are 100 hosts therefore
Number of Hosts = 100
2x = (100 + 2).
27 = (128> 102)
Network bits = 32 – 7 = 25
Network IP-Address = 128.1.8.0 /25
Broadcast IP-Address: - 128.1.8.101
Subnets mask = 255.255.255.128
Range IP address =128.1.8.1- 128.1.8.100
3.1.5 Adelaide branch
3.1.5.1 Adelaide branch LAN subnet
There are 160 hosts therefore
Number of Hosts = 160
2x = (80 + 2).
28 = (256> 160)
Network bits = 32 – 8 = 24
Network IP-Address = 128.1.9.0 /24
Broadcast IP-Address: - 128.1.9.127
Subnets mask = 255.255.255.128
Range IP address =128.1.9.1- 128.1.9.160
3.1.6 Hobart branch
3.1.6.1 Hobart branch LAN subnet
There are 30 hosts therefore
Number of Hosts = 32
Network Assessment and Designing
Subnets mask = 255.255.254.0
3.1.4 Canberra branch
3.1.4.1 Canberra branch LAN subnet
There are 100 hosts therefore
Number of Hosts = 100
2x = (100 + 2).
27 = (128> 102)
Network bits = 32 – 7 = 25
Network IP-Address = 128.1.8.0 /25
Broadcast IP-Address: - 128.1.8.101
Subnets mask = 255.255.255.128
Range IP address =128.1.8.1- 128.1.8.100
3.1.5 Adelaide branch
3.1.5.1 Adelaide branch LAN subnet
There are 160 hosts therefore
Number of Hosts = 160
2x = (80 + 2).
28 = (256> 160)
Network bits = 32 – 8 = 24
Network IP-Address = 128.1.9.0 /24
Broadcast IP-Address: - 128.1.9.127
Subnets mask = 255.255.255.128
Range IP address =128.1.9.1- 128.1.9.160
3.1.6 Hobart branch
3.1.6.1 Hobart branch LAN subnet
There are 30 hosts therefore
Number of Hosts = 32
9PART 1 - Executive summary
Network Assessment and Designing
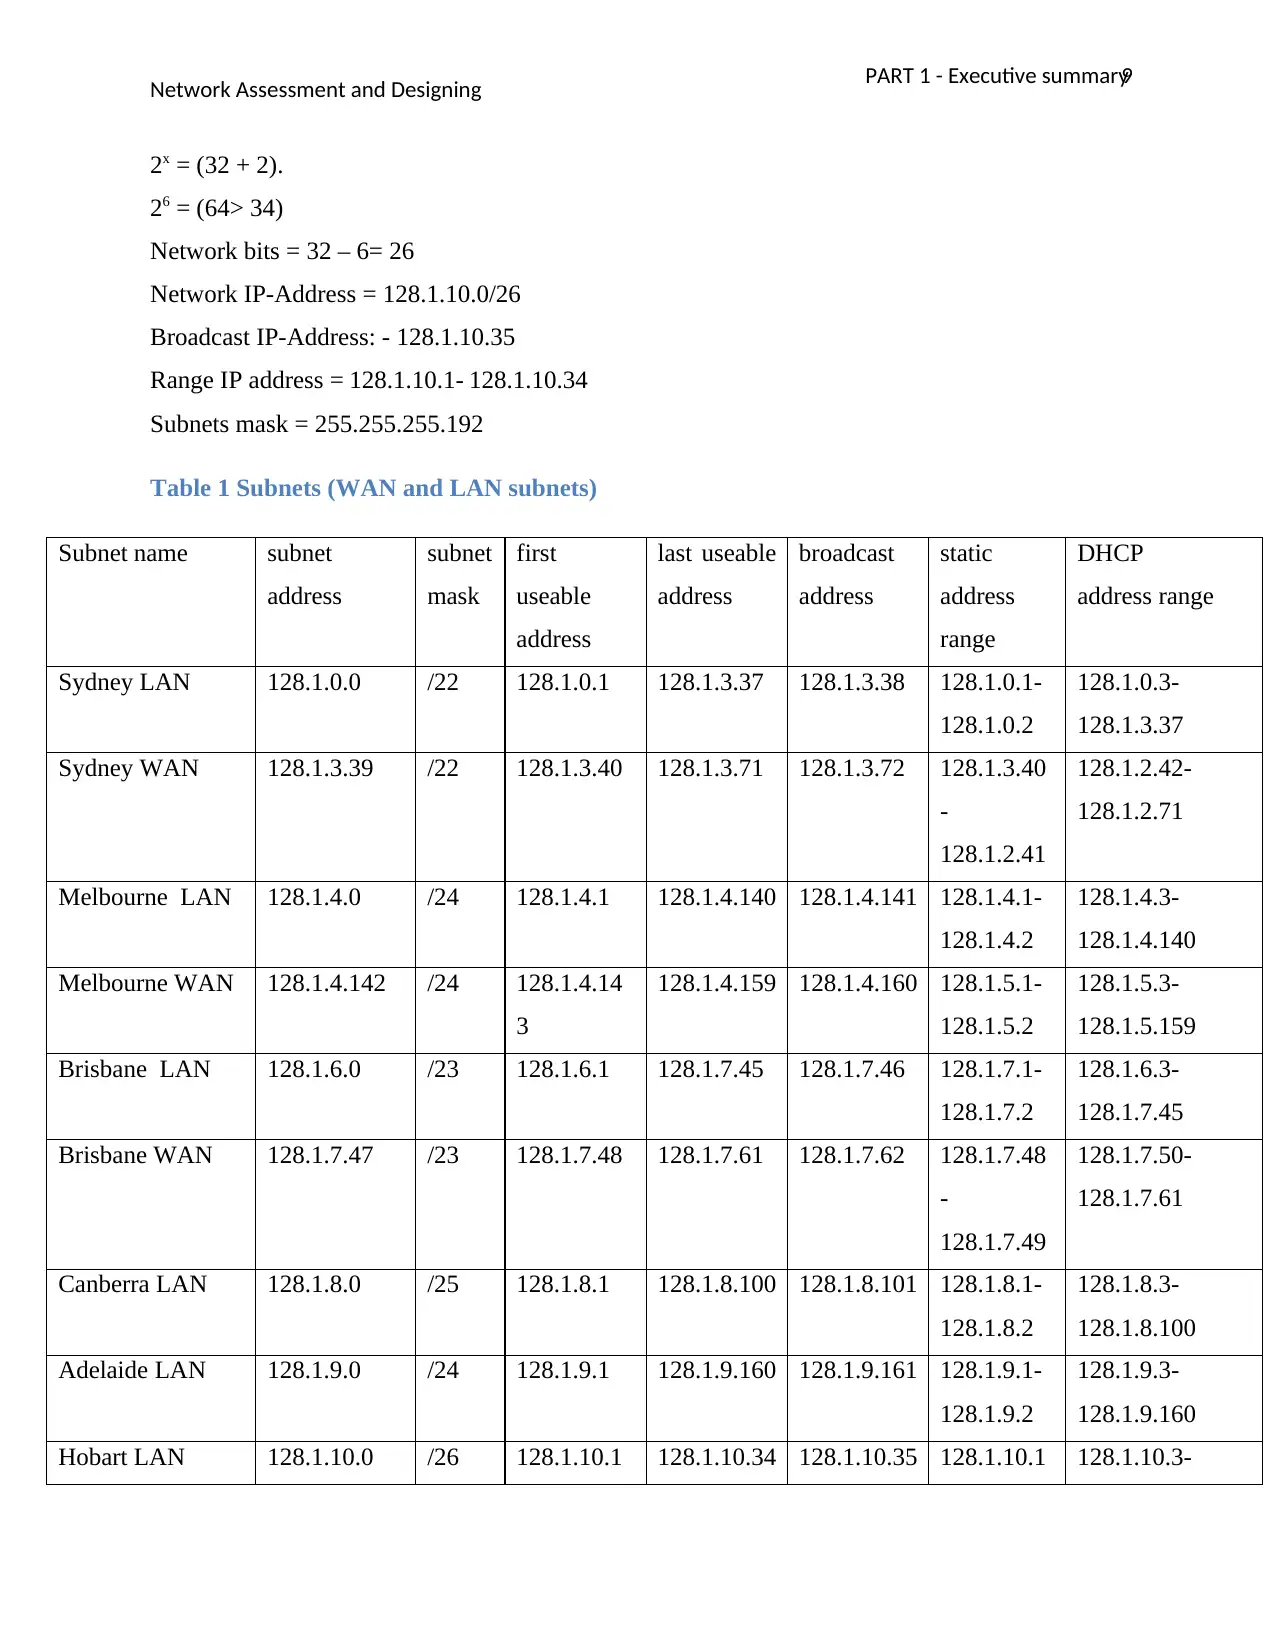
2x = (32 + 2).
26 = (64> 34)
Network bits = 32 – 6= 26
Network IP-Address = 128.1.10.0/26
Broadcast IP-Address: - 128.1.10.35
Range IP address = 128.1.10.1- 128.1.10.34
Subnets mask = 255.255.255.192
Table 1 Subnets (WAN and LAN subnets)
Subnet name subnet
address
subnet
mask
first
useable
address
last useable
address
broadcast
address
static
address
range
DHCP
address range
Sydney LAN 128.1.0.0 /22 128.1.0.1 128.1.3.37 128.1.3.38 128.1.0.1-
128.1.0.2
128.1.0.3-
128.1.3.37
Sydney WAN 128.1.3.39 /22 128.1.3.40 128.1.3.71 128.1.3.72 128.1.3.40
-
128.1.2.41
128.1.2.42-
128.1.2.71
Melbourne LAN 128.1.4.0 /24 128.1.4.1 128.1.4.140 128.1.4.141 128.1.4.1-
128.1.4.2
128.1.4.3-
128.1.4.140
Melbourne WAN 128.1.4.142 /24 128.1.4.14
3
128.1.4.159 128.1.4.160 128.1.5.1-
128.1.5.2
128.1.5.3-
128.1.5.159
Brisbane LAN 128.1.6.0 /23 128.1.6.1 128.1.7.45 128.1.7.46 128.1.7.1-
128.1.7.2
128.1.6.3-
128.1.7.45
Brisbane WAN 128.1.7.47 /23 128.1.7.48 128.1.7.61 128.1.7.62 128.1.7.48
-
128.1.7.49
128.1.7.50-
128.1.7.61
Canberra LAN 128.1.8.0 /25 128.1.8.1 128.1.8.100 128.1.8.101 128.1.8.1-
128.1.8.2
128.1.8.3-
128.1.8.100
Adelaide LAN 128.1.9.0 /24 128.1.9.1 128.1.9.160 128.1.9.161 128.1.9.1-
128.1.9.2
128.1.9.3-
128.1.9.160
Hobart LAN 128.1.10.0 /26 128.1.10.1 128.1.10.34 128.1.10.35 128.1.10.1 128.1.10.3-
Network Assessment and Designing
2x = (32 + 2).
26 = (64> 34)
Network bits = 32 – 6= 26
Network IP-Address = 128.1.10.0/26
Broadcast IP-Address: - 128.1.10.35
Range IP address = 128.1.10.1- 128.1.10.34
Subnets mask = 255.255.255.192
Table 1 Subnets (WAN and LAN subnets)
Subnet name subnet
address
subnet
mask
first
useable
address
last useable
address
broadcast
address
static
address
range
DHCP
address range
Sydney LAN 128.1.0.0 /22 128.1.0.1 128.1.3.37 128.1.3.38 128.1.0.1-
128.1.0.2
128.1.0.3-
128.1.3.37
Sydney WAN 128.1.3.39 /22 128.1.3.40 128.1.3.71 128.1.3.72 128.1.3.40
-
128.1.2.41
128.1.2.42-
128.1.2.71
Melbourne LAN 128.1.4.0 /24 128.1.4.1 128.1.4.140 128.1.4.141 128.1.4.1-
128.1.4.2
128.1.4.3-
128.1.4.140
Melbourne WAN 128.1.4.142 /24 128.1.4.14
3
128.1.4.159 128.1.4.160 128.1.5.1-
128.1.5.2
128.1.5.3-
128.1.5.159
Brisbane LAN 128.1.6.0 /23 128.1.6.1 128.1.7.45 128.1.7.46 128.1.7.1-
128.1.7.2
128.1.6.3-
128.1.7.45
Brisbane WAN 128.1.7.47 /23 128.1.7.48 128.1.7.61 128.1.7.62 128.1.7.48
-
128.1.7.49
128.1.7.50-
128.1.7.61
Canberra LAN 128.1.8.0 /25 128.1.8.1 128.1.8.100 128.1.8.101 128.1.8.1-
128.1.8.2
128.1.8.3-
128.1.8.100
Adelaide LAN 128.1.9.0 /24 128.1.9.1 128.1.9.160 128.1.9.161 128.1.9.1-
128.1.9.2
128.1.9.3-
128.1.9.160
Hobart LAN 128.1.10.0 /26 128.1.10.1 128.1.10.34 128.1.10.35 128.1.10.1 128.1.10.3-
⊘ This is a preview!⊘
Do you want full access?
Subscribe today to unlock all pages.
Trusted by 1+ million students worldwide

10PART 1 - Executive summary
Network Assessment and Designing
-
128.1.10.2
128.1.10.36
(Douglas 2017).
Table 2 Router interfaces.
Location interface IP address subnet mask
Sydney Fa1/1 128.1.0.1 /22
Sydney Fa0/1 128.1.3.40 /22
Sydney Fa1/2 128.1.11.1 /28
Sydney Fa1/3 128.1.13.1 /28
Sydney Fa1/4 128.1.14.1 /28
Sydney Fa1/5 128.1.15.1 /28
Sydney Fa1/6 128.1.16.1 /28
Melbourne Fa1/1 128.1.4.1 /24
Melbourne Fa0/1 128.1.4.143 /24
Melbourne Fa1/2 128.1.13.2 /28
Melbourne Fa1/3 128.1.17.1 /28
Melbourne Fa1/4 128.1.18.1 /28
Melbourne Fa1/5 128.1.19.1 /28
Brisbane Fa0/1 128.1.6.1 /23
Brisbane Fa1/1 128.1.7.48 /23
Brisbane Fa1/2 128.1.14.2 /28
Canberra Fa0/1 128.1.8.1 /25
Canberra Fa1/1 128.1.15.2 /28
Canberra Fa1/2 128.1.17.2 /28
Adelaide Fa0/1 128.1.9.1 /24
Adelaide Fa1/1 128.1.18.2 /28
Hobart Fa0/1 128.1.10.1 /26
Hobart Fa1/1 128.1.12.0 /28
Hobart Fa1/2 128.1.19.2 /28
(Forouzan 2014).
Table 3 Servers
Paraphrase This Document
Need a fresh take? Get an instant paraphrase of this document with our AI Paraphraser

11PART 1 - Executive summary
Network Assessment and Designing
Location server name IP address subnet mask
Sydney Web server 128.1.11.2 /28
Sydney DB server 128.1.11.2 /28
Hobart Back-up server1 128.1.12.1 /28
Hobart Back-up server2 128.1.12.2 /28
Hobart Back-up server3 128.1.12.3 /28
4 PART 4 - Researching and sourcing appropriate devices.
4.1 Executive summary
In the network implementation there are various items that will be used in the network
connection and this will be obtained through the procurement plan which has the following
goals.
i. To ensure all the selected devices are able to accommodate all the workstations in the
entire network.
ii. To ensure that all the devices are able to offer good and quality services to the users.
iii. To ensure all the devices selected will be acquired within the set budget of $10000.
4.2 Weighted Decision Matrix - hardware resource requirements analysis
4.2.1.1 Matrix attributes justification.
In the analysis and selection of the required network hardware which includes the switch, router
and wireless access devices the following attributes are used to weigh their priorities in selection
process.
i. Feasibility. This attribute will be used to measure the ease of use and installation in
the network and it will have 20%.
ii. Efficiency. This will be used to test how efficient the device is in the network without
having downtime and it will have 20%.
iii. Number of ports. This will measure the number of ports or connections that a device
will support for current use or future growth and will weigh 10%.
iv. Durability. This attribute will be used to measure how long can the device be used in
the network without replacement and will weigh 20%.
12PART 1 - Executive summary
Network Assessment and Designing
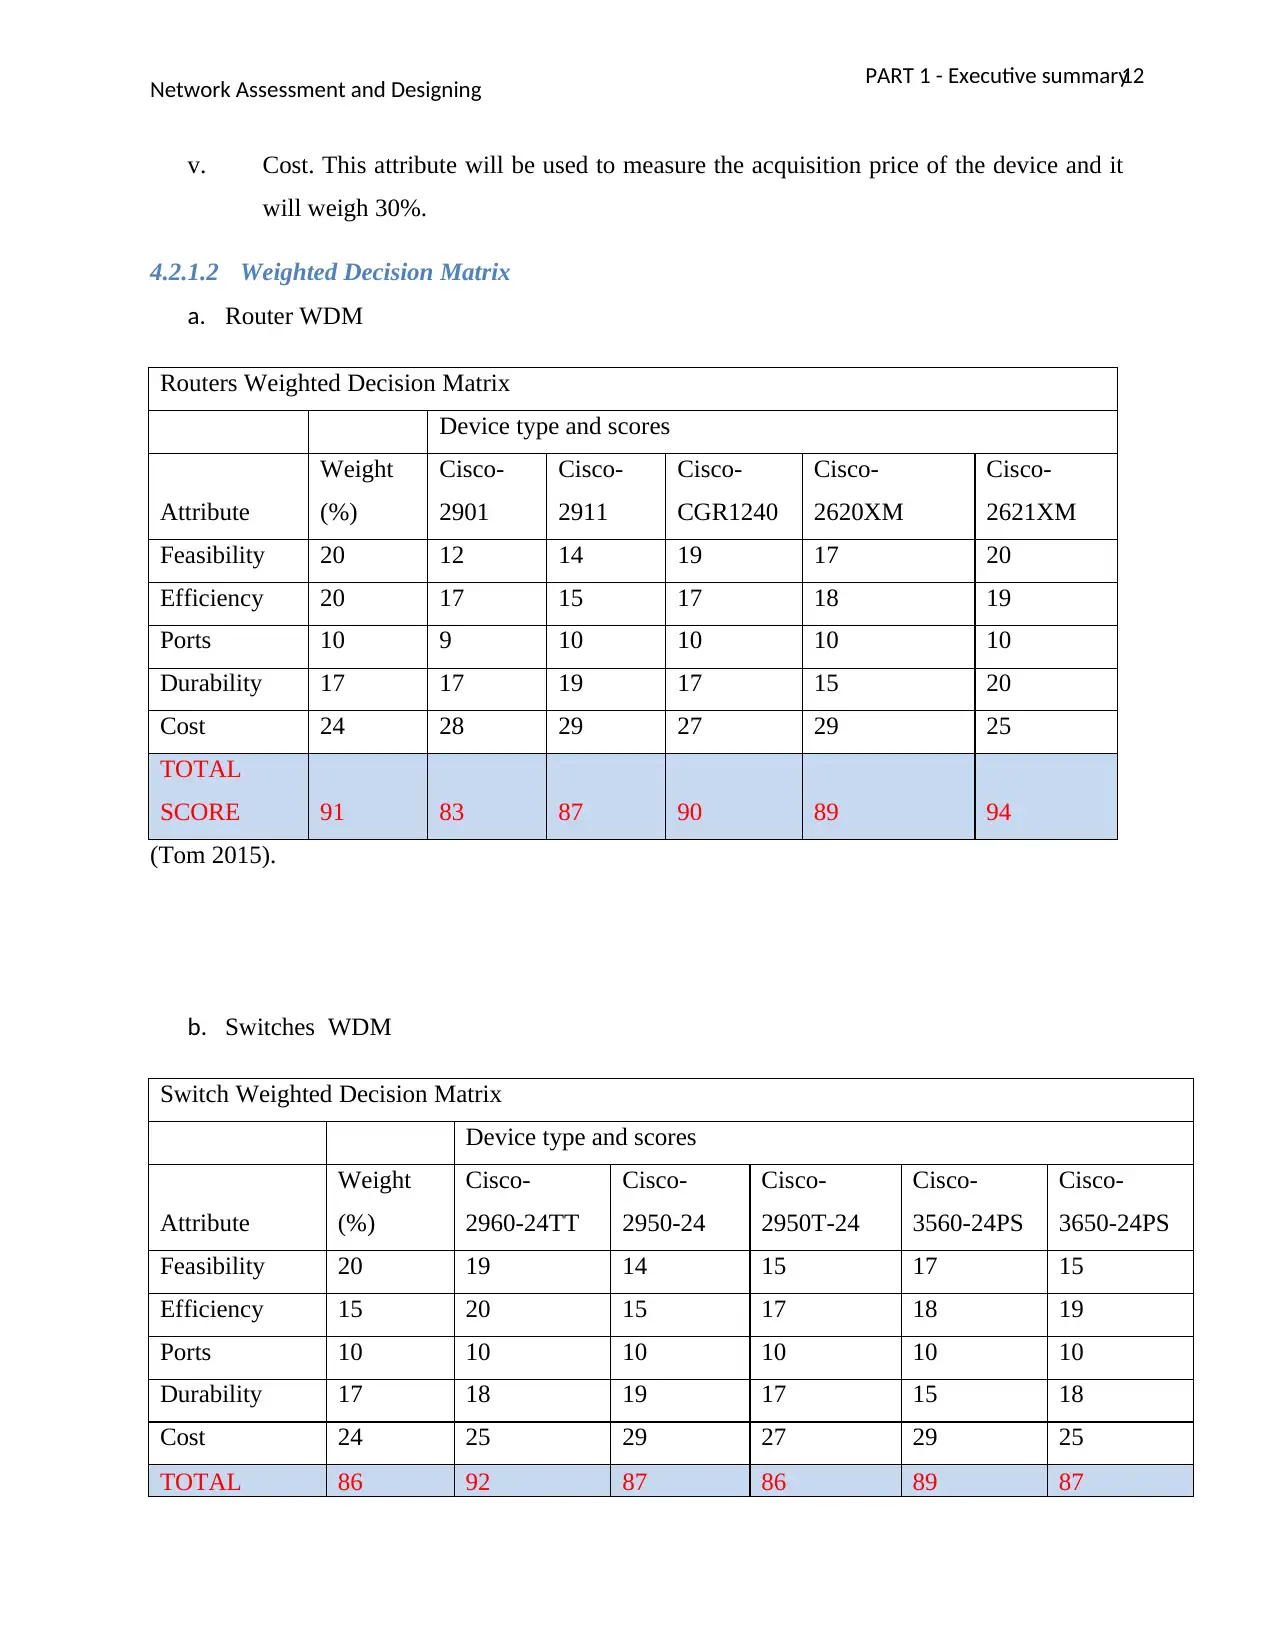
v. Cost. This attribute will be used to measure the acquisition price of the device and it
will weigh 30%.
4.2.1.2 Weighted Decision Matrix
a. Router WDM
Routers Weighted Decision Matrix
Device type and scores
Attribute
Weight
(%)
Cisco-
2901
Cisco-
2911
Cisco-
CGR1240
Cisco-
2620XM
Cisco-
2621XM
Feasibility 20 12 14 19 17 20
Efficiency 20 17 15 17 18 19
Ports 10 9 10 10 10 10
Durability 17 17 19 17 15 20
Cost 24 28 29 27 29 25
TOTAL
SCORE 91 83 87 90 89 94
(Tom 2015).
b. Switches WDM
Switch Weighted Decision Matrix
Device type and scores
Attribute
Weight
(%)
Cisco-
2960-24TT
Cisco-
2950-24
Cisco-
2950T-24
Cisco-
3560-24PS
Cisco-
3650-24PS
Feasibility 20 19 14 15 17 15
Efficiency 15 20 15 17 18 19
Ports 10 10 10 10 10 10
Durability 17 18 19 17 15 18
Cost 24 25 29 27 29 25
TOTAL 86 92 87 86 89 87
Network Assessment and Designing
v. Cost. This attribute will be used to measure the acquisition price of the device and it
will weigh 30%.
4.2.1.2 Weighted Decision Matrix
a. Router WDM
Routers Weighted Decision Matrix
Device type and scores
Attribute
Weight
(%)
Cisco-
2901
Cisco-
2911
Cisco-
CGR1240
Cisco-
2620XM
Cisco-
2621XM
Feasibility 20 12 14 19 17 20
Efficiency 20 17 15 17 18 19
Ports 10 9 10 10 10 10
Durability 17 17 19 17 15 20
Cost 24 28 29 27 29 25
TOTAL
SCORE 91 83 87 90 89 94
(Tom 2015).
b. Switches WDM
Switch Weighted Decision Matrix
Device type and scores
Attribute
Weight
(%)
Cisco-
2960-24TT
Cisco-
2950-24
Cisco-
2950T-24
Cisco-
3560-24PS
Cisco-
3650-24PS
Feasibility 20 19 14 15 17 15
Efficiency 15 20 15 17 18 19
Ports 10 10 10 10 10 10
Durability 17 18 19 17 15 18
Cost 24 25 29 27 29 25
TOTAL 86 92 87 86 89 87
⊘ This is a preview!⊘
Do you want full access?
Subscribe today to unlock all pages.
Trusted by 1+ million students worldwide
1 out of 16
Related Documents


Your All-in-One AI-Powered Toolkit for Academic Success.
+13062052269
info@desklib.com
Available 24*7 on WhatsApp / Email
![[object Object]](/_next/static/media/star-bottom.7253800d.svg)
Unlock your academic potential
Copyright © 2020–2026 A2Z Services. All Rights Reserved. Developed and managed by ZUCOL.