Data Analysis: Determining Relationship Between Network, Market Supply

Verified

Added on  2023/04/21

|6
|739
|441
Homework Assignment
AI Summary
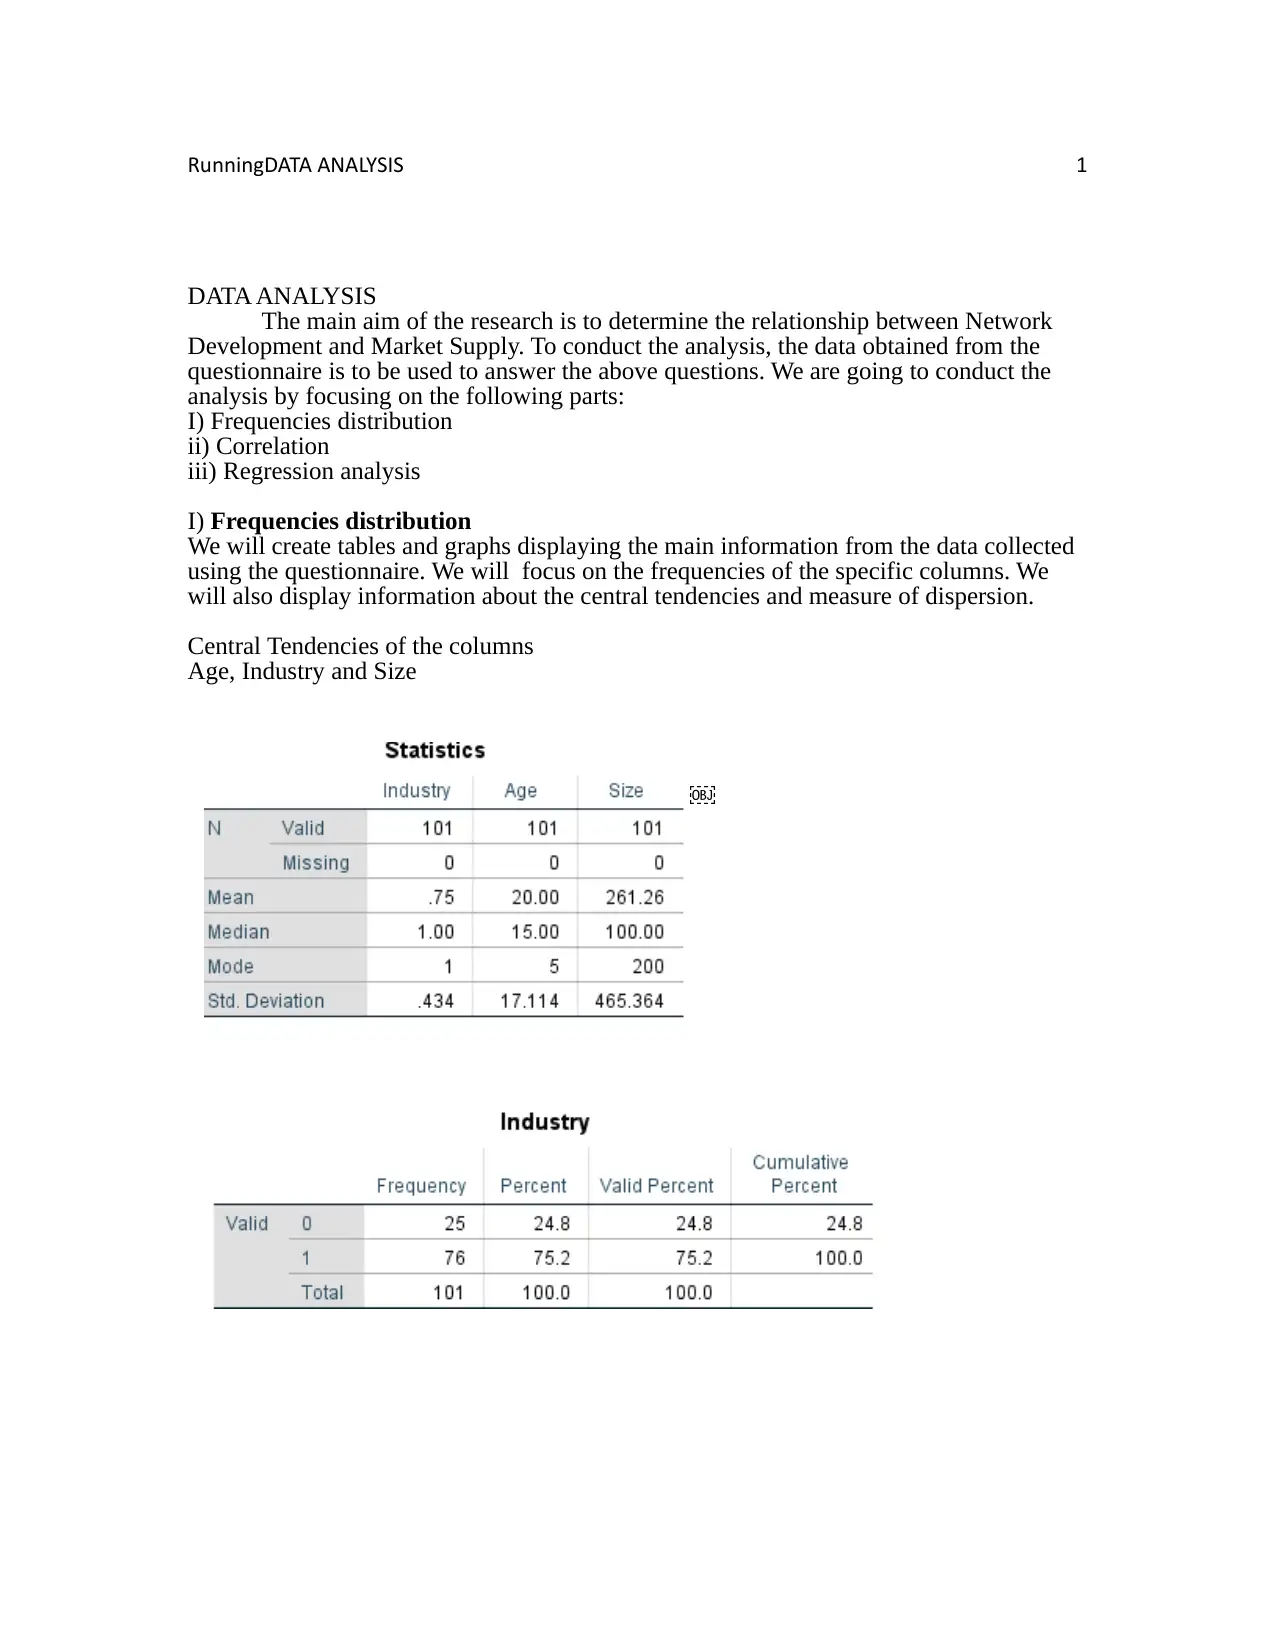
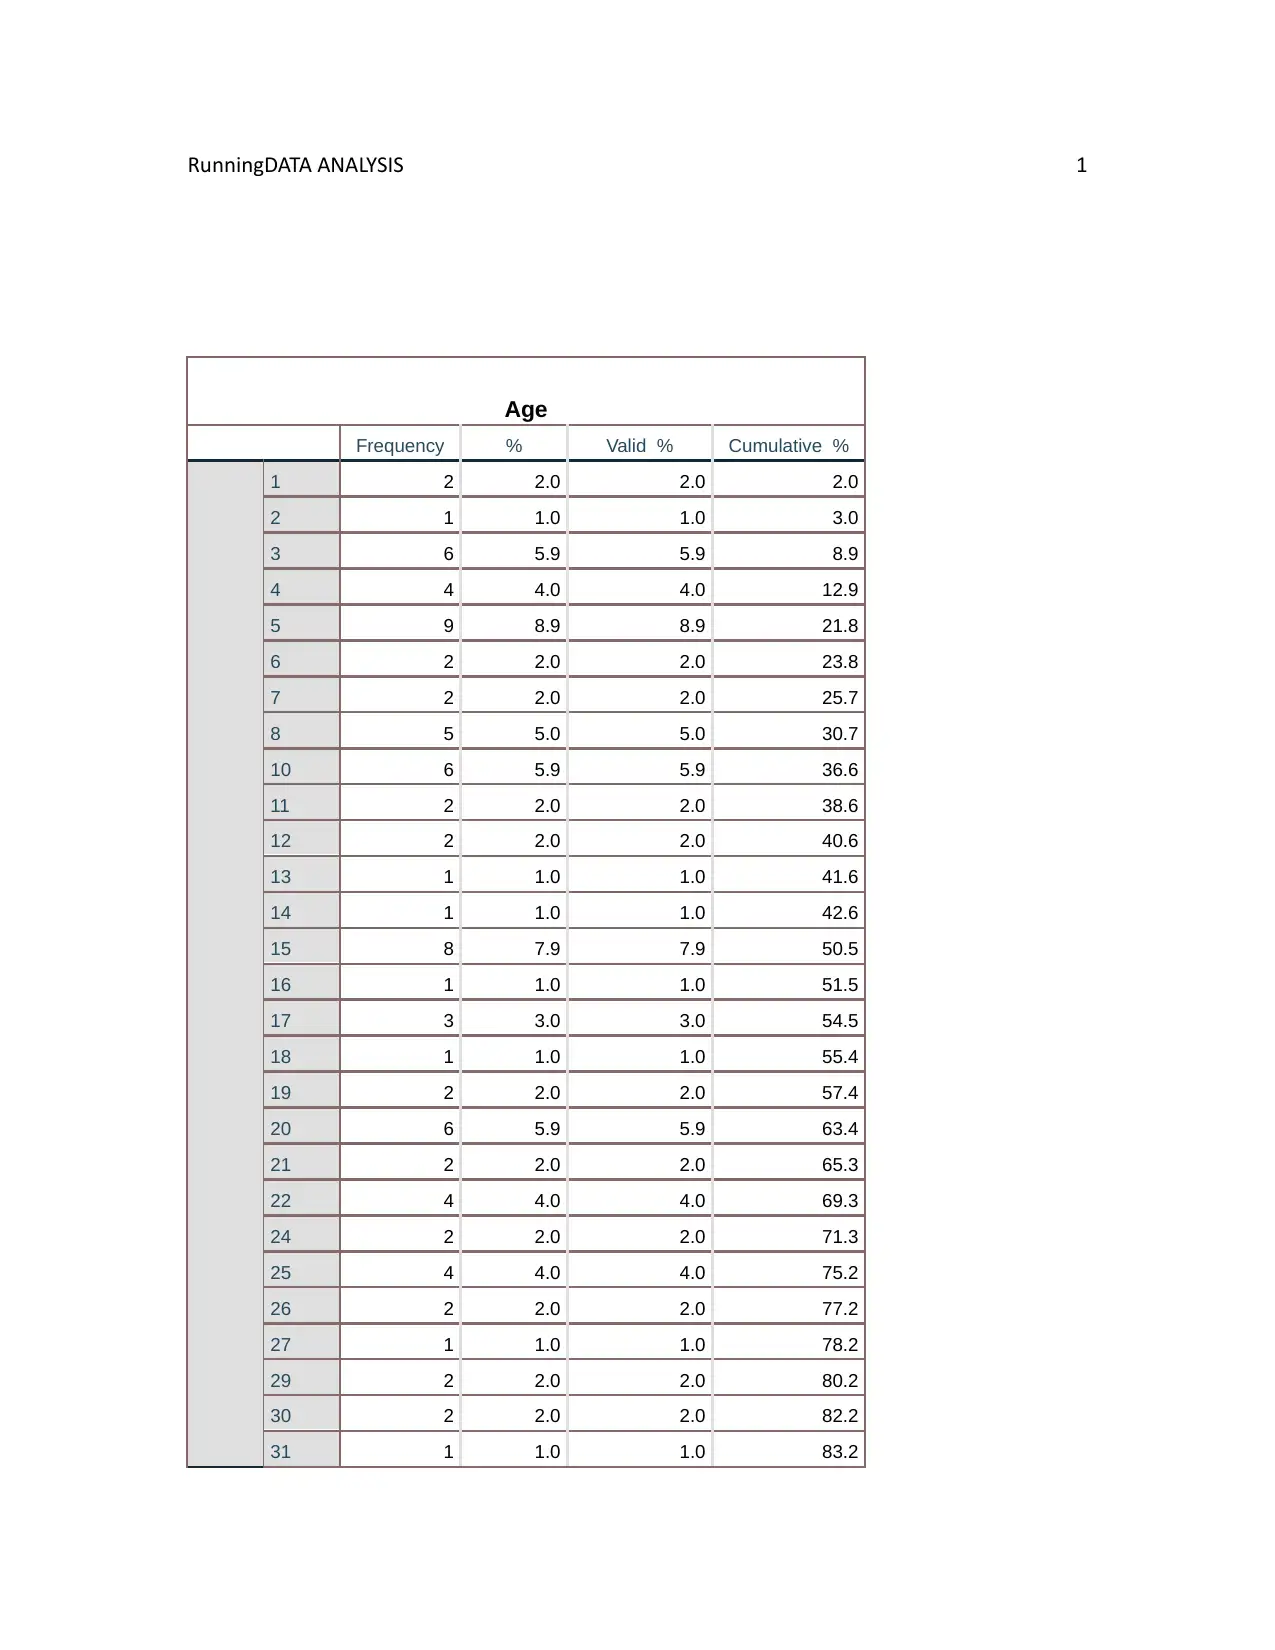
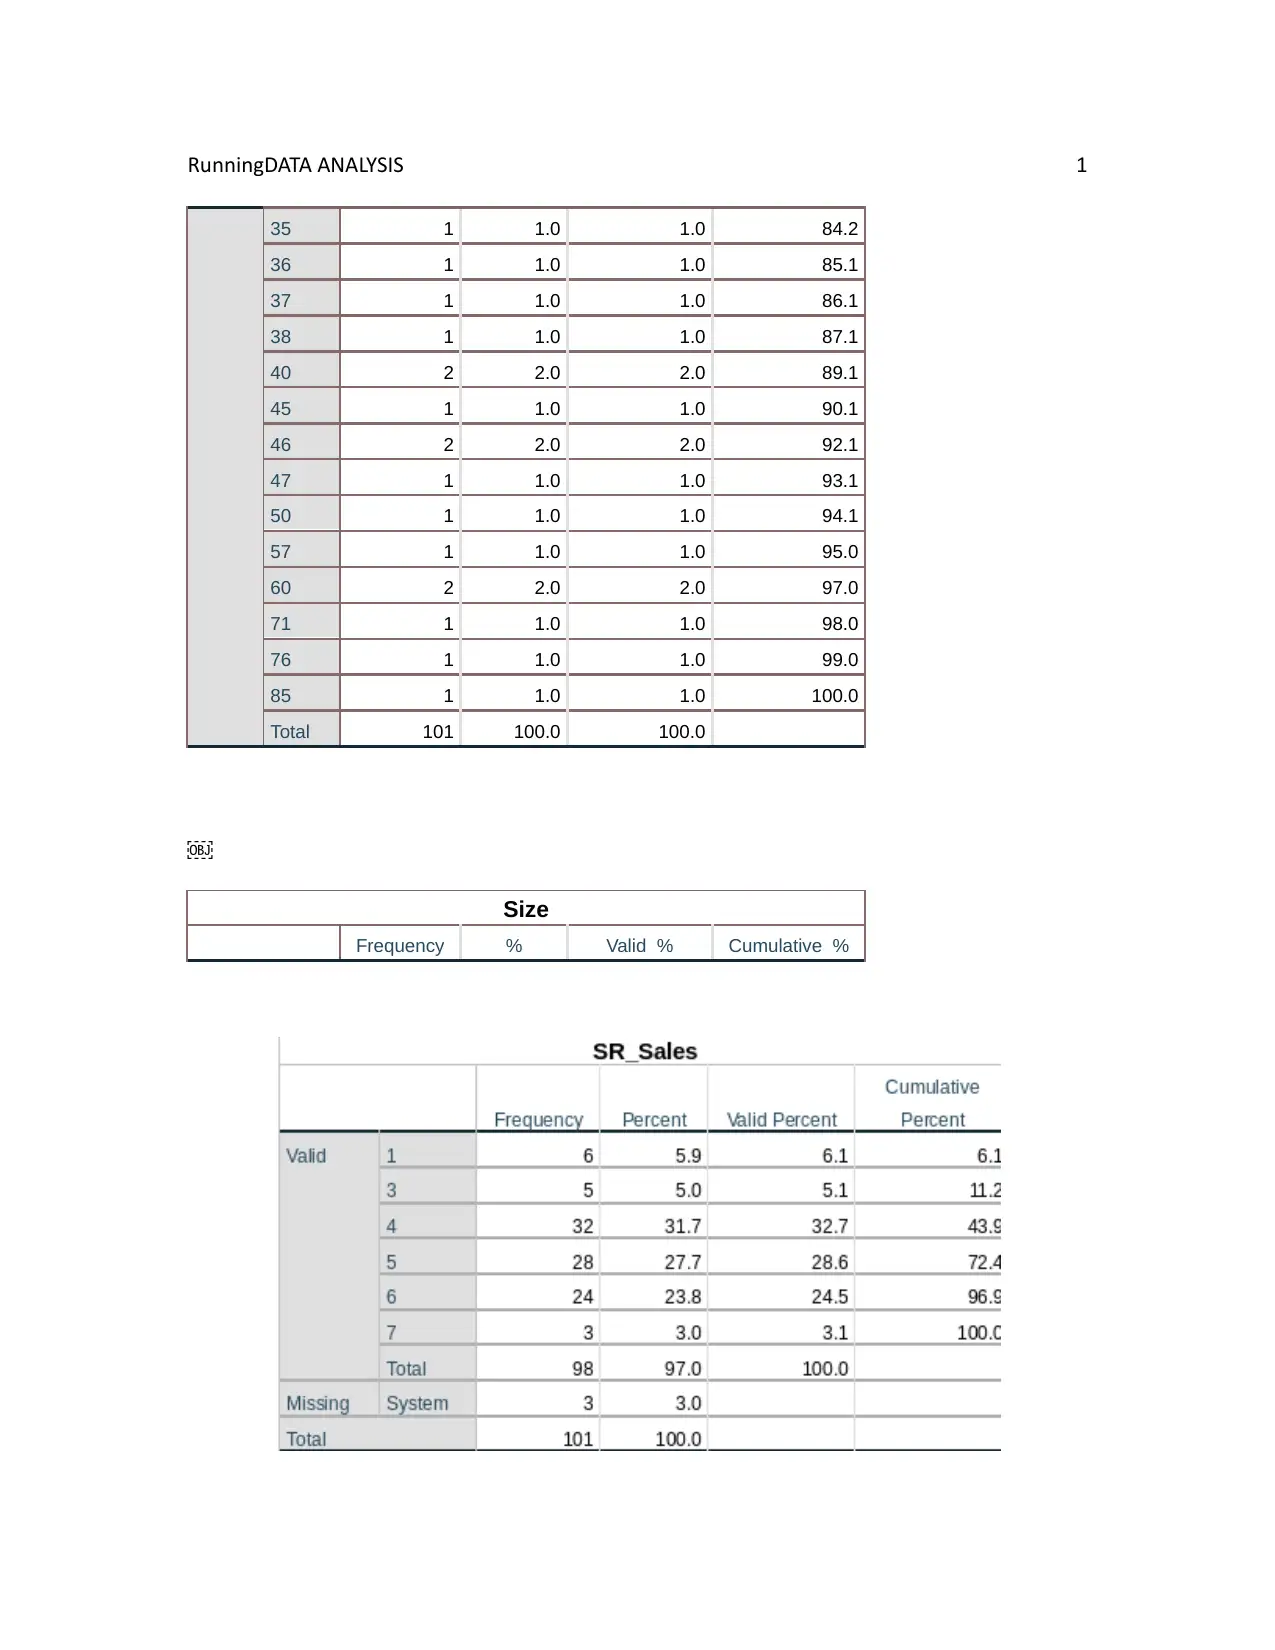
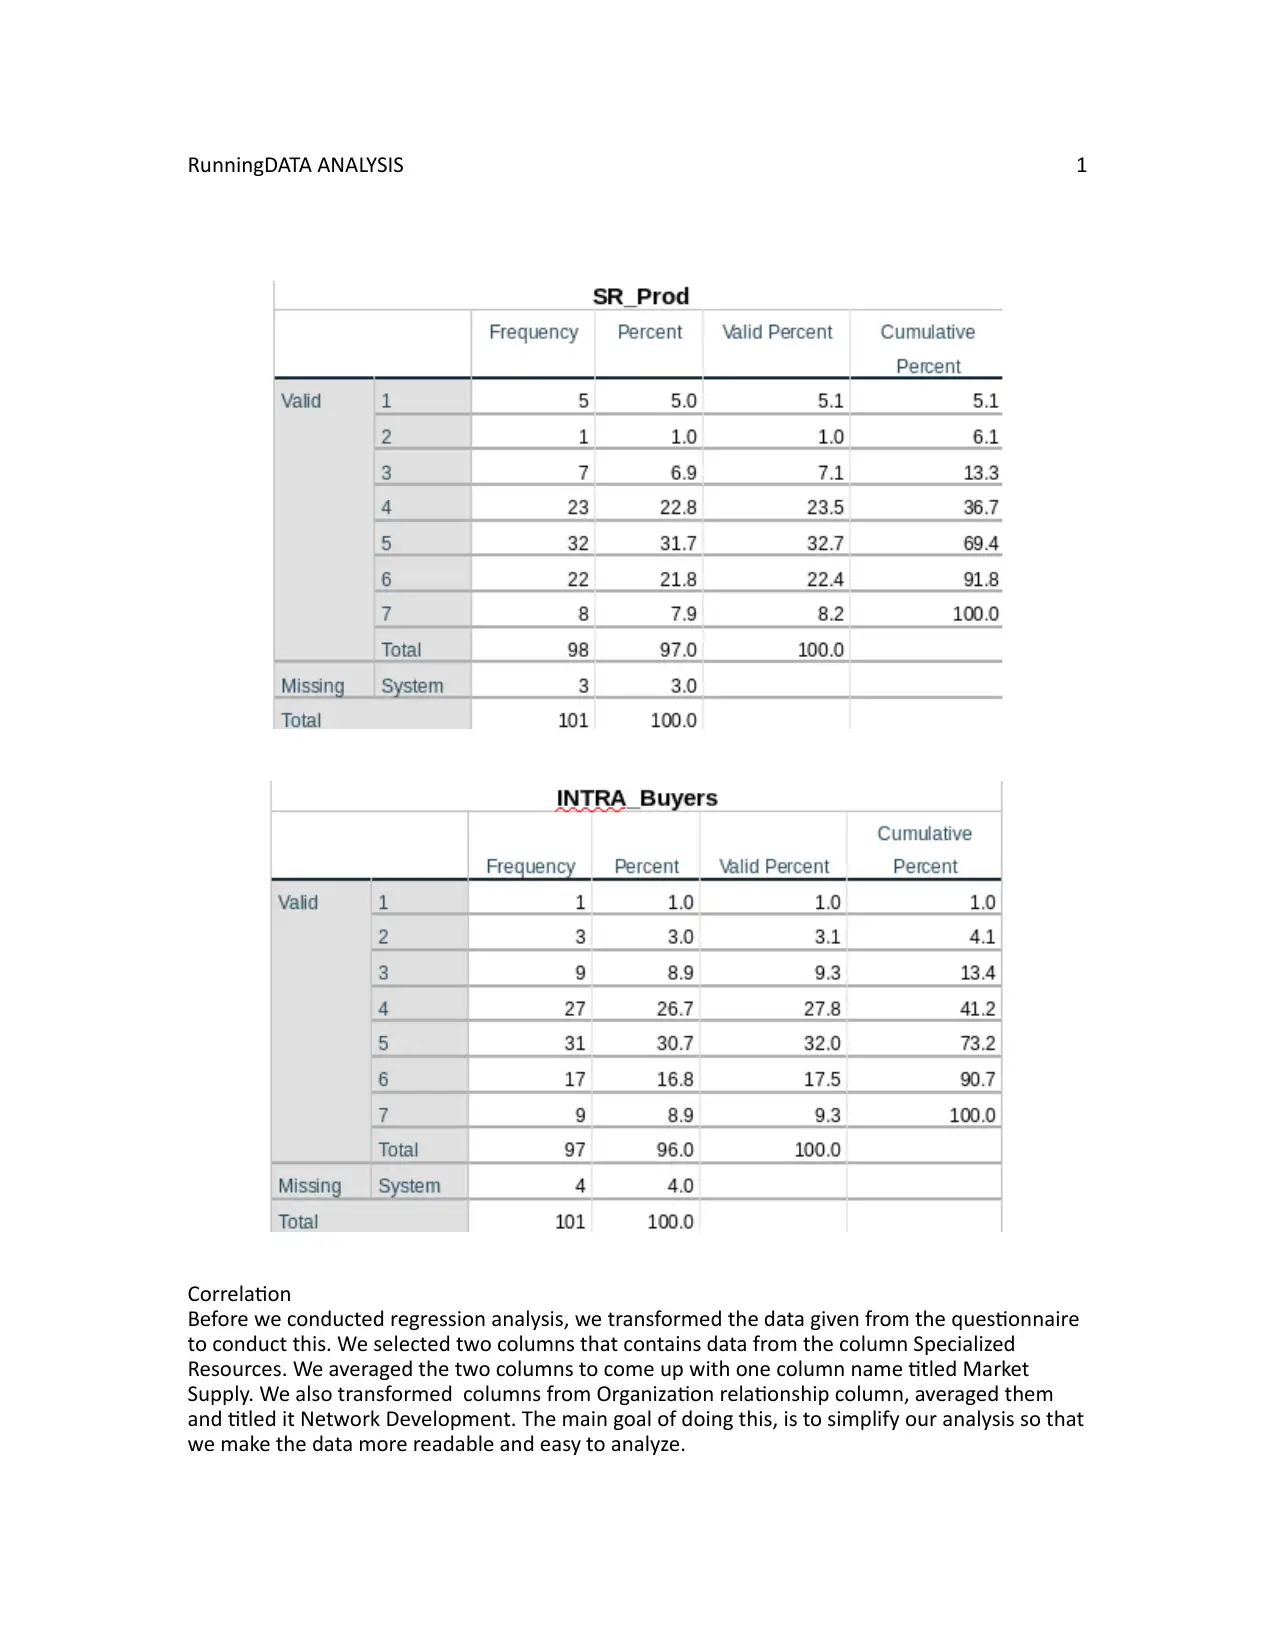
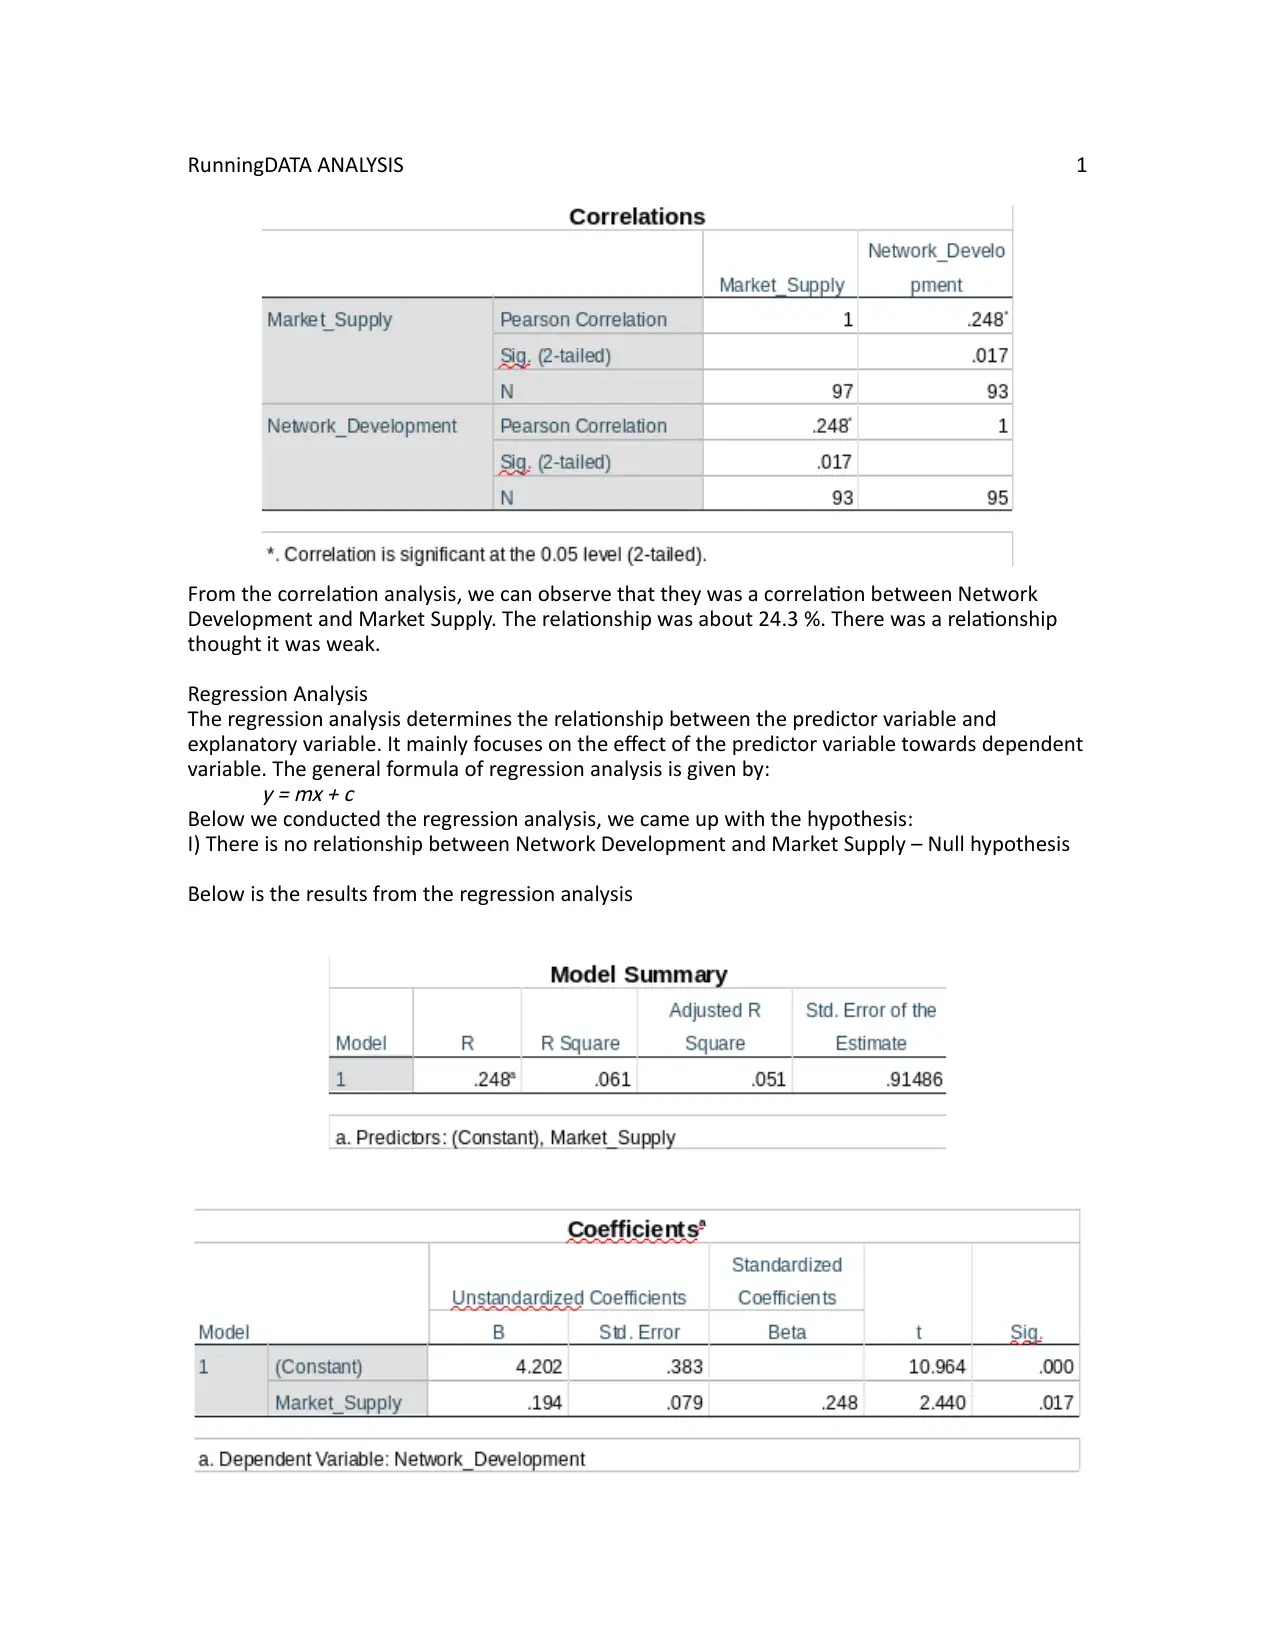
This assignment focuses on analyzing the relationship between Network Development and Market Supply using data obtained from a questionnaire. The analysis includes frequency distribution, correlation, and regression analysis to determine the nature and strength of the relationship. Frequency distributions are presented for variables like age, industry, and size, providing descriptive statistics. Correlation analysis reveals a weak positive relationship between Network Development and Market Supply. Regression analysis is then conducted to determine the impact of Market Supply on Network Development, resulting in a regression equation and an R-squared value indicating a low percentage of variance explained. The null hypothesis is rejected based on the significance value, concluding that there is a relationship, albeit weak, between the two variables. The assignment provides a comprehensive statistical analysis of the data, providing insights into the relationship between Network Development and Market Supply.
Document Page
RunningDATA ANALYSIS 1
DATA ANALYSIS
The main aim of the research is to determine the relationship between Network
Development and Market Supply. To conduct the analysis, the data obtained from the
questionnaire is to be used to answer the above questions. We are going to conduct the
analysis by focusing on the following parts:
I) Frequencies distribution
ii) Correlation
iii) Regression analysis
I) Frequencies distribution
We will create tables and graphs displaying the main information from the data collected
using the questionnaire. We will focus on the frequencies of the specific columns. We
will also display information about the central tendencies and measure of dispersion.
Central Tendencies of the columns
Age, Industry and Size
tabler-icon-diamond-filled.svg

Paraphrase This Document

Need a fresh take? Get an instant paraphrase of this document with our AI Paraphraser
Document Page
RunningDATA ANALYSIS 1
Age
Frequency % Valid % Cumulative %
1 2 2.0 2.0 2.0
2 1 1.0 1.0 3.0
3 6 5.9 5.9 8.9
4 4 4.0 4.0 12.9
5 9 8.9 8.9 21.8
6 2 2.0 2.0 23.8
7 2 2.0 2.0 25.7
8 5 5.0 5.0 30.7
10 6 5.9 5.9 36.6
11 2 2.0 2.0 38.6
12 2 2.0 2.0 40.6
13 1 1.0 1.0 41.6
14 1 1.0 1.0 42.6
15 8 7.9 7.9 50.5
16 1 1.0 1.0 51.5
17 3 3.0 3.0 54.5
18 1 1.0 1.0 55.4
19 2 2.0 2.0 57.4
20 6 5.9 5.9 63.4
21 2 2.0 2.0 65.3
22 4 4.0 4.0 69.3
24 2 2.0 2.0 71.3
25 4 4.0 4.0 75.2
26 2 2.0 2.0 77.2
27 1 1.0 1.0 78.2
29 2 2.0 2.0 80.2
30 2 2.0 2.0 82.2
31 1 1.0 1.0 83.2
Document Page
RunningDATA ANALYSIS 1
35 1 1.0 1.0 84.2
36 1 1.0 1.0 85.1
37 1 1.0 1.0 86.1
38 1 1.0 1.0 87.1
40 2 2.0 2.0 89.1
45 1 1.0 1.0 90.1
46 2 2.0 2.0 92.1
47 1 1.0 1.0 93.1
50 1 1.0 1.0 94.1
57 1 1.0 1.0 95.0
60 2 2.0 2.0 97.0
71 1 1.0 1.0 98.0
76 1 1.0 1.0 99.0
85 1 1.0 1.0 100.0
Total 101 100.0 100.0

Size
Frequency % Valid % Cumulative %
Document Page
RunningDATA ANALYSIS 1
Correlation
Before we conducted regression analysis, we transformed the data given from the questionnaire
to conduct this. We selected two columns that contains data from the column Specialized
Resources. We averaged the two columns to come up with one column name titled Market
Supply. We also transformed columns from Organization relationship column, averaged them
and titled it Network Development. The main goal of doing this, is to simplify our analysis so that
we make the data more readable and easy to analyze.
tabler-icon-diamond-filled.svg

Paraphrase This Document

Need a fresh take? Get an instant paraphrase of this document with our AI Paraphraser
Document Page
RunningDATA ANALYSIS 1
From the correlation analysis, we can observe that they was a correlation between Network
Development and Market Supply. The relationship was about 24.3 %. There was a relationship
thought it was weak.
Regression Analysis
The regression analysis determines the relationship between the predictor variable and
explanatory variable. It mainly focuses on the effect of the predictor variable towards dependent
variable. The general formula of regression analysis is given by:
y = mx + c
Below we conducted the regression analysis, we came up with the hypothesis:
I) There is no relationship between Network Development and Market Supply – Null hypothesis
Below is the results from the regression analysis
Document Page
RunningDATA ANALYSIS 1
From the results above, we can summarize the regression equation as:
Network Development = 4.202 + 0.194 * Market Supply
This mean that 4.202 of Network Development is not affected by Market Supply. Similarly, a unit
of Market Supply increases the Network Development by 0.194 per unit. To determine the fit of
coefficient of determination, we focus on the value of R-squared. The value of R-squared is
0.061. This means that the only 6.1 % of Market Supply affect the number of Network
Development.
To determine whether our null hypothesis is true or not, we focus on the significant value. In our
situation, the significant value is 0.017. Since our significant value is less than 0.05, we reject the
null hypothesis. We therefore, conclude that there is a relationship between Network
Development and Market Supply. Though, the relationship is very low.
chevron_up_icon
1 out of 6
circle_padding
hide_on_mobile
zoom_out_icon
[object Object]