Project Management Report: Analysis of a Network Installation Project

Verified

Added on  2021/05/31

|19
|1749
|27
Project
AI Summary
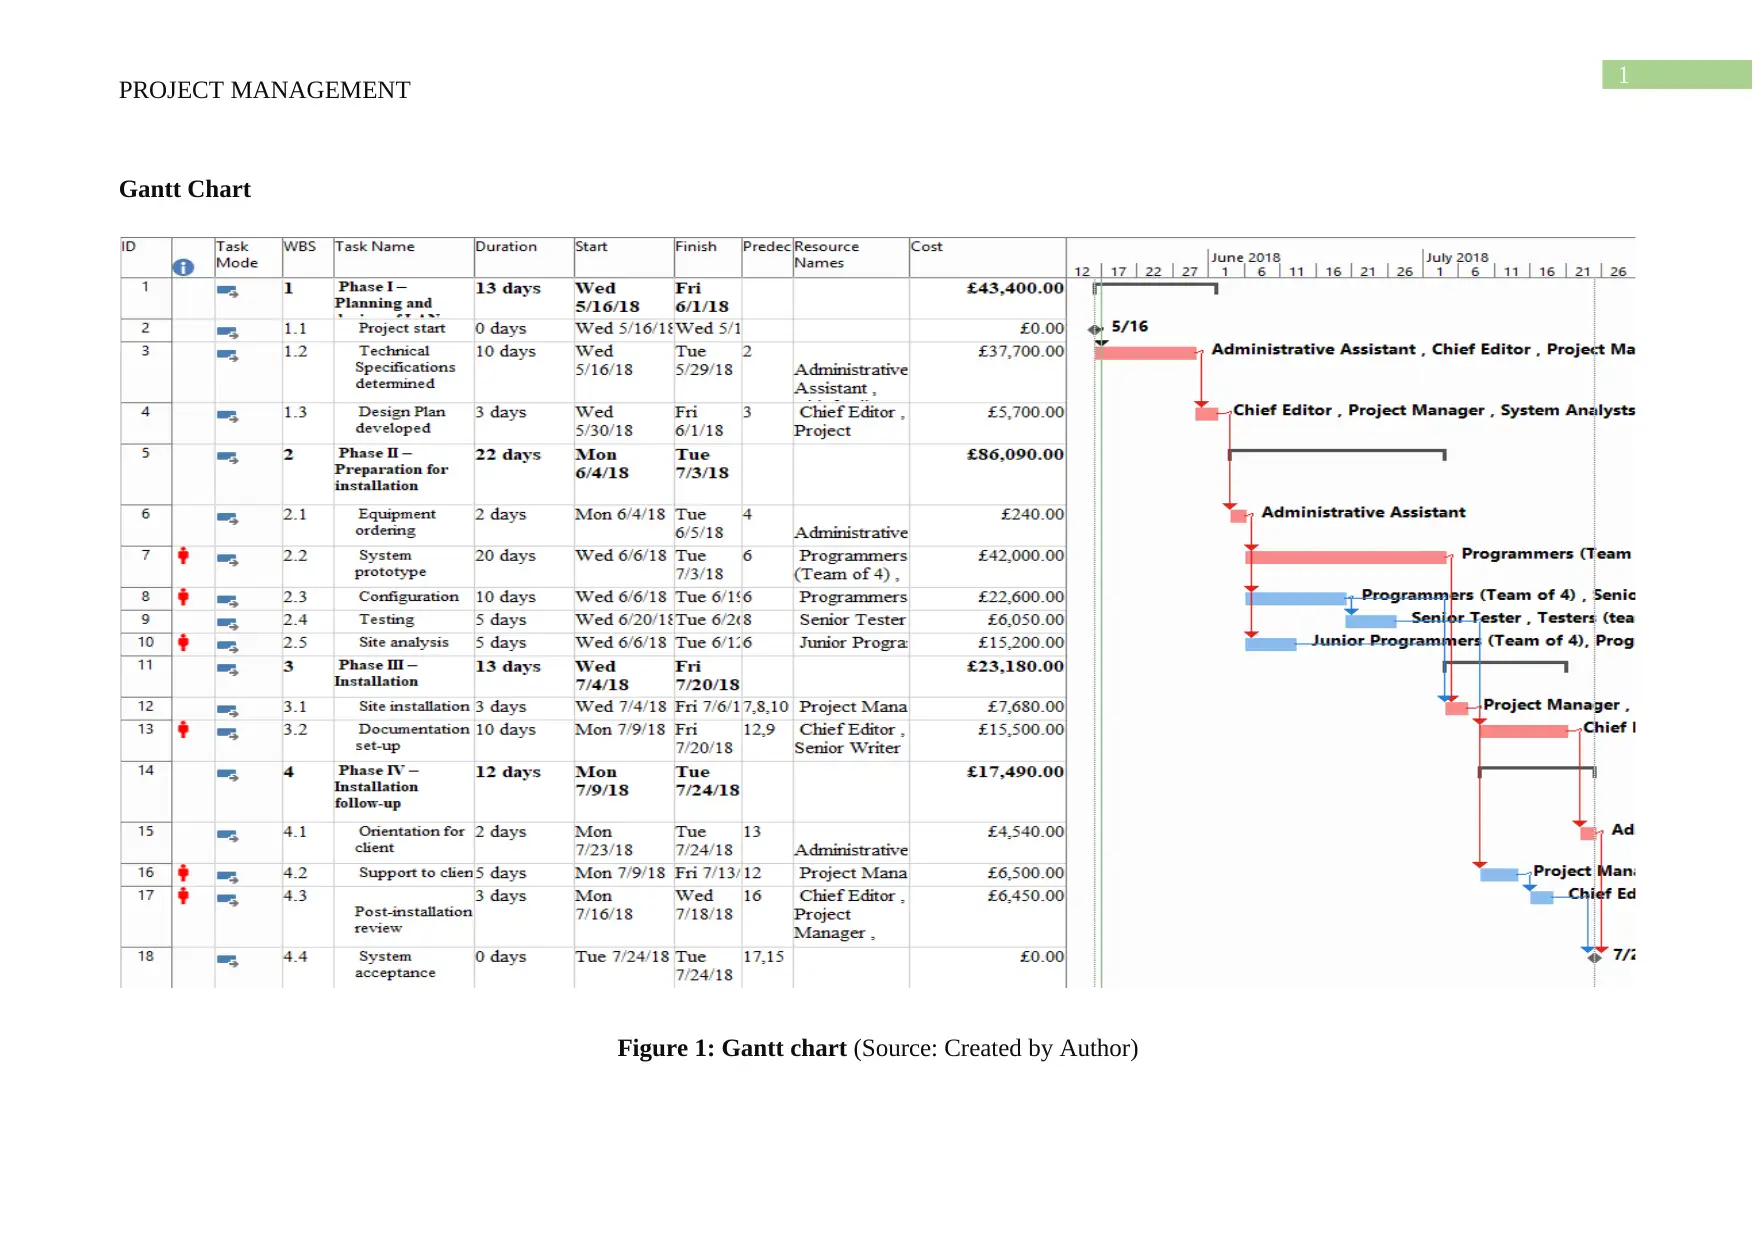
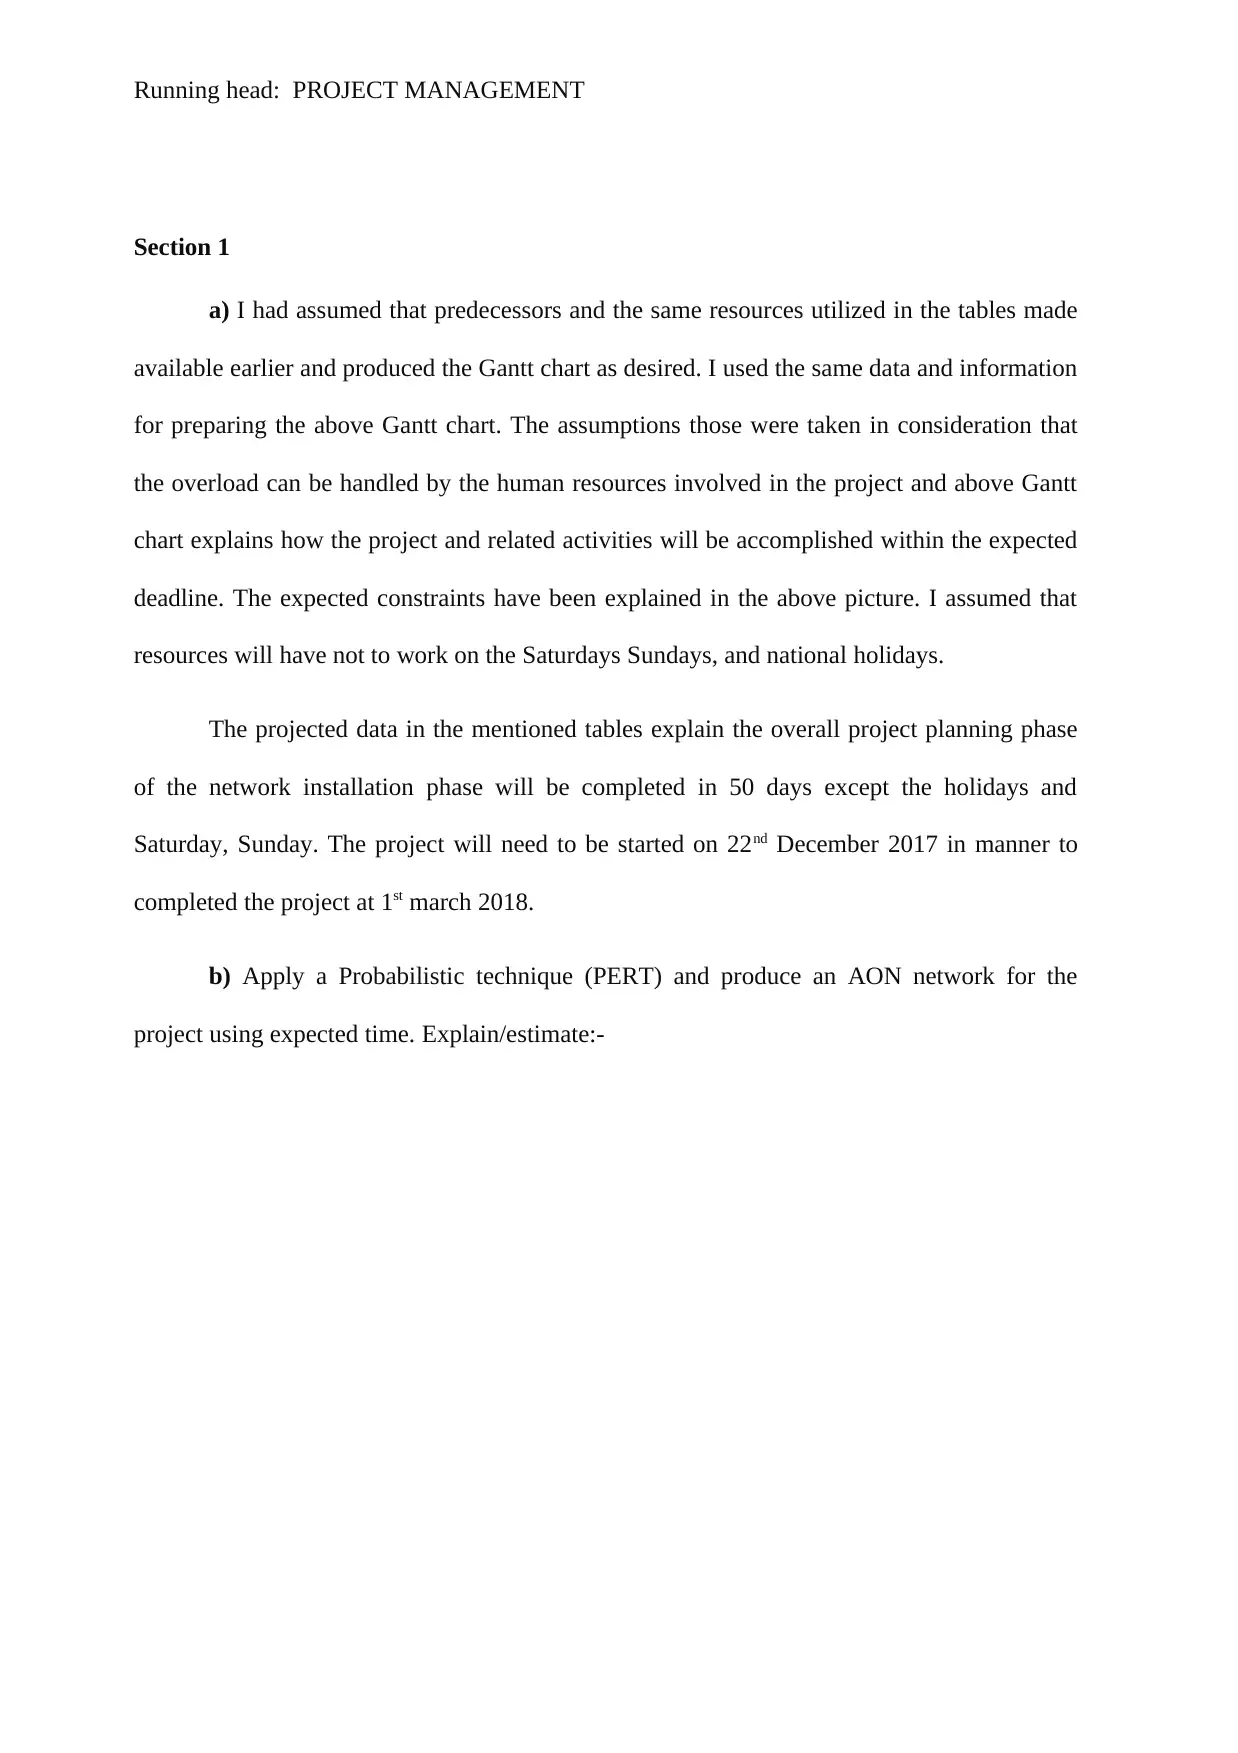
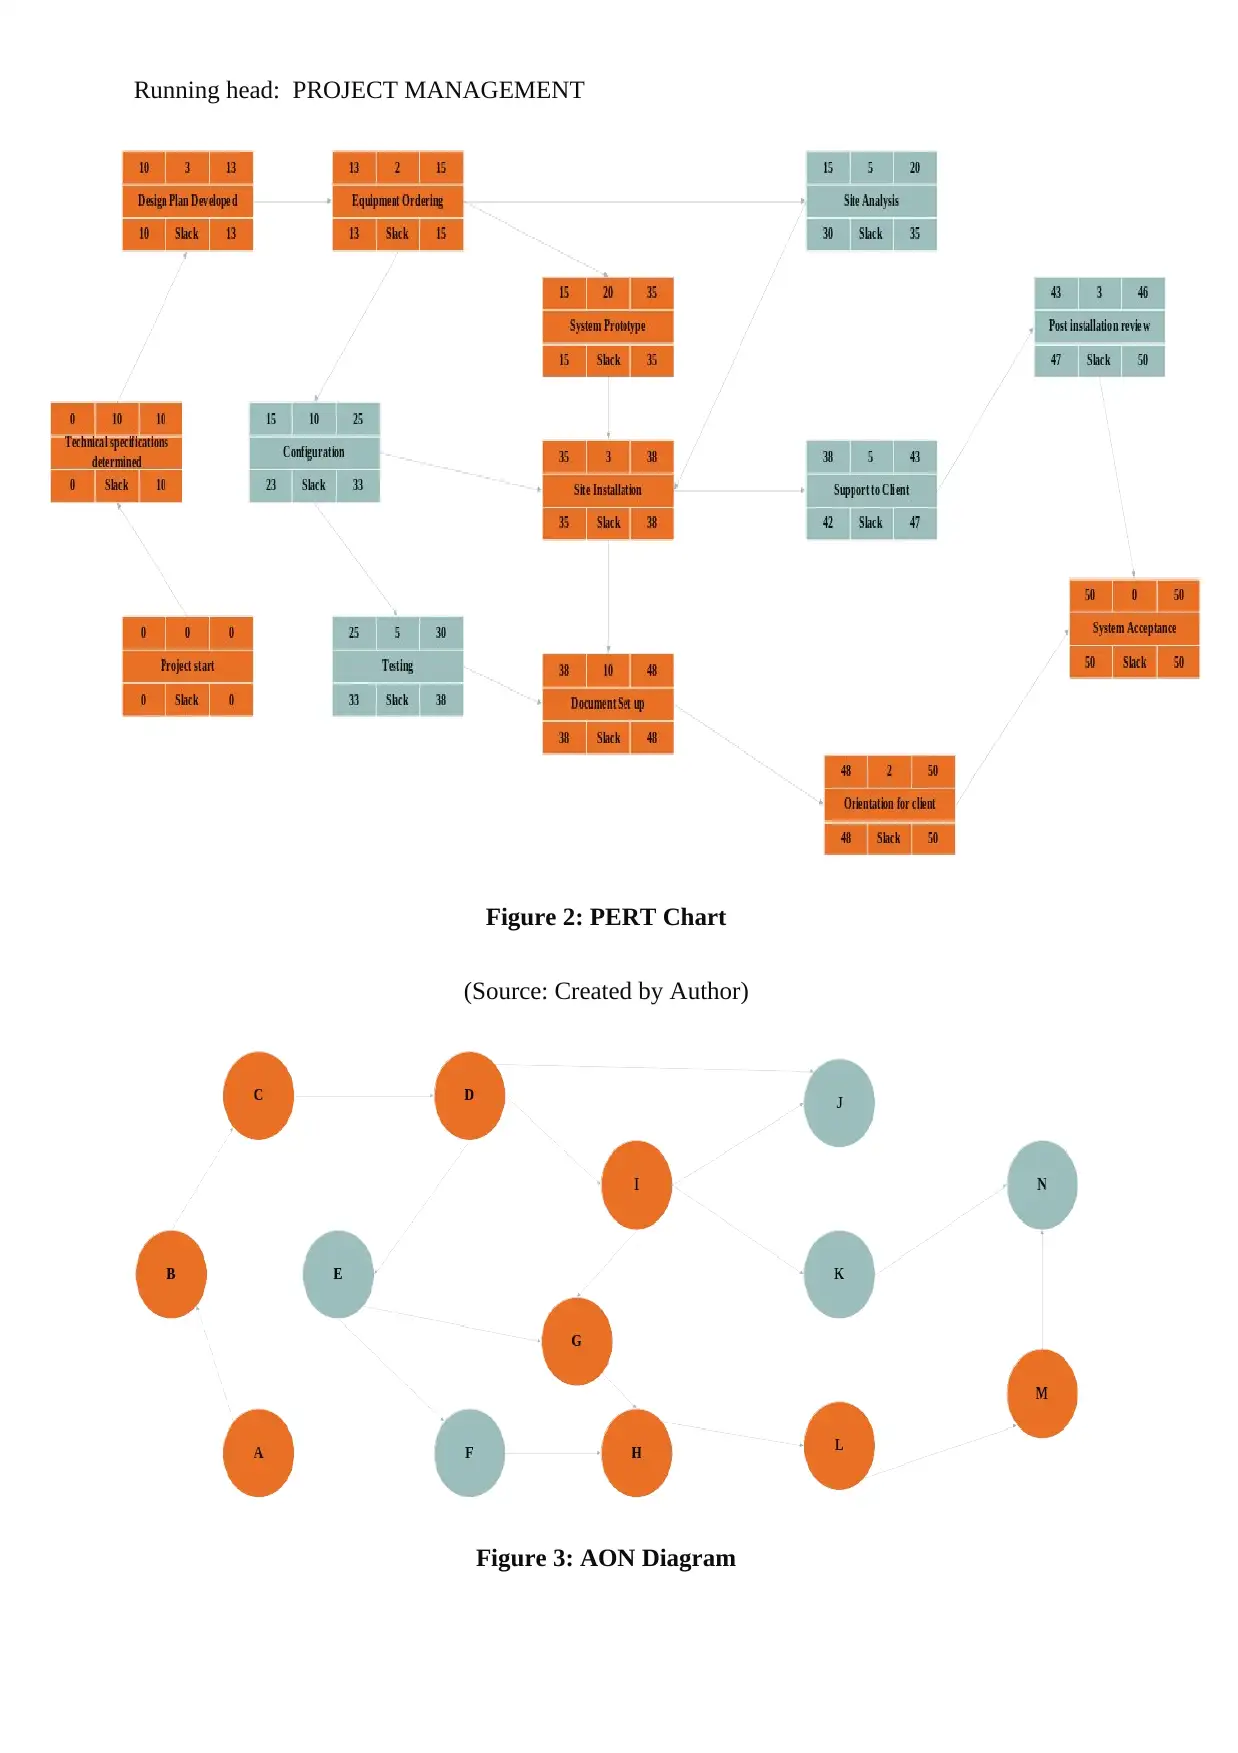
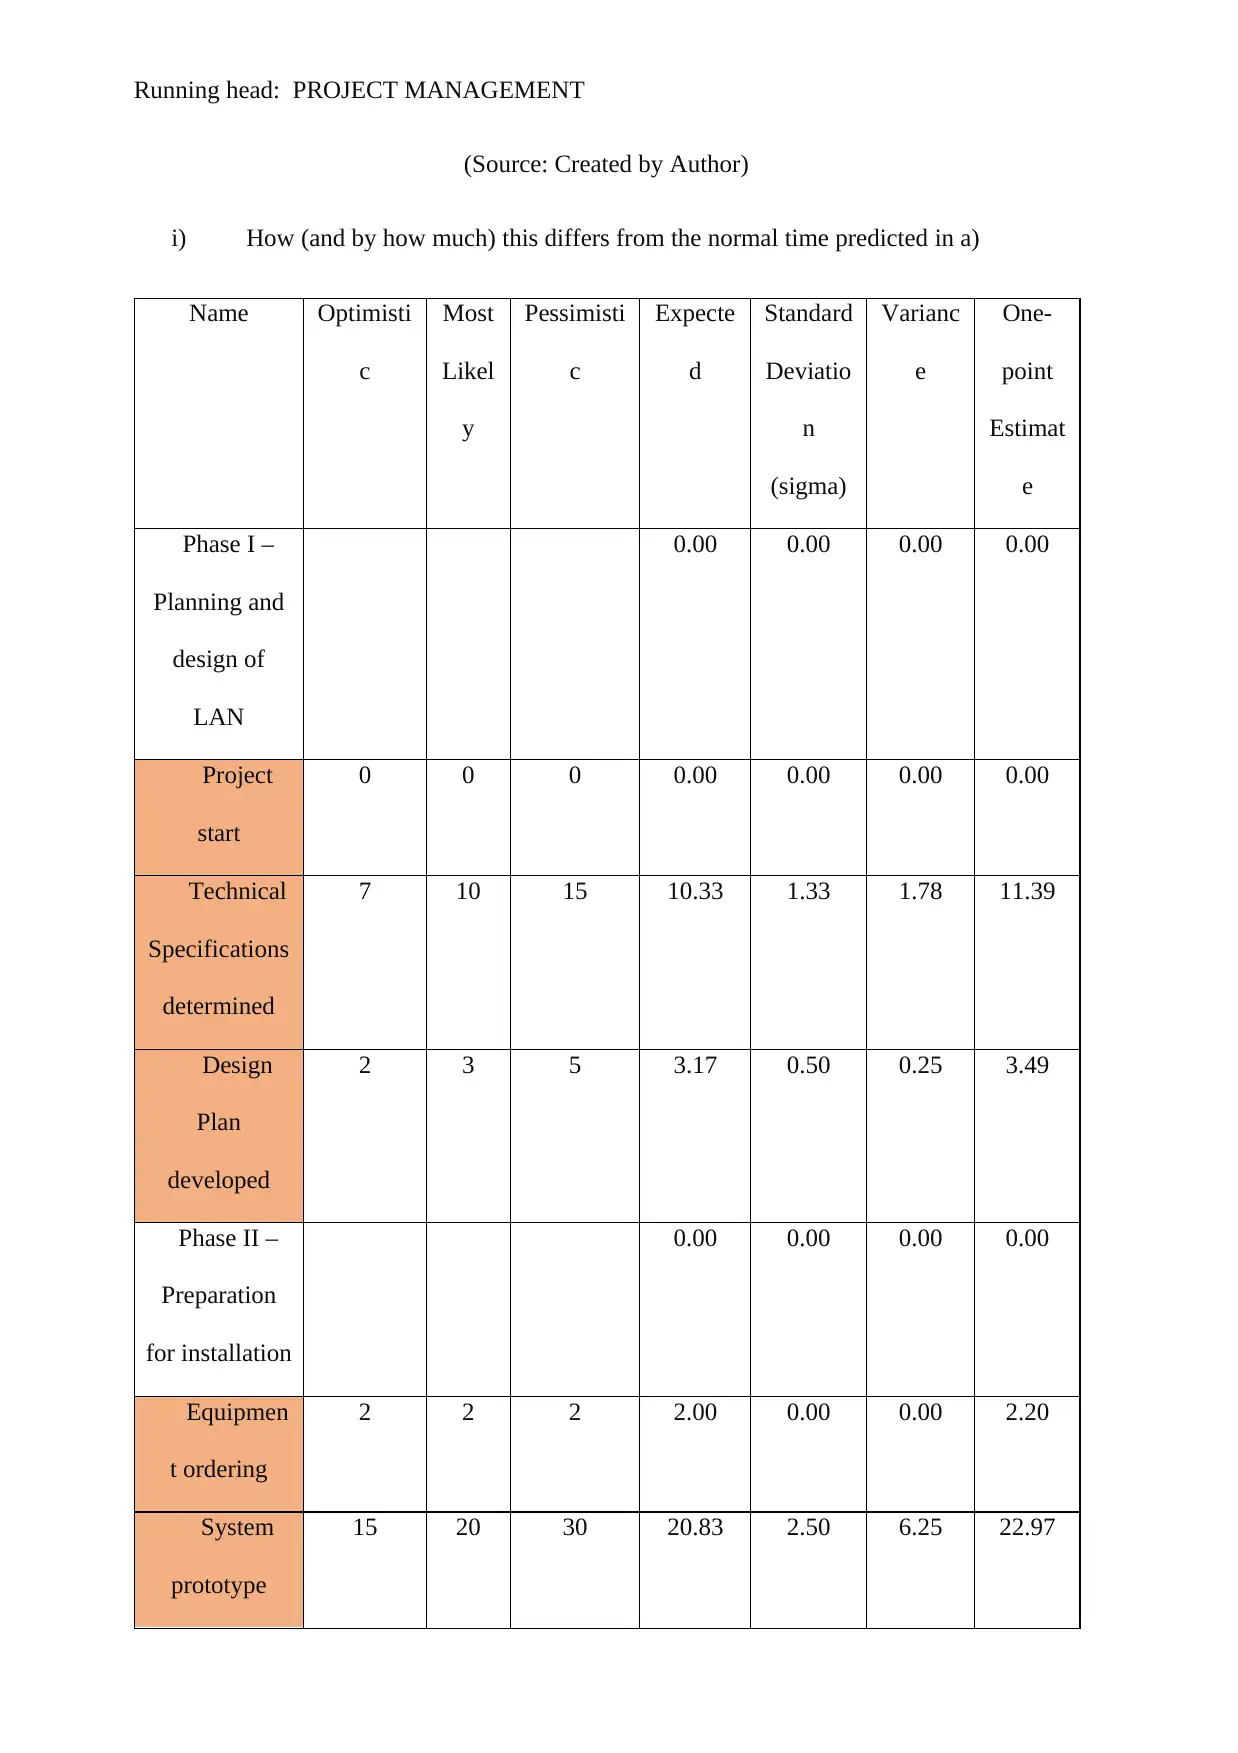
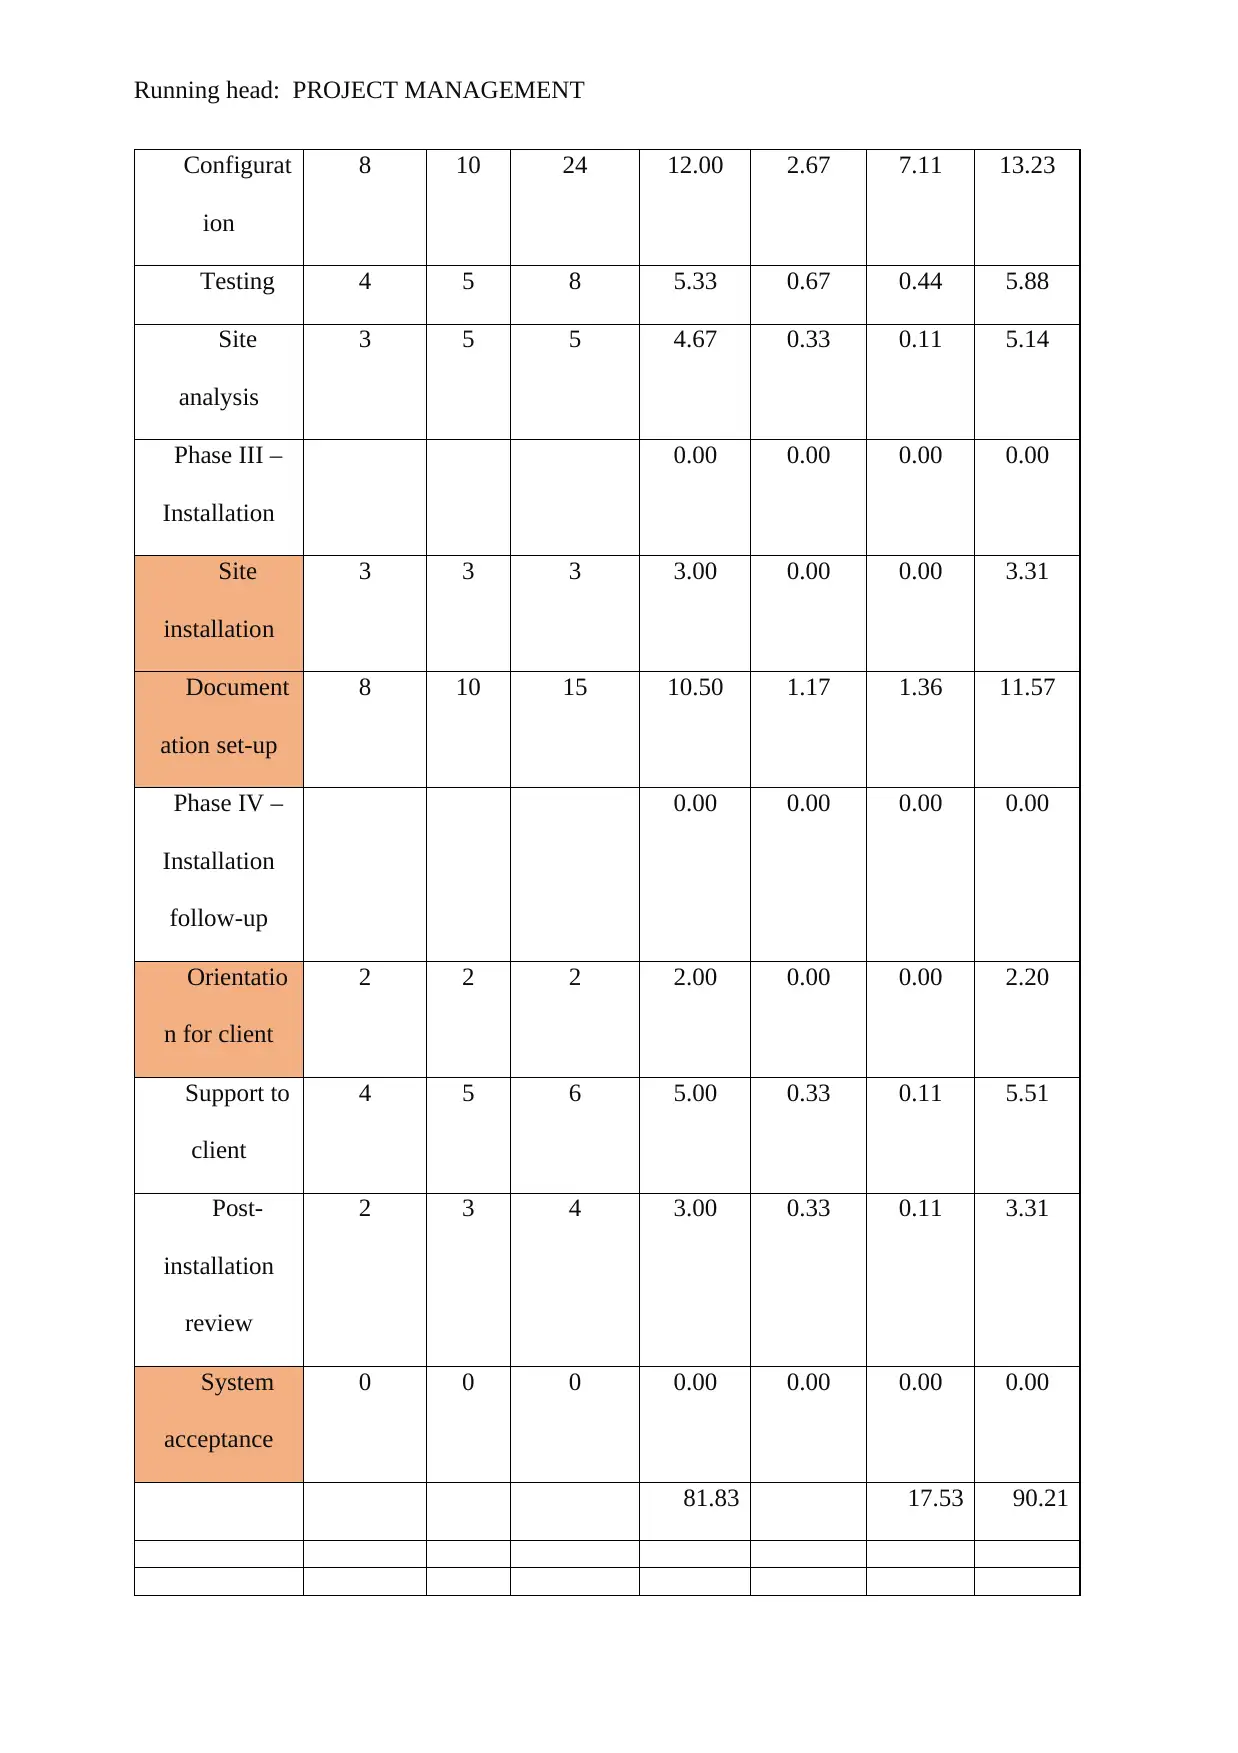
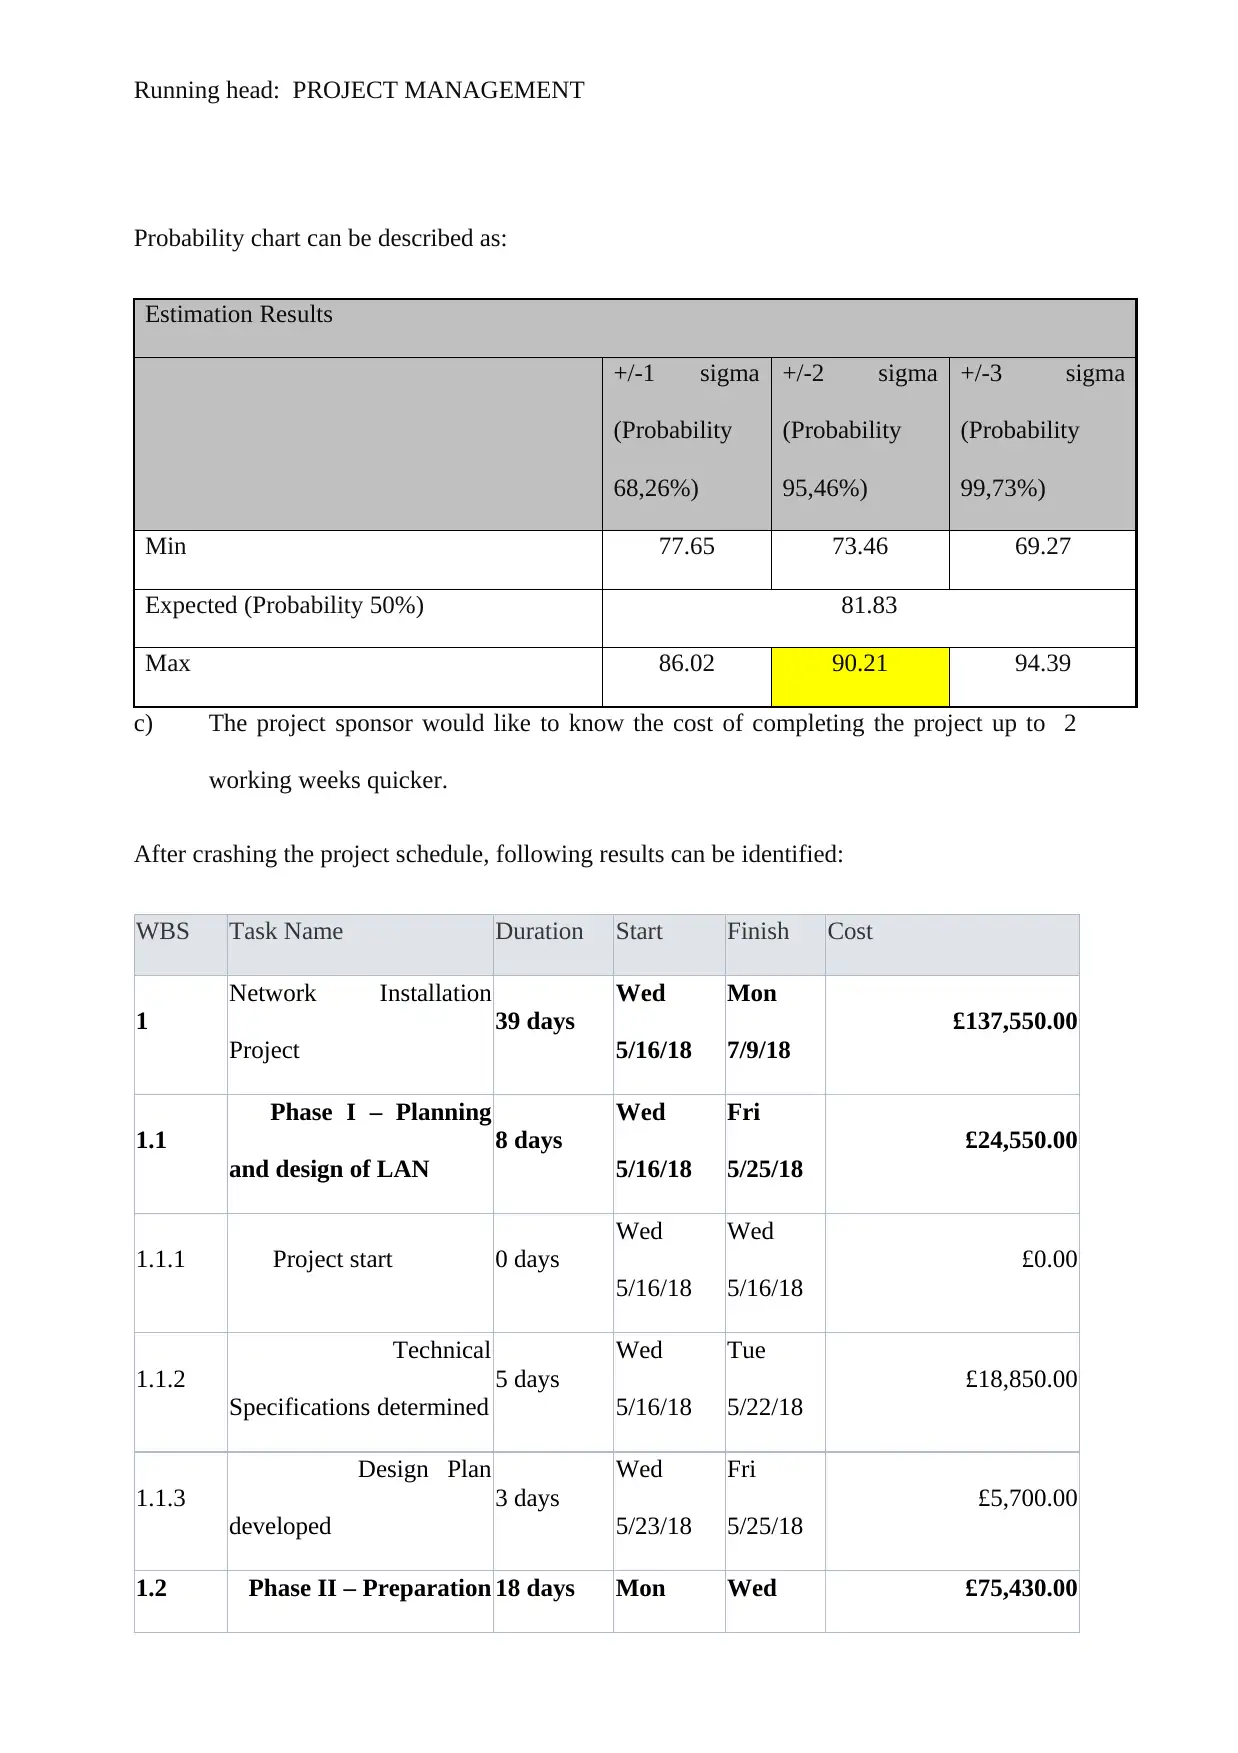
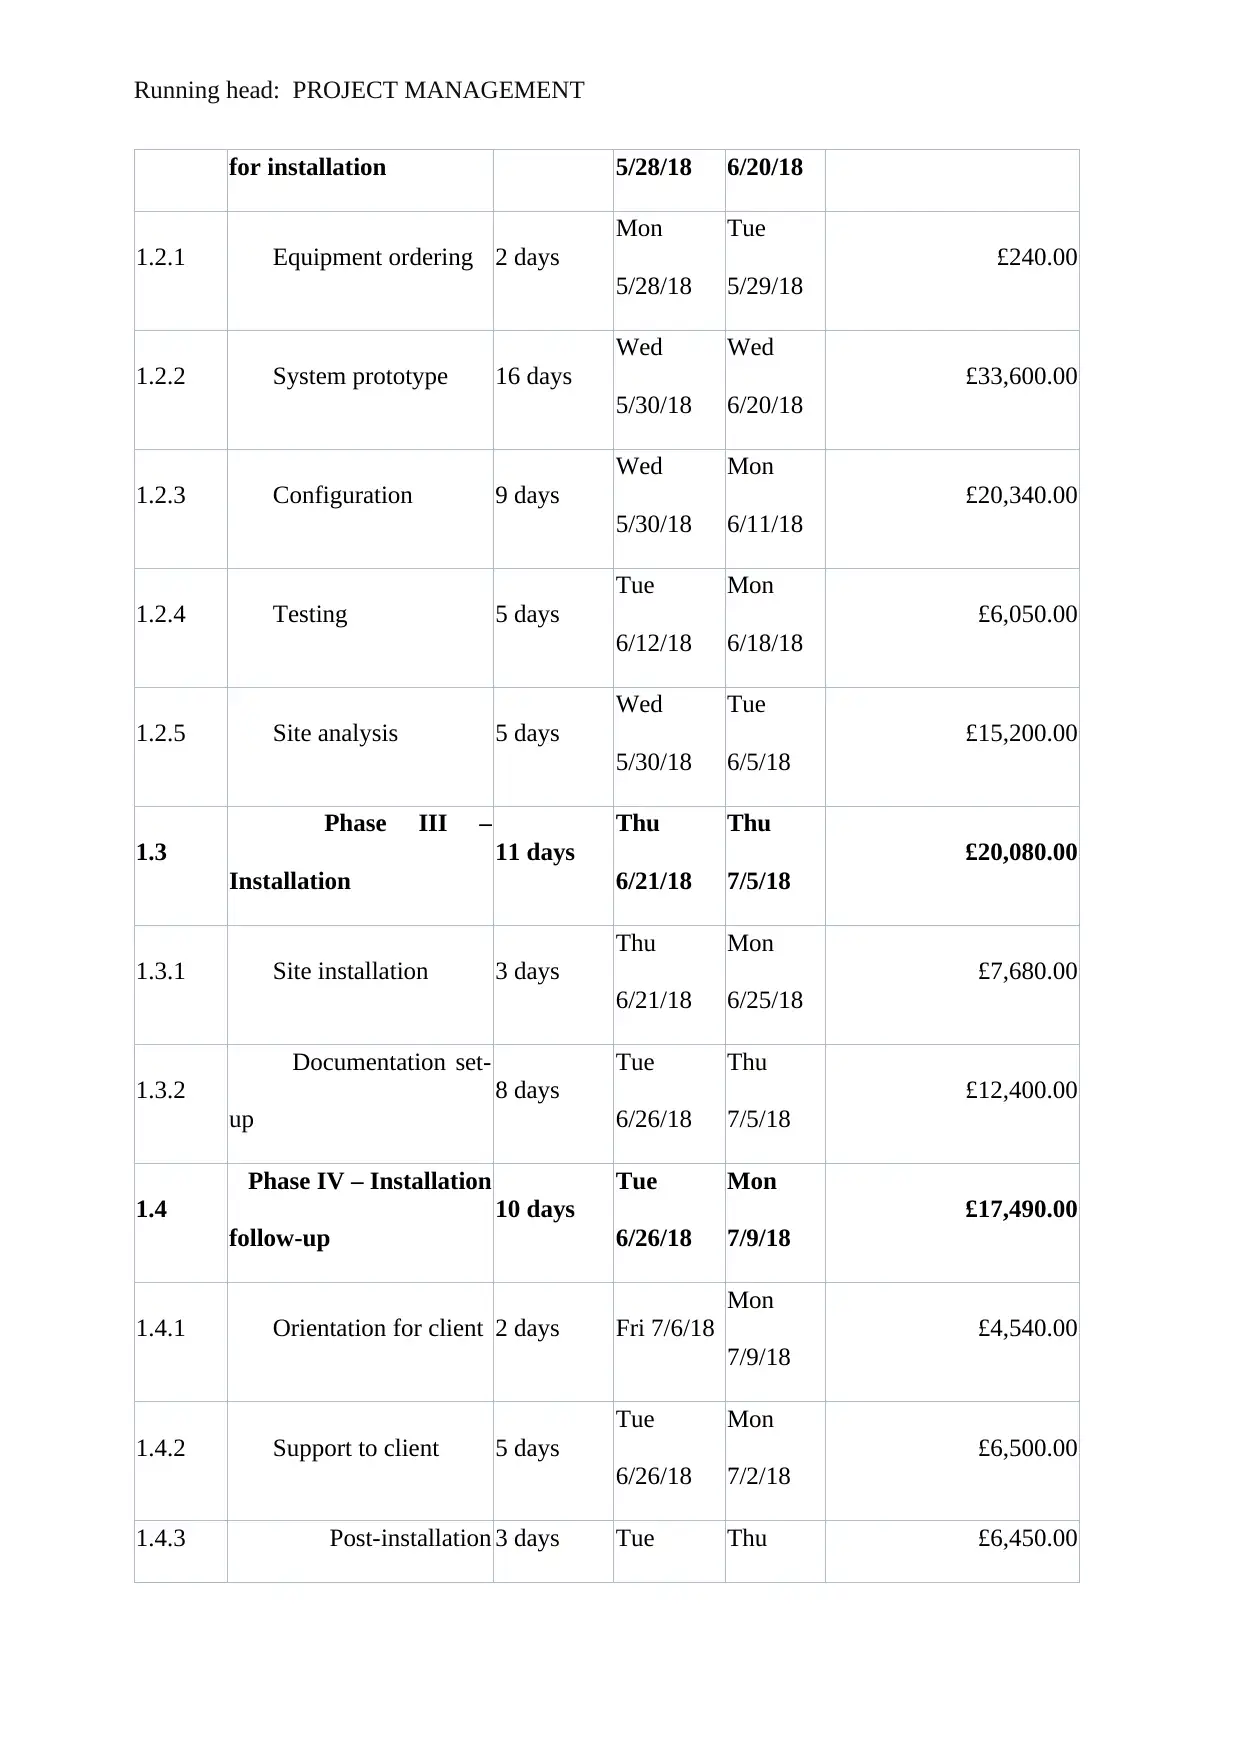
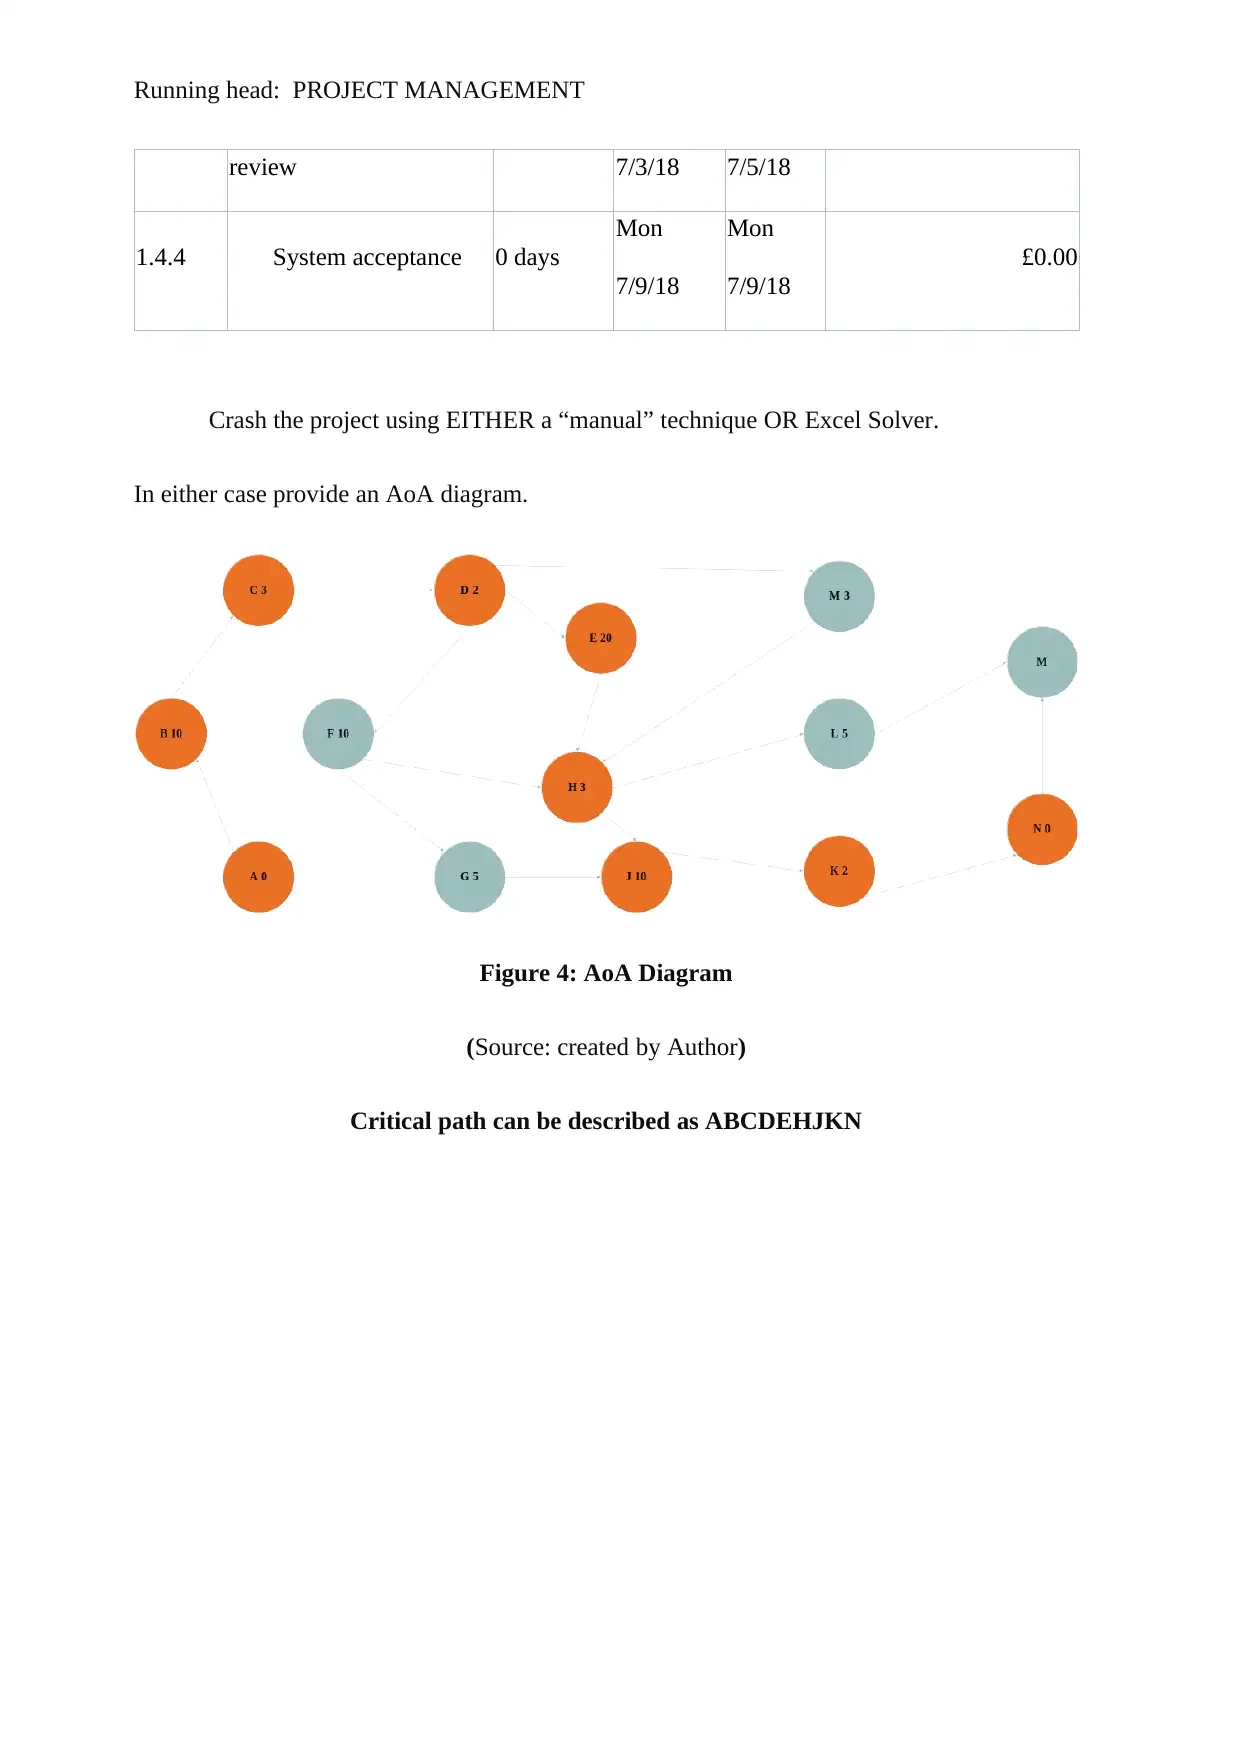
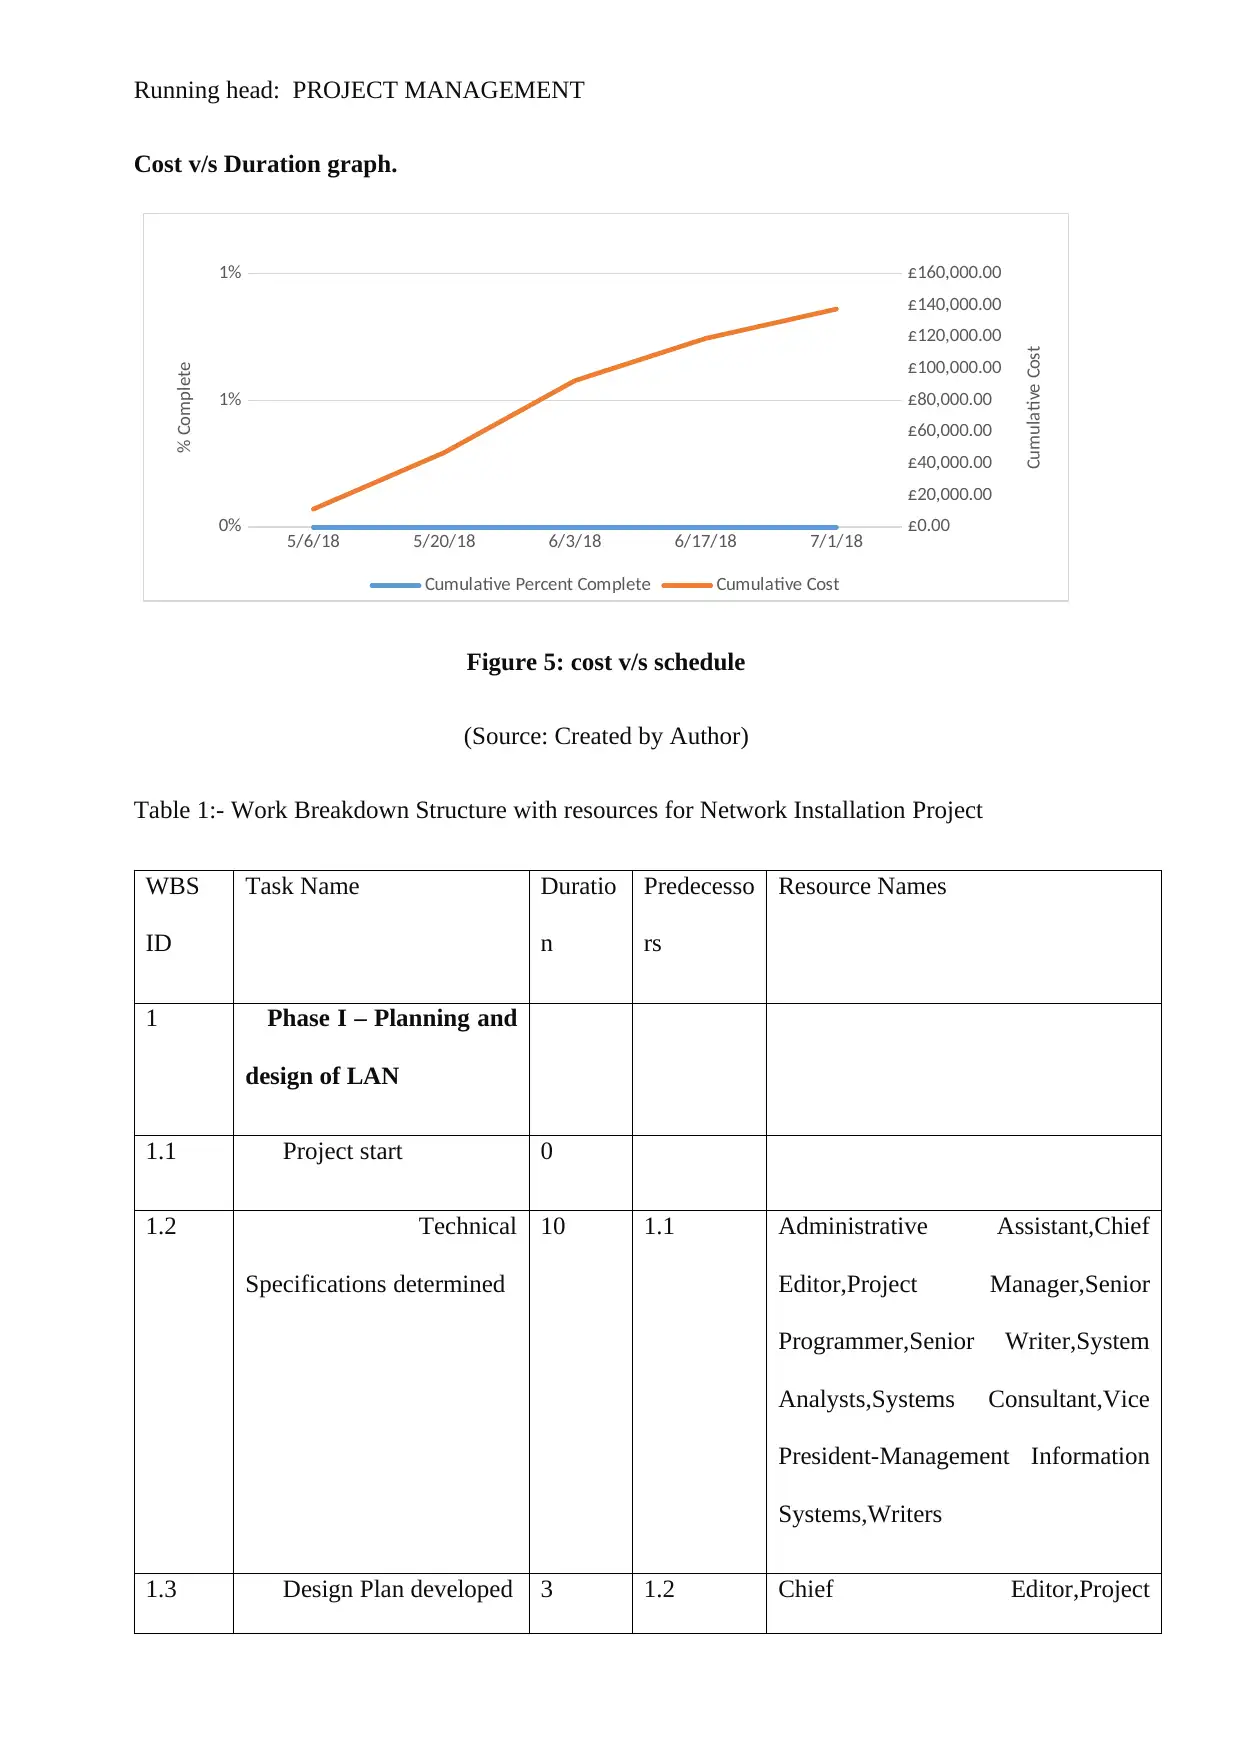
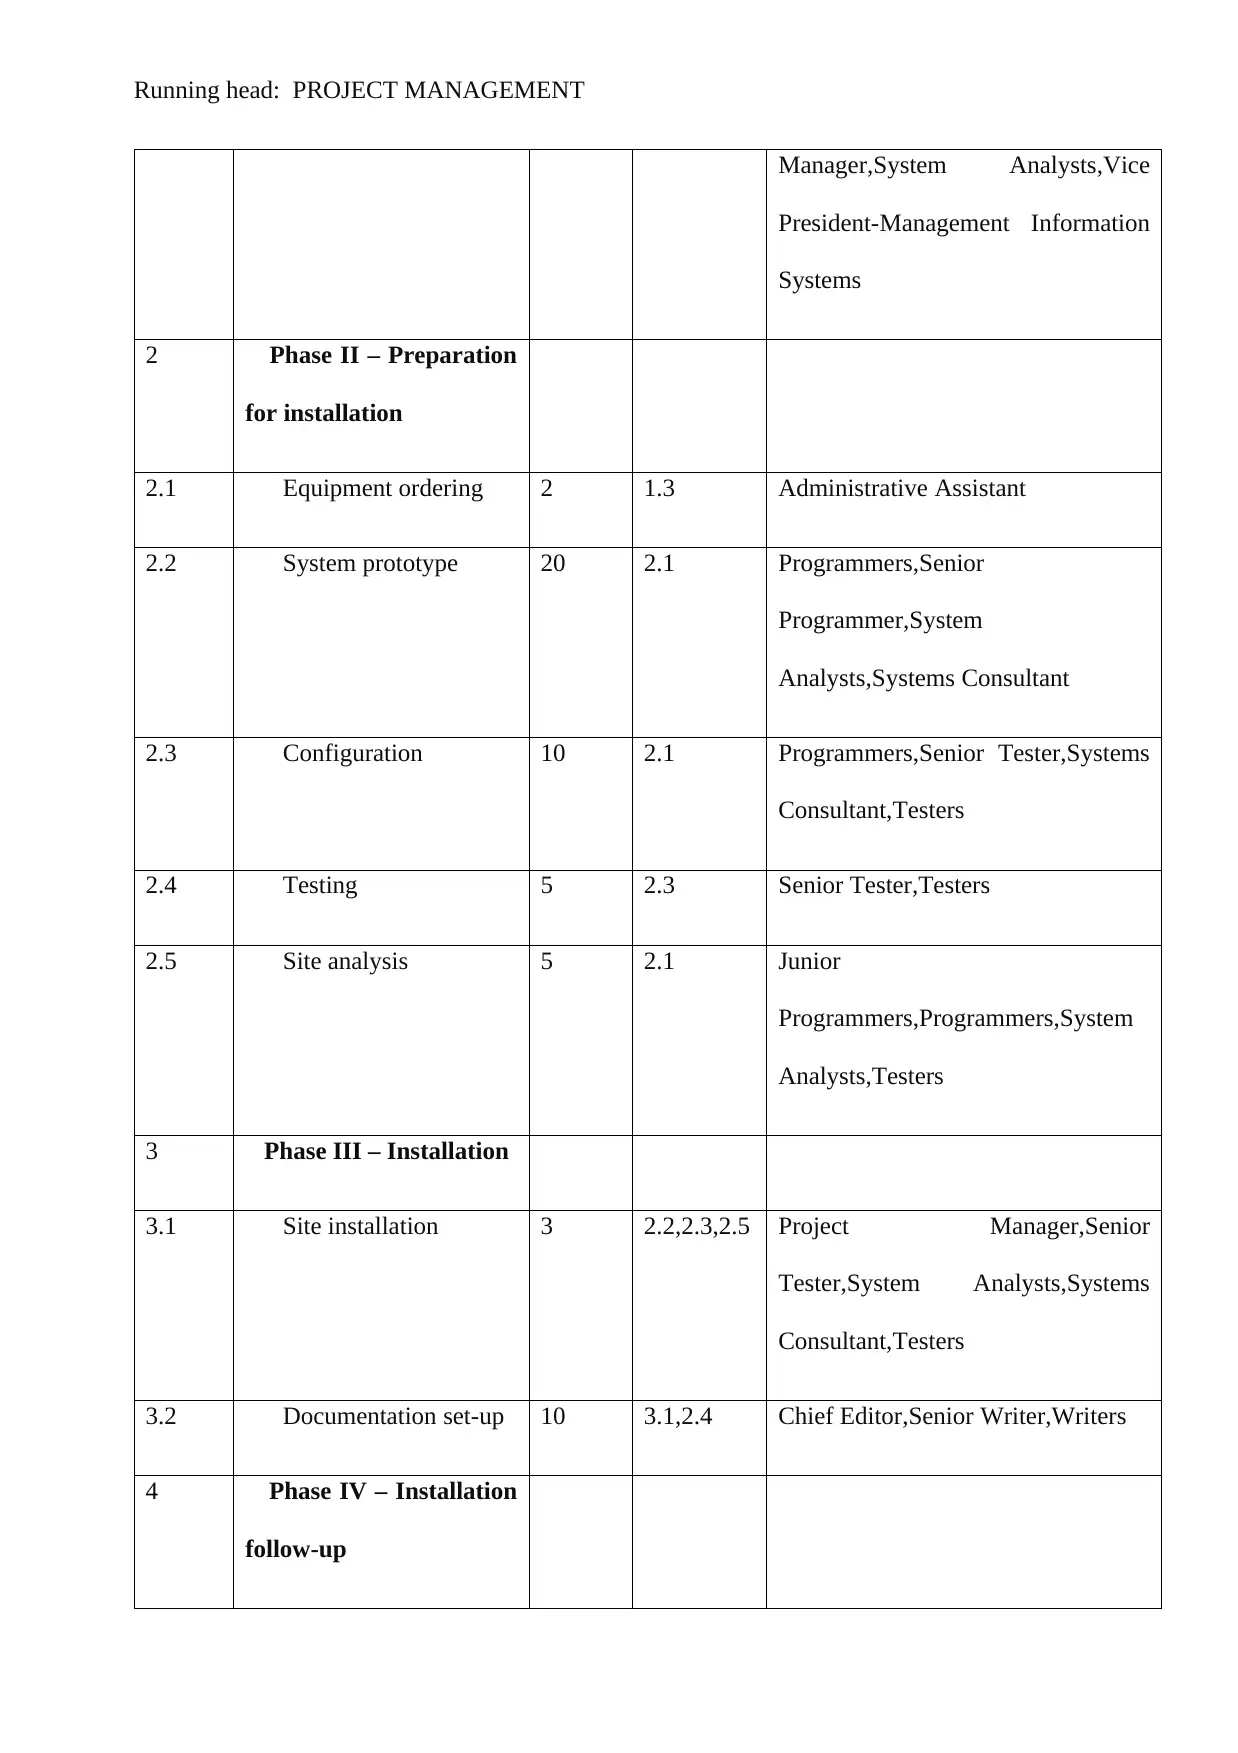
This project management assignment analyzes a network installation project, presenting a comprehensive overview of project planning, execution, and control. The solution begins with a Gantt chart outlining the project's timeline and activities, followed by an explanation of the assumptions made during the planning phase. A probabilistic technique (PERT) is then applied to create an AON network, with detailed estimations of optimistic, most likely, and pessimistic durations for each task. The analysis includes calculations of expected time, standard deviation, and variance, along with a probability chart. Furthermore, the assignment addresses project crashing to expedite completion, providing an AoA diagram and a cost-duration graph. The project utilizes work breakdown structures, resource allocation, and cost analysis to optimize the project schedule. Tables detailing task dependencies, resource assignments, and crash costs are included. The project culminates in a cost versus duration analysis. The solution also includes a bibliography of relevant project management resources.
Document Page
Running head: PROJECT MANAGEMENT
Project Management
Name of the Student
Name of the University
Author Note
tabler-icon-diamond-filled.svg

Secure Best Marks with AI Grader

Need help grading? Try our AI Grader for instant feedback on your assignments.
Document Page
Running head: PROJECT MANAGEMENT
Table of Contents
Gantt Chart..................................................................................................................................1
Section 1.....................................................................................................................................2
Cost v/s Duration graph..............................................................................................................8
Document Page
1
PROJECT MANAGEMENT
Gantt Chart
Figure 1: Gantt chart (Source: Created by Author)
Document Page
Running head: PROJECT MANAGEMENT
Section 1
a) I had assumed that predecessors and the same resources utilized in the tables made
available earlier and produced the Gantt chart as desired. I used the same data and information
for preparing the above Gantt chart. The assumptions those were taken in consideration that
the overload can be handled by the human resources involved in the project and above Gantt
chart explains how the project and related activities will be accomplished within the expected
deadline. The expected constraints have been explained in the above picture. I assumed that
resources will have not to work on the Saturdays Sundays, and national holidays.
The projected data in the mentioned tables explain the overall project planning phase
of the network installation phase will be completed in 50 days except the holidays and
Saturday, Sunday. The project will need to be started on 22nd December 2017 in manner to
completed the project at 1st march 2018.
b) Apply a Probabilistic technique (PERT) and produce an AON network for the
project using expected time. Explain/estimate:-
tabler-icon-diamond-filled.svg

Secure Best Marks with AI Grader

Need help grading? Try our AI Grader for instant feedback on your assignments.
Document Page
Running head: PROJECT MANAGEMENT
Figure 2: PERT Chart
(Source: Created by Author)
Figure 3: AON Diagram
Document Page
Running head: PROJECT MANAGEMENT
(Source: Created by Author)
i) How (and by how much) this differs from the normal time predicted in a)
Name Optimisti
c
Most
Likel
y
Pessimisti
c
Expecte
d
Standard
Deviatio
n
(sigma)
Varianc
e
One-
point
Estimat
e
Phase I –
Planning and
design of
LAN
0.00 0.00 0.00 0.00
Project
start
0 0 0 0.00 0.00 0.00 0.00
Technical
Specifications
determined
7 10 15 10.33 1.33 1.78 11.39
Design
Plan
developed
2 3 5 3.17 0.50 0.25 3.49
Phase II –
Preparation
for installation
0.00 0.00 0.00 0.00
Equipmen
t ordering
2 2 2 2.00 0.00 0.00 2.20
System
prototype
15 20 30 20.83 2.50 6.25 22.97
Document Page
Running head: PROJECT MANAGEMENT
Configurat
ion
8 10 24 12.00 2.67 7.11 13.23
Testing 4 5 8 5.33 0.67 0.44 5.88
Site
analysis
3 5 5 4.67 0.33 0.11 5.14
Phase III –
Installation
0.00 0.00 0.00 0.00
Site
installation
3 3 3 3.00 0.00 0.00 3.31
Document
ation set-up
8 10 15 10.50 1.17 1.36 11.57
Phase IV –
Installation
follow-up
0.00 0.00 0.00 0.00
Orientatio
n for client
2 2 2 2.00 0.00 0.00 2.20
Support to
client
4 5 6 5.00 0.33 0.11 5.51
Post-
installation
review
2 3 4 3.00 0.33 0.11 3.31
System
acceptance
0 0 0 0.00 0.00 0.00 0.00
81.83 17.53 90.21
tabler-icon-diamond-filled.svg

Paraphrase This Document

Need a fresh take? Get an instant paraphrase of this document with our AI Paraphraser
Document Page
Running head: PROJECT MANAGEMENT
Probability chart can be described as:
Estimation Results
+/-1 sigma
(Probability
68,26%)
+/-2 sigma
(Probability
95,46%)
+/-3 sigma
(Probability
99,73%)
Min 77.65 73.46 69.27
Expected (Probability 50%) 81.83
Max 86.02 90.21 94.39
c) The project sponsor would like to know the cost of completing the project up to 2
working weeks quicker.
After crashing the project schedule, following results can be identified:
WBS Task Name Duration Start Finish Cost
1
Network Installation
Project
39 days
Wed
5/16/18
Mon
7/9/18
£137,550.00
1.1
Phase I – Planning
and design of LAN
8 days
Wed
5/16/18
Fri
5/25/18
£24,550.00
1.1.1 Project start 0 days
Wed
5/16/18
Wed
5/16/18
£0.00
1.1.2
Technical
Specifications determined
5 days
Wed
5/16/18
Tue
5/22/18
£18,850.00
1.1.3
Design Plan
developed
3 days
Wed
5/23/18
Fri
5/25/18
£5,700.00
1.2 Phase II – Preparation 18 days Mon Wed £75,430.00
Document Page
Running head: PROJECT MANAGEMENT
for installation 5/28/18 6/20/18
1.2.1 Equipment ordering 2 days
Mon
5/28/18
Tue
5/29/18
£240.00
1.2.2 System prototype 16 days
Wed
5/30/18
Wed
6/20/18
£33,600.00
1.2.3 Configuration 9 days
Wed
5/30/18
Mon
6/11/18
£20,340.00
1.2.4 Testing 5 days
Tue
6/12/18
Mon
6/18/18
£6,050.00
1.2.5 Site analysis 5 days
Wed
5/30/18
Tue
6/5/18
£15,200.00
1.3
Phase III
Installation
11 days
Thu
6/21/18
Thu
7/5/18
£20,080.00
1.3.1 Site installation 3 days
Thu
6/21/18
Mon
6/25/18
£7,680.00
1.3.2
Documentation set-
up
8 days
Tue
6/26/18
Thu
7/5/18
£12,400.00
1.4
Phase IV – Installation
follow-up
10 days
Tue
6/26/18
Mon
7/9/18
£17,490.00
1.4.1 Orientation for client 2 days Fri 7/6/18
Mon
7/9/18
£4,540.00
1.4.2 Support to client 5 days
Tue
6/26/18
Mon
7/2/18
£6,500.00
1.4.3 Post-installation 3 days Tue Thu £6,450.00
Document Page
Running head: PROJECT MANAGEMENT
review 7/3/18 7/5/18
1.4.4 System acceptance 0 days
Mon
7/9/18
Mon
7/9/18
£0.00
Crash the project using EITHER a “manual” technique OR Excel Solver.
In either case provide an AoA diagram.
Figure 4: AoA Diagram
(Source: created by Author)
Critical path can be described as ABCDEHJKN
tabler-icon-diamond-filled.svg

Secure Best Marks with AI Grader

Need help grading? Try our AI Grader for instant feedback on your assignments.
Document Page
Running head: PROJECT MANAGEMENT
Cost v/s Duration graph.
5/6/18 5/20/18 6/3/18 6/17/18 7/1/18
0%
1%
1%
£0.00
£20,000.00
£40,000.00
£60,000.00
£80,000.00
£100,000.00
£120,000.00
£140,000.00
£160,000.00
Chart Title
Cumulative Percent Complete Cumulative Cost
% Complete
Cumulative Cost
Figure 5: cost v/s schedule
(Source: Created by Author)
Table 1:- Work Breakdown Structure with resources for Network Installation Project
WBS
ID
Task Name Duratio
n
Predecesso
rs
Resource Names
1 Phase I – Planning and
design of LAN
1.1 Project start 0
1.2 Technical
Specifications determined
10 1.1 Administrative Assistant,Chief
Editor,Project Manager,Senior
Programmer,Senior Writer,System
Analysts,Systems Consultant,Vice
President-Management Information
Systems,Writers
1.3 Design Plan developed 3 1.2 Chief Editor,Project
Document Page
Running head: PROJECT MANAGEMENT
Manager,System Analysts,Vice
President-Management Information
Systems
2 Phase II – Preparation
for installation
2.1 Equipment ordering 2 1.3 Administrative Assistant
2.2 System prototype 20 2.1 Programmers,Senior
Programmer,System
Analysts,Systems Consultant
2.3 Configuration 10 2.1 Programmers,Senior Tester,Systems
Consultant,Testers
2.4 Testing 5 2.3 Senior Tester,Testers
2.5 Site analysis 5 2.1 Junior
Programmers,Programmers,System
Analysts,Testers
3 Phase III – Installation
3.1 Site installation 3 2.2,2.3,2.5 Project Manager,Senior
Tester,System Analysts,Systems
Consultant,Testers
3.2 Documentation set-up 10 3.1,2.4 Chief Editor,Senior Writer,Writers
4 Phase IV – Installation
follow-up
Document Page
Running head: PROJECT MANAGEMENT
4.1 Orientation for client 2 3.2 Administrative
Assistant,Programmers,Project
Manager,System Analysts,Systems
Consultant
4.2 Support to client 5 3.1 Project Manager,Senior
Programmer,Senior Tester,Senior
Writer,Systems Consultant
4.3 Post-installation
review
3 4.2 Chief Editor,Project
Manager,System Analysts,Systems
Consultant,Vice President-
Management Information Systems
4.4 System acceptance 0 4.3, 4.1
tabler-icon-diamond-filled.svg

Paraphrase This Document

Need a fresh take? Get an instant paraphrase of this document with our AI Paraphraser
Document Page
Running head: PROJECT MANAGEMENT
Table 2 Uncertainty of Durations in the Network Installation
3
WBS ID Task Name Predecesso
rs
Normal
Duratio
n
Optimis
tic
Duratio
n
Pessimis
tic
Duration
1 Phase I – Planning and
design of LAN
1.1 Project start 0 0 0
1.2 Technical Specifications
determined
1.1 10 7 15
1.3 Design Plan developed 1.2 3 2 5
2 Phase II – Preparation
for installation
2.1 Equipment ordering 1.3 2 2 2
2.2 System prototype 2.1 20 15 30
2.3 Configuration 2.1 10 8 24
2.4 Testing 2.3 5 4 8
2.5 Site analysis 2.1 5 3 5
3 Phase III – Installation
3.1 Site installation 2.2,2.3,2.5 3 3 3
Document Page
Running head: PROJECT MANAGEMENT
3.2 Documentation set-up 3.1,2.4 10 8 15
4 Phase IV – Installation
follow-up
4.1 Orientation for client 3.2 2 2 2
4.2 Support to client 3.1 5 4 6
4.3 Post-installation review 4.2 3 2 4
4.4 System acceptance 4.3, 4.1 0 0 0
Document Page
Running head: PROJECT MANAGEMENT
Table 3 Crash Durations and Costs
WBS
ID
Task Name Normal
Duratio
n
Crashed
Duratio
n
Crashed
cost
1 Phase I – Planning and design
of LAN
1.1 Project start 0
1.2 Technical Specifications
determined
10 7 £54,700.0
0
1.3 Design Plan developed 3 2 £8,600.00
2 Phase II – Preparation for
installation
2.1 Equipment ordering 2 2 £240.00
2.2 System prototype 20 15 £57,800.0
0
2.3 Configuration 10 8 £29,400.0
0
2.4 Testing 5 4 £7,900.00
2.5 Site analysis 5 3 £24,400.0
0
tabler-icon-diamond-filled.svg

Secure Best Marks with AI Grader

Need help grading? Try our AI Grader for instant feedback on your assignments.
Document Page
Running head: PROJECT MANAGEMENT
3 Phase III – Installation
3.1 Site installation 3 3 £7,680.00
3.2 Documentation set-up 10 8 £20,200.0
0
4 Phase IV Installation
follow-up
4.1 Orientation for client 2 2 £4,540.00
4.2 Support to client 5 4 £8,500.00
4.3 Post-installation review 3 2 £9,700.00
4.4 System acceptance 0
*Assume that all tasks can be crashed incrementally
HINT- your normal costs will come from your basic schedule
Document Page
Running head: PROJECT MANAGEMENT
Table 4 Resources and costs.
Document Page
Running head: PROJECT MANAGEMENT
Resource Name Initials Max.
Units
Std. Rate Ovt. Rate
Vice President-Management
Information Systems
VPMIS 100% £500.00/day £0.00/hr
Project Manager PM 100% £300.00/day £0.00/hr
Chief Editor CW 100% £300.00/day £0.00/hr
Senior Programmer SP 100% £250.00/day £0.00/hr
Senior Writer SW 100% £250.00/day £0.00/hr
Senior Tester ST 100% £250.00/day £0.00/hr
Systems Consultant SC 100% £250.00/day £0.00/hr
System Analysts (Team of 4) SA 150% £100.00/hr £150.00/hr
Testers (team of 4) T 150% £120.00/hr £180.00/hr
Writers (Team of 5) W 150% £125.00/hr £190.00/hr
Programmers (Team of 4) P 150% £100.00/hr £160.00/hr
Administrative Assistant AA 100% £15.00/hr £25.00/hr
Junior Programmers (Team
of 4)
JP 100% £60.00/hr £90.00/hr
chevron_up_icon
1 out of 19
circle_padding
hide_on_mobile
zoom_out_icon
logo.png

Your All-in-One AI-Powered Toolkit for Academic Success.

Available 24*7 on WhatsApp / Email

[object Object]