Analyzing ManageEngine OpManager for Networked Application Management

Verified

Added on  2023/01/19

|11
|2481
|47
Report
AI Summary
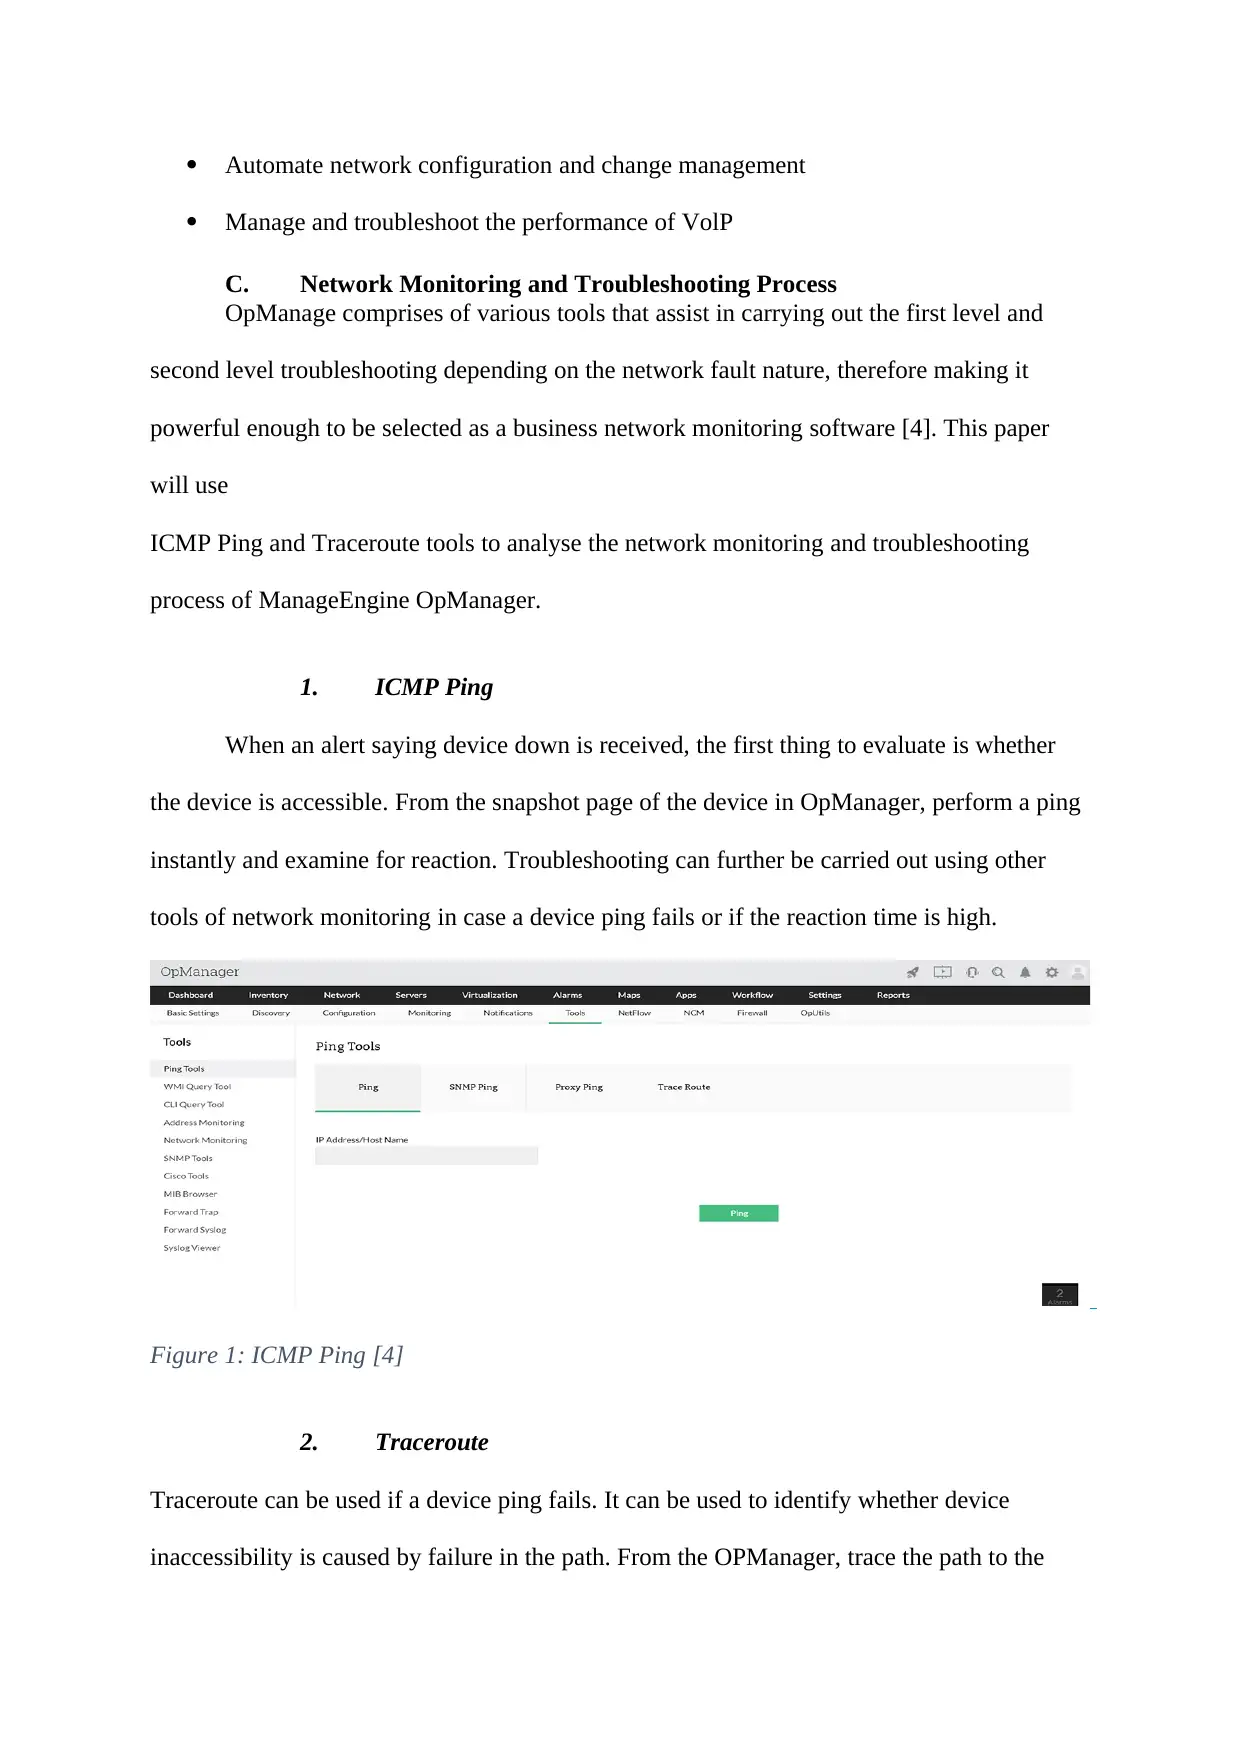
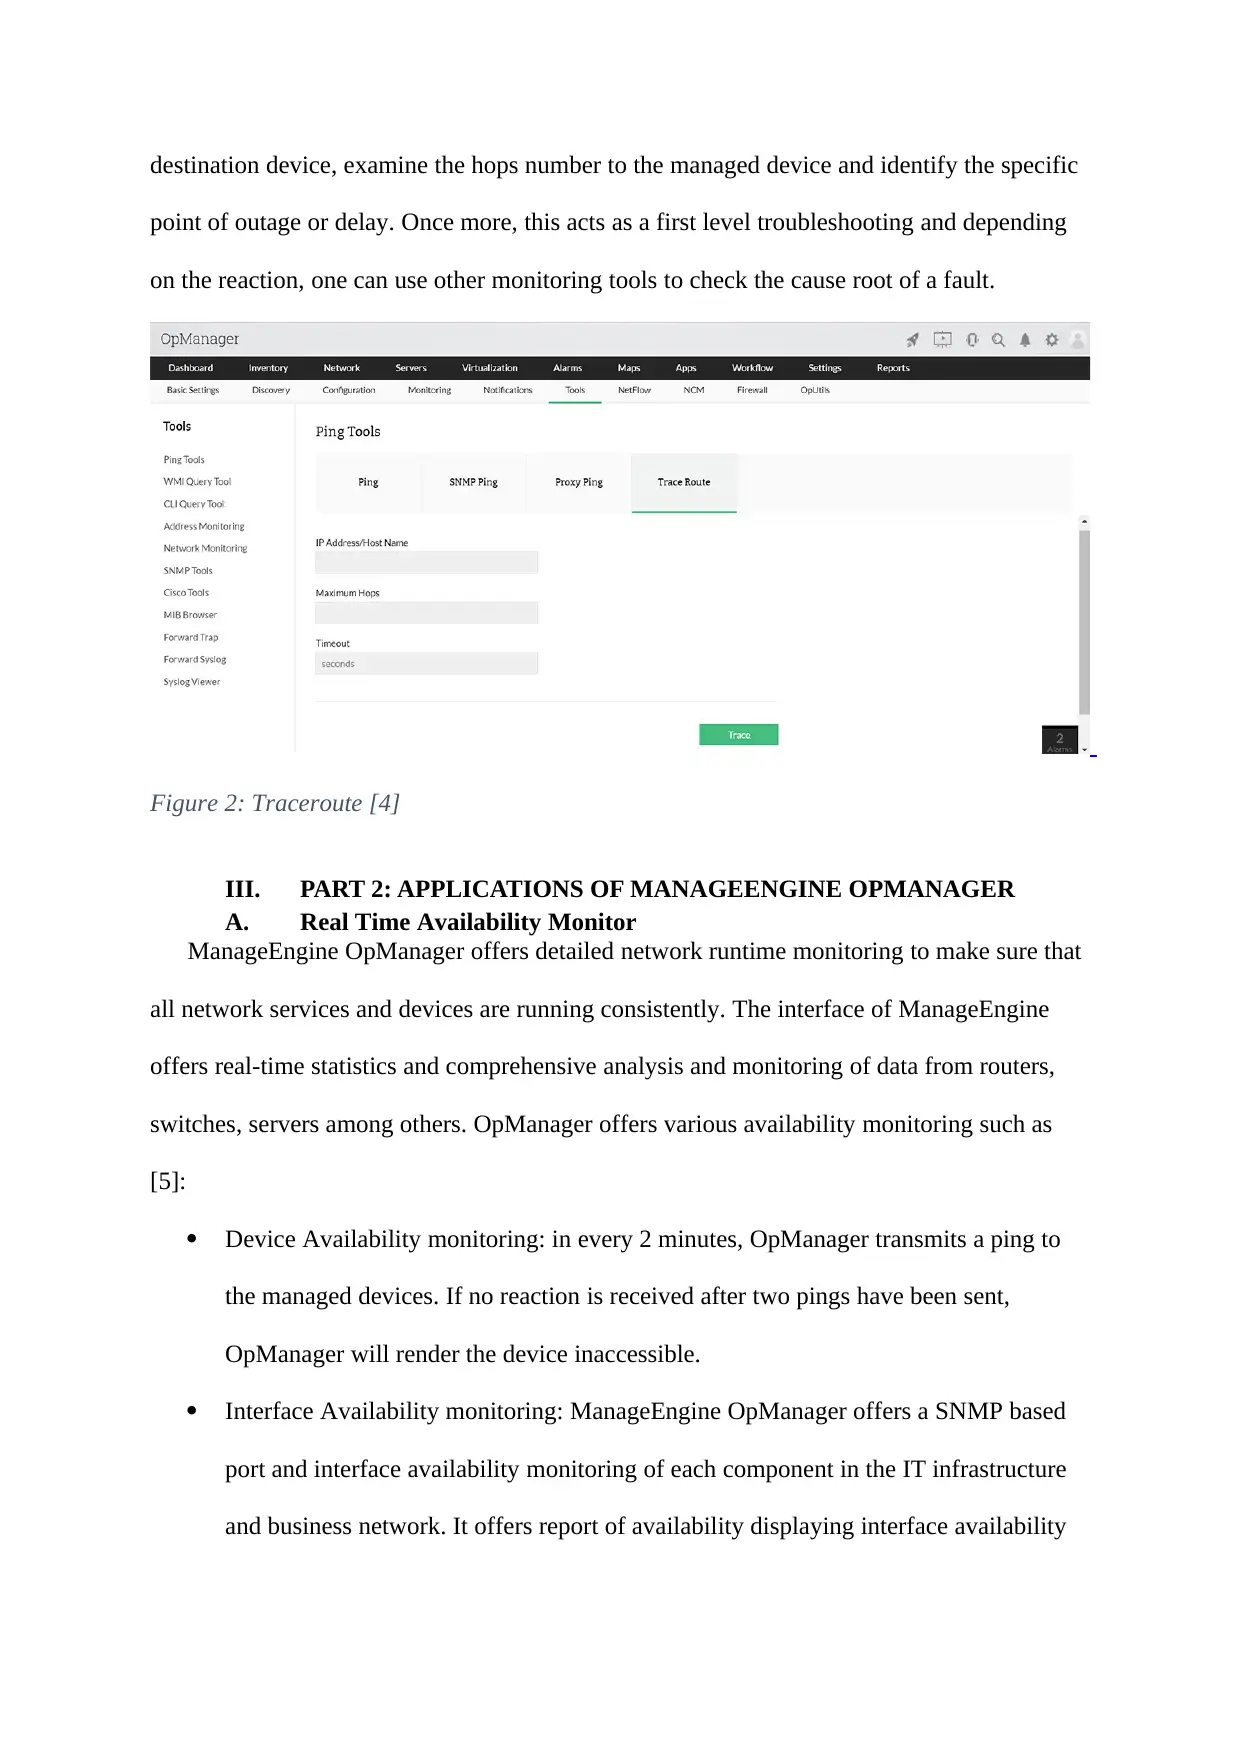
This report analyzes ManageEngine OpManager, a network management tool, focusing on its application in network application management. It begins with an introduction to the importance of network monitoring and the role of OpManager in providing a comprehensive solution. The report delves into the network performance management capabilities of OpManager, including CPU and memory monitoring, error and discard analysis, availability checks, traffic analysis, and WAN performance monitoring. It explores the reasons why OpManager is a suitable choice for network monitoring, highlighting its features for network traffic visibility, WAN problem troubleshooting, device health monitoring, configuration automation, and VoIP performance management. The report then examines the network monitoring and troubleshooting process using ICMP Ping and Traceroute tools within OpManager. Furthermore, it discusses the real-time availability monitoring features, including device, interface, WAN, service, Windows service, website, and process availability monitoring. The report also covers network traffic analysis using NetFlow, detailing the steps involved in identifying and resolving bandwidth issues. Finally, the report compares ManageEngine OpManager with SolarWinds Network Performance Monitor, evaluating their network monitoring, bandwidth monitoring, and visualization features, and concludes with a comparative analysis, emphasizing OpManager's advantages in terms of price and suitability for smaller organizations, while acknowledging SolarWinds' strengths in dashboard design and deployment.
Document Page
Network Application Management
Name
Course
Date
tabler-icon-diamond-filled.svg

Paraphrase This Document

Need a fresh take? Get an instant paraphrase of this document with our AI Paraphraser
Document Page
I. INTRODUCTION
Companies depend on networks for all processes. Therefore, network monitoring is
vital for any firm. In the modern era, networks span worldwide, having several links
developed between geographically disconnected data centers, private and public clouds. This
generates problems in the management of network. Nevertheless, it is made easy by
presenting ManageEngine OpManager, an affordable and easy to use solution of network
monitoring. It manages network tools such as switches, load balancers, servers, printers,
routers, firewalls, wireless LAN controllers, VMs, storage devices, and everything linked to
the network and has an IP [1]. OpManager constantly manages the network and offer a full
control and visibility over it. If a fault occurs, it is easy to find the root cause and remove it
before affecting operations.
II. PART 1: MANAGEENGINE OPMANAGER
A. Network Performance Management
Networks are the pillars of all businesses. Network outage can lead to immense
damages, as such, companies should monitor their network regularly. Network monitoring
assists in anticipating for outages that are likely to occur and solve network issues
proactively. This assists in maintaining a network that is congestion-free thus allowing the
business to run smoothly. A network monitoring tool assists in monitoring the performance of
any IP machine and assist companies visualize the performance of their system and manage
bandwidth usage, routers, network services, switches and traffic flow [2].
Most shops of IT use several tools of network monitoring to manage and monitor network
operations. Nevertheless, if a fault occurs, they have to examine many tools, graphs, GUI,
and reports to find the root cause of the problem. ManageEngine OpManager provide insights
into different challenging network areas. It permits one to get to the bottom of the issue and
Document Page
resolve it quickly. The following are some of the factors that will examine the network
performance management of ManageEngine OpManager:
CPU and memory: OpManage allow one to manage devices using WMI, SSH,
SNMP, Telnet and VMware native API. One can identify and troubleshoot server and
CPU blockage before affecting the consumer. With OpManager, one can also monitor
essential metrics such as speed, processor time, utilization and idle time.
Errors and discards: OpManager assist in monitoring and minimizing packet loss
caused by errors and discards.
Availability: OpManager notifies all examined devices at a specified monitoring times
and if the packet loss or response time is huge or any device is down, OpManager
creates an alert immediately through text message or email
Traffic: OpManager helps in identifying bandwidth hogs that in turn help in adjusting
the network traffic before affecting the network. The simple management protocol of
OpManager allows one to monitor the traffic of a device.
WAN performance: OpManager helps one to examine WAN latency, monitor WAN
connections and detect network traffic across WAN network. This assist in assigning
resources appropriately to rank traffic and respond proactively to any problems
affecting WAN network.
B. Reasons why OpManager is a perfect fit for network monitoring
OpManager provides a proactive solution of network monitoring and consists of
strong features that allow IT managers to address network issues quickly and manage their
network.
OPManager helps to [3]:
Acquire visibility in patterns of network traffic
Examine and troubleshoot WAN problems
Ensure that all network devices are functioning well
Document Page
Automate network configuration and change management
Manage and troubleshoot the performance of VolP
C. Network Monitoring and Troubleshooting Process
OpManage comprises of various tools that assist in carrying out the first level and
second level troubleshooting depending on the network fault nature, therefore making it
powerful enough to be selected as a business network monitoring software [4]. This paper
will use
ICMP Ping and Traceroute tools to analyse the network monitoring and troubleshooting
process of ManageEngine OpManager.
1. ICMP Ping
When an alert saying device down is received, the first thing to evaluate is whether
the device is accessible. From the snapshot page of the device in OpManager, perform a ping
instantly and examine for reaction. Troubleshooting can further be carried out using other
tools of network monitoring in case a device ping fails or if the reaction time is high.
Figure 1: ICMP Ping [4]
2. Traceroute
Traceroute can be used if a device ping fails. It can be used to identify whether device
inaccessibility is caused by failure in the path. From the OPManager, trace the path to the
tabler-icon-diamond-filled.svg

Paraphrase This Document

Need a fresh take? Get an instant paraphrase of this document with our AI Paraphraser
Document Page
destination device, examine the hops number to the managed device and identify the specific
point of outage or delay. Once more, this acts as a first level troubleshooting and depending
on the reaction, one can use other monitoring tools to check the cause root of a fault.
Figure 2: Traceroute [4]
III. PART 2: APPLICATIONS OF MANAGEENGINE OPMANAGER
A. Real Time Availability Monitor
ManageEngine OpManager offers detailed network runtime monitoring to make sure that
all network services and devices are running consistently. The interface of ManageEngine
offers real-time statistics and comprehensive analysis and monitoring of data from routers,
switches, servers among others. OpManager offers various availability monitoring such as
[5]:
Device Availability monitoring: in every 2 minutes, OpManager transmits a ping to
the managed devices. If no reaction is received after two pings have been sent,
OpManager will render the device inaccessible.
Interface Availability monitoring: ManageEngine OpManager offers a SNMP based
port and interface availability monitoring of each component in the IT infrastructure
and business network. It offers report of availability displaying interface availability
Document Page
on monthly, weakly and daily basis to analyse the level of network availability and
make sure that SLAs are achieved.
WAN availability monitoring: OpManager manage availability of WAN link using
Cisco IP SLA and offers a simple solution for boosting WAN performance [6]. It
offers hop-wise information on WAN link bandwidth usage, latency, and Round-Trip-
Time using network dashboard for improving the performance WAN.
Service availability monitoring: OpManager offers comprehensive reports and graphs
about response and availability time of TCP services being monitored.
Windows services availability monitoring: OpManager uses WMI to monitor
windows services. Besides, OpManager can be configured by administrators to
automatically restart the server or the service when windows service is down.
Website availability monitoring: OpManager monitors intranet sites, web application
with a login, HTTPS URLS, web server farms, NTML authorized websites among
others.
Process availability monitoring: OpManager allows managers to remotely manage
and monitor operations that are executing on servers [7]. OpManager uses various
protocols to manage operations running on Linux, UNIX, IBM AIX, virtual machines
and VMware servers, Windows, Solaris, HP UX and ESX.
B. Network traffic analysis
The NetFlow monitoring component of OpManager offers visibility on bandwidth usage
and patterns of network traffic, with sFlow, IPFIX, NetFlow and j-Flow flow support.
Bandwidth monitoring occurs in real time and comprehensive reports are offered to identify
bandwidth problems before affecting consumers [8]. Besides, OpManager assists admins to
resolve bandwidth problems and minimize MTTR. The following are some of the steps that
can be used to analyse network traffic using OpManager’s NetFlow Add-on.
Document Page
1. A network manager takes an overall view of the whole network to identify the
problematic link using the business view of OpManager.
2. The administrator identifies the problem link and checks the root cause using NetFlow
charts to identify a specific user dominating most of the bandwidth
3. Additionally, the administrator notices an unspecified application is dominating most
of the bandwidth.
4. From OpManager, the administrator moves into the monitored switch which joins
laptops of all the users to the network. At this time, the network administrator has the
comprehensive switch ports list and the devices connected to them. Through the web
interface of OpManager, the administrator removes the laptop with the problem from
the network by turning down the port. This eliminates the bandwidth hog.
IV. MANAGEENGINE OPMANAGER VERSUS SOLARWINDS
NETWORK PERFORMANCE MONITOR
Both SolarWinds and ManageEngine have assisted in revolutionizing how IT
managers monitor business-level networks [9]. The two products deliver both simplicity and
versatility. The following are some of the main features that are going to help in evaluating
how well ManageEngine [10] OpManager and SolarWinds Network Performance Monitor
provide the network monitoring experience.
A. Network Monitoring
ManageEngine OpManager enables the user to manage devices based on metrics such
as availability, memory, performance, CPU and traffic. Every metrics have a vital piece of
information about the health of an infrastructure. SolarWinds Network Performance Monitor
on the other hand, monitors devices using the same metrics as those for ManageEngine
OpManager, alongside factors such as fan speed, temperature and power supply
tabler-icon-diamond-filled.svg

Paraphrase This Document

Need a fresh take? Get an instant paraphrase of this document with our AI Paraphraser
Document Page
B. Bandwidth Monitoring
ManageEngine OpManager provides great experience in respect to NetFlow analysis
and Bandwidth monitoring as it provides flow analysis for sFlow, IPFIX, NetFlow and jFlow.
This offers the basics required to examine network usage [11]. SolarWinds Network
Performance Monitor is more restricted as it requires SolarWinds NetFlow analyser to carry
out flow analysis.
C. Visualization
SolarWinds Network Performance Monitor has an extensive range of visualization
features such as charts, graphs and dials. One specific visual monitoring feature is referred to
as NetPath critical path visualization. It gathers performance data at every hop thus allowing
one to view the presence of a weak link. ManageEngine OpManager combines simple
designs of dashboard and graph charts in the same manner as the SolarWinds Network
Performance Monitor [12]. The most outstanding thing of ManageEngine OpManager is its
network map, which allows one to view geographical and topological maps of the network to
identify which devices are running.
V. CONCLUSION
Although both ManageEngine OpManager and SolarWinds Network Performance
Monitor are among the best network monitoring tools, SolarWinds Network Performance
Monitor is the dominating tool. Apart from monitoring devices using the same metrics as
those for ManageEngine OpManager, it uses other factors such as fan speed, temperature and
power supply. Besides, it is easy to maintain and setup. The greatest asset of SolarWinds
Network Performance Monitor is the consistency of the transformation from setup-auto
discovery-monitoring. One sector where ManageEngine OpManager has a great advantage is
the price. The starting price of ManageEngine OpManager is lower compared to that of
SolarWinds Network Performance Monitor. ManageEngine OpManager is particularly
beneficial to small organizations who are entering into the game of network monitoring.
Document Page
However, if organizations are looking for solutions that provides great dashboard design and
fast deployment, then the most recommended tool is SolarWinds Network Performance
Monitor.
Document Page
VI. BIBLIOGRAPHY
[1]J. WEN, H. WANG, S. YING, Y. NI and T. WANG, "Toward a Software Architectural
Design Approach for Trusted Software Based on Monitoring", Chinese Journal of
Computers, vol. 33, no. 12, pp. 2321-2334, 2011. Available:
10.3724/sp.j.1016.2010.02321.
[2]J. Cui, "Design and Implementation of Computer Network Monitoring Software", Applied
Mechanics and Materials, vol. 686, pp. 201-204, 2014. Available:
10.4028/www.scientific.net/amm.686.201.
[3]N. Kapucu and F. Demiroz, "Measuring Performance for Collaborative Public
Management Using Network Analysis Methods and Tools", Public Performance &
Management Review, vol. 34, no. 4, pp. 549-579, 2011. Available: 10.2753/pmr1530-
9576340406.
[4]c. ManageEngine, "Network Monitoring Software - ManageEngine OpManager
Monitoring", Manageengine.com, 2019. [Online]. Available:
https://www.manageengine.com/network-monitoring/. [Accessed: 23- Apr- 2019].
[5]N. Gilbert, "Pros & Cons of ManageEngine OpManager: Analysis of A Leading IT
Management Platform - Financesonline.com", Financesonline.com, 2019. [Online].
Available: https://financesonline.com/pros-cons-of-manageengine-opmanager-analysis-
of-a-leading-it-management-platform/. [Accessed: 23- Apr- 2019].
[6]"SolarWinds vs ManageEngine: Which is Better for Network Monitoring?", Comparitech,
2019. [Online]. Available: https://www.comparitech.com/net-admin/solarwinds-vs-
manageengine/. [Accessed: 23- Apr- 2019].
tabler-icon-diamond-filled.svg

Paraphrase This Document

Need a fresh take? Get an instant paraphrase of this document with our AI Paraphraser
Document Page
[7]J. Heranz, "Network Performance and Coordination", Public Performance &
Management Review, vol. 33, no. 3, pp. 311-341, 2010. Available: 10.2753/pmr1530-
9576330301.
[8]J. Herranz, "The Logic Model as a Tool for Developing a Network Performance
Measurement System", Public Performance & Management Review, vol. 34, no. 1, pp.
56-80, 2010. Available: 10.2753/pmr1530-9576340104.
[9]Kuen-Shiou Yang, "Network dynamics and innovative performance: The moderating
effects of network resources", African Journal of Business Management, vol. 6, no. 4,
2012. Available: 10.5897/ajbm11.2350.
[10]Y. Shi, J. Huang and B. Yu, "Robust Tracking Control of Networked Control Systems:
Application to a Networked DC Motor", IEEE Transactions on Industrial Electronics,
vol. 60, no. 12, pp. 5864-5874, 2013. Available: 10.1109/tie.2012.2233692.
[11]T. Palo and J. Tähtinen, "Networked business model development for emerging
technology-based services", Industrial Marketing Management, vol. 42, no. 5, pp. 773-
782, 2013. Available: 10.1016/j.indmarman.2013.05.015.
[12]Q. Wang, "Traffic Analysis & Modeling in Wireless Sensor Networks and Their
Applications on Network Optimization and Anomaly Detection", Network Protocols and
Algorithms, vol. 2, no. 1, 2010. Available: 10.5296/npa.v2i1.328.
chevron_up_icon
1 out of 11
circle_padding
hide_on_mobile
zoom_out_icon
[object Object]