Network Performance Management and Troubleshooting Project CSC73002
VerifiedAdded on 2022/11/15
|18
|1932
|191
Project
AI Summary
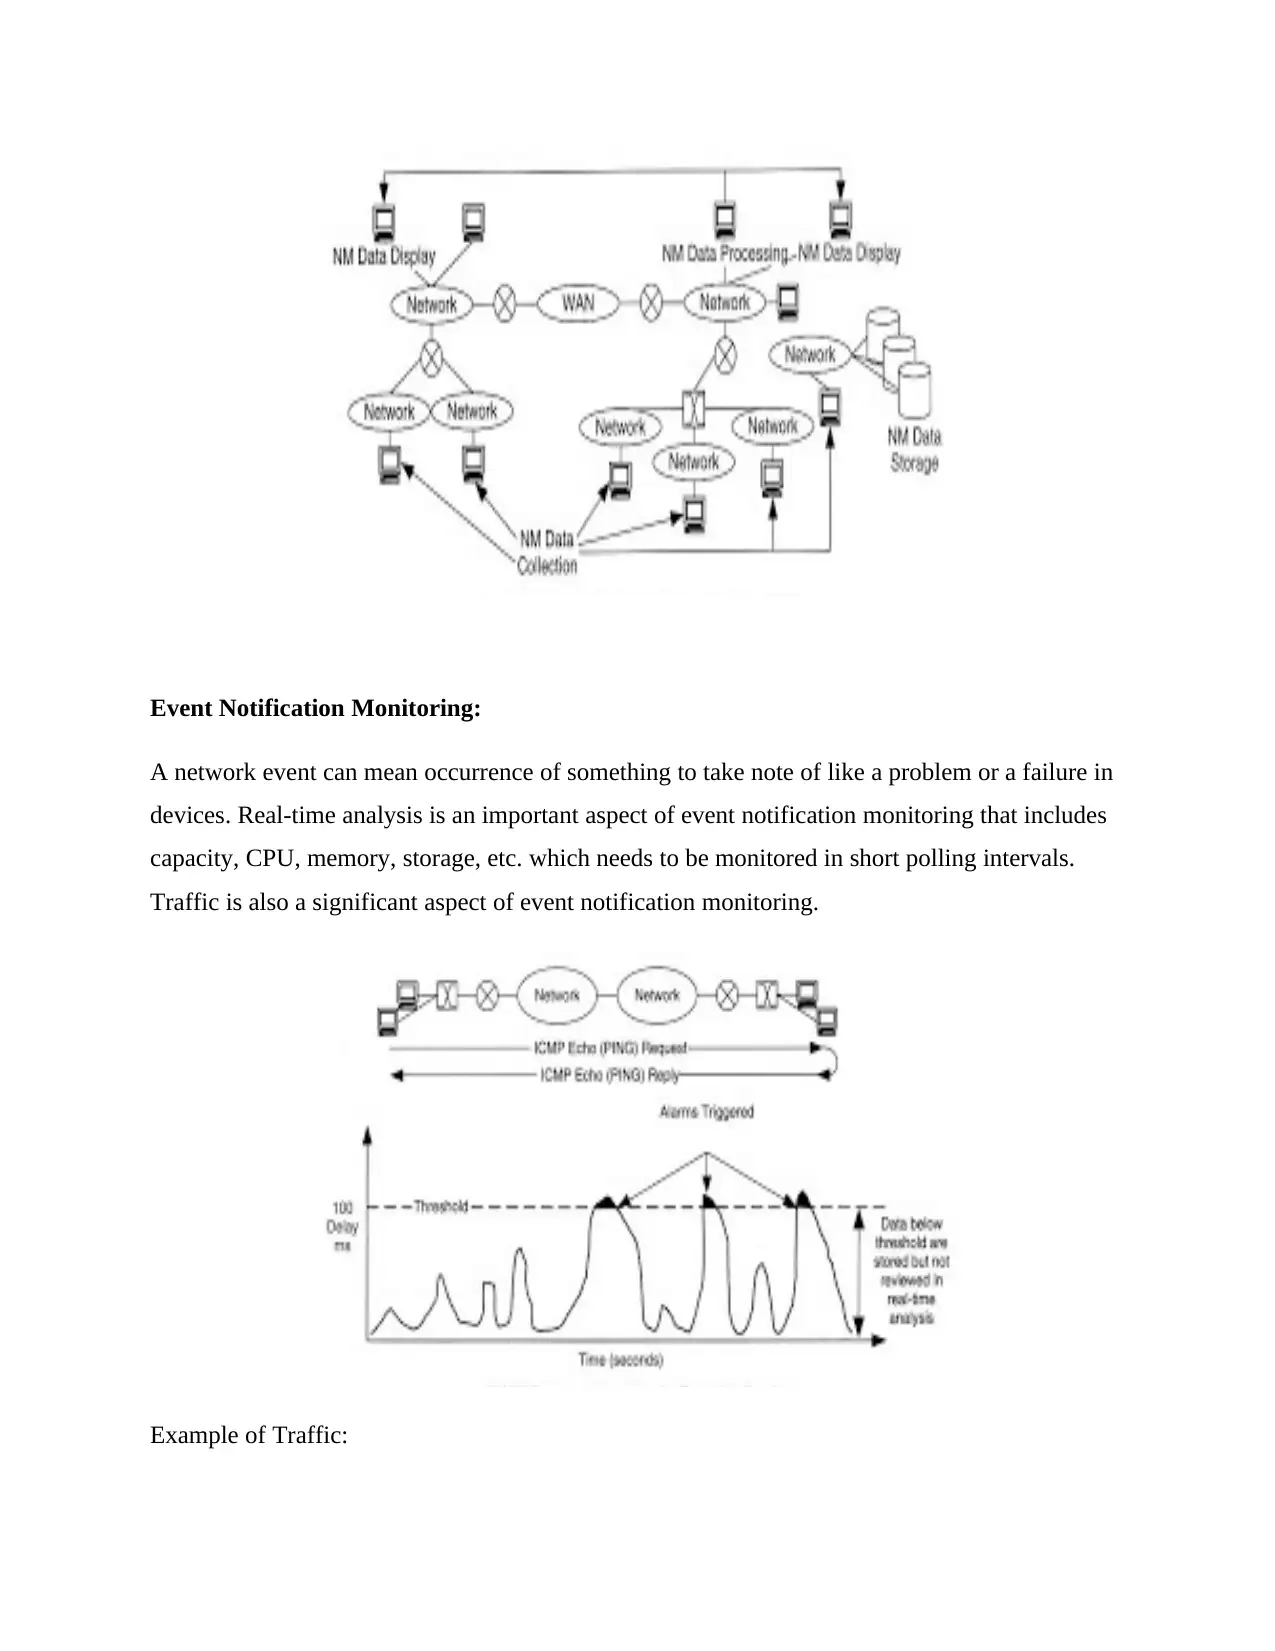
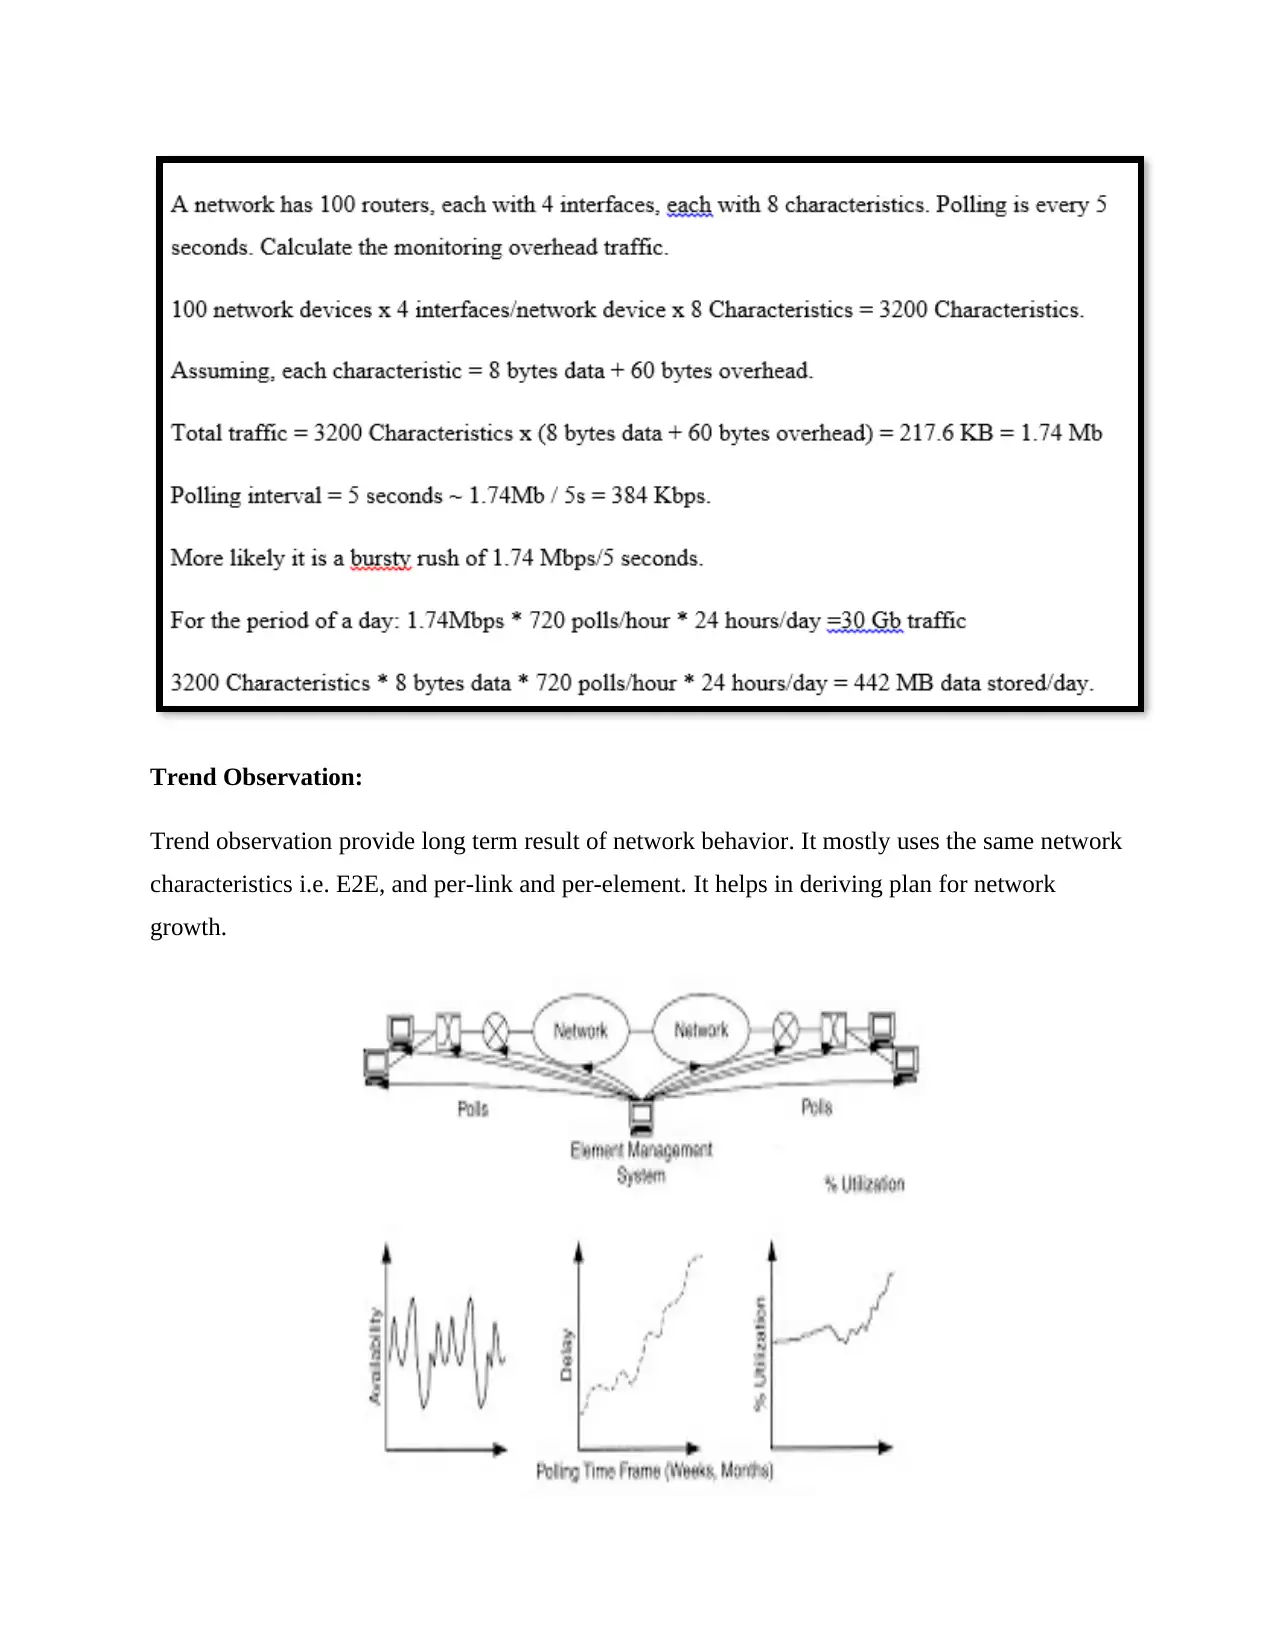
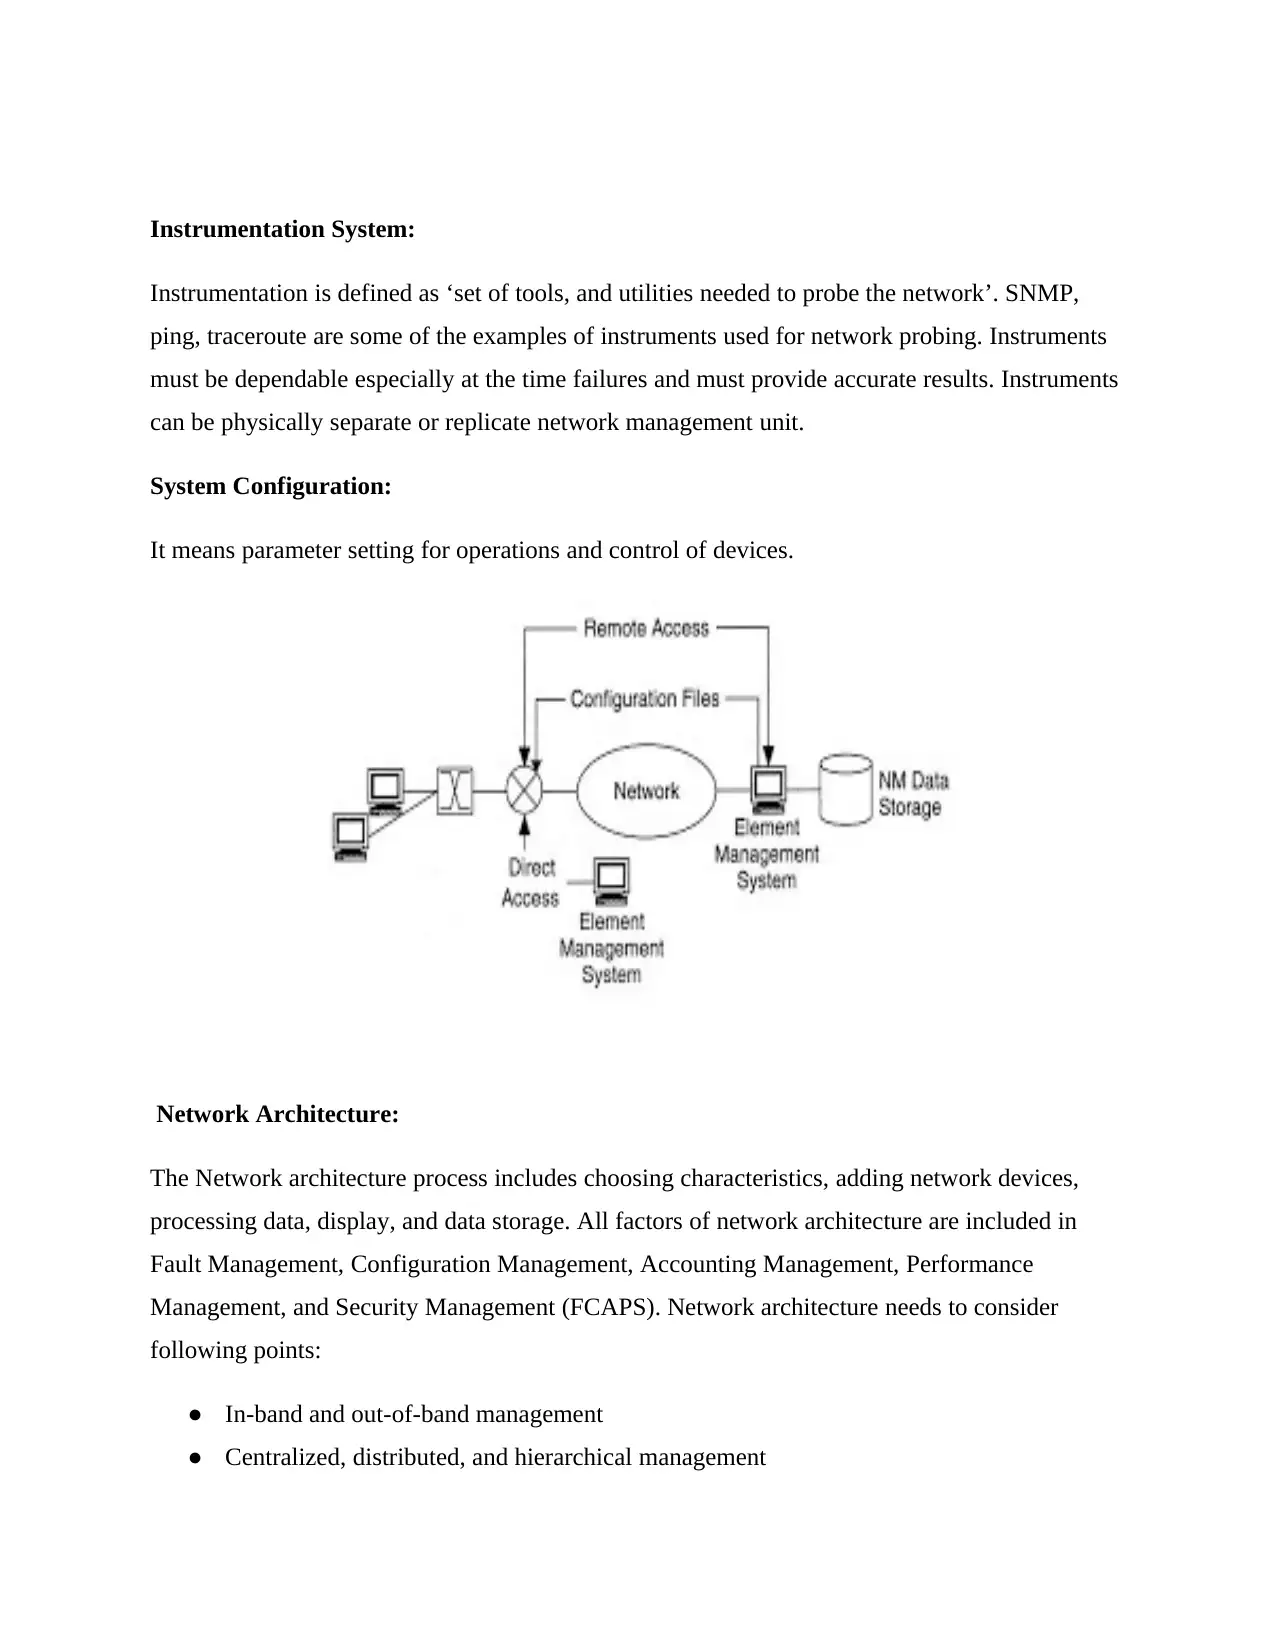
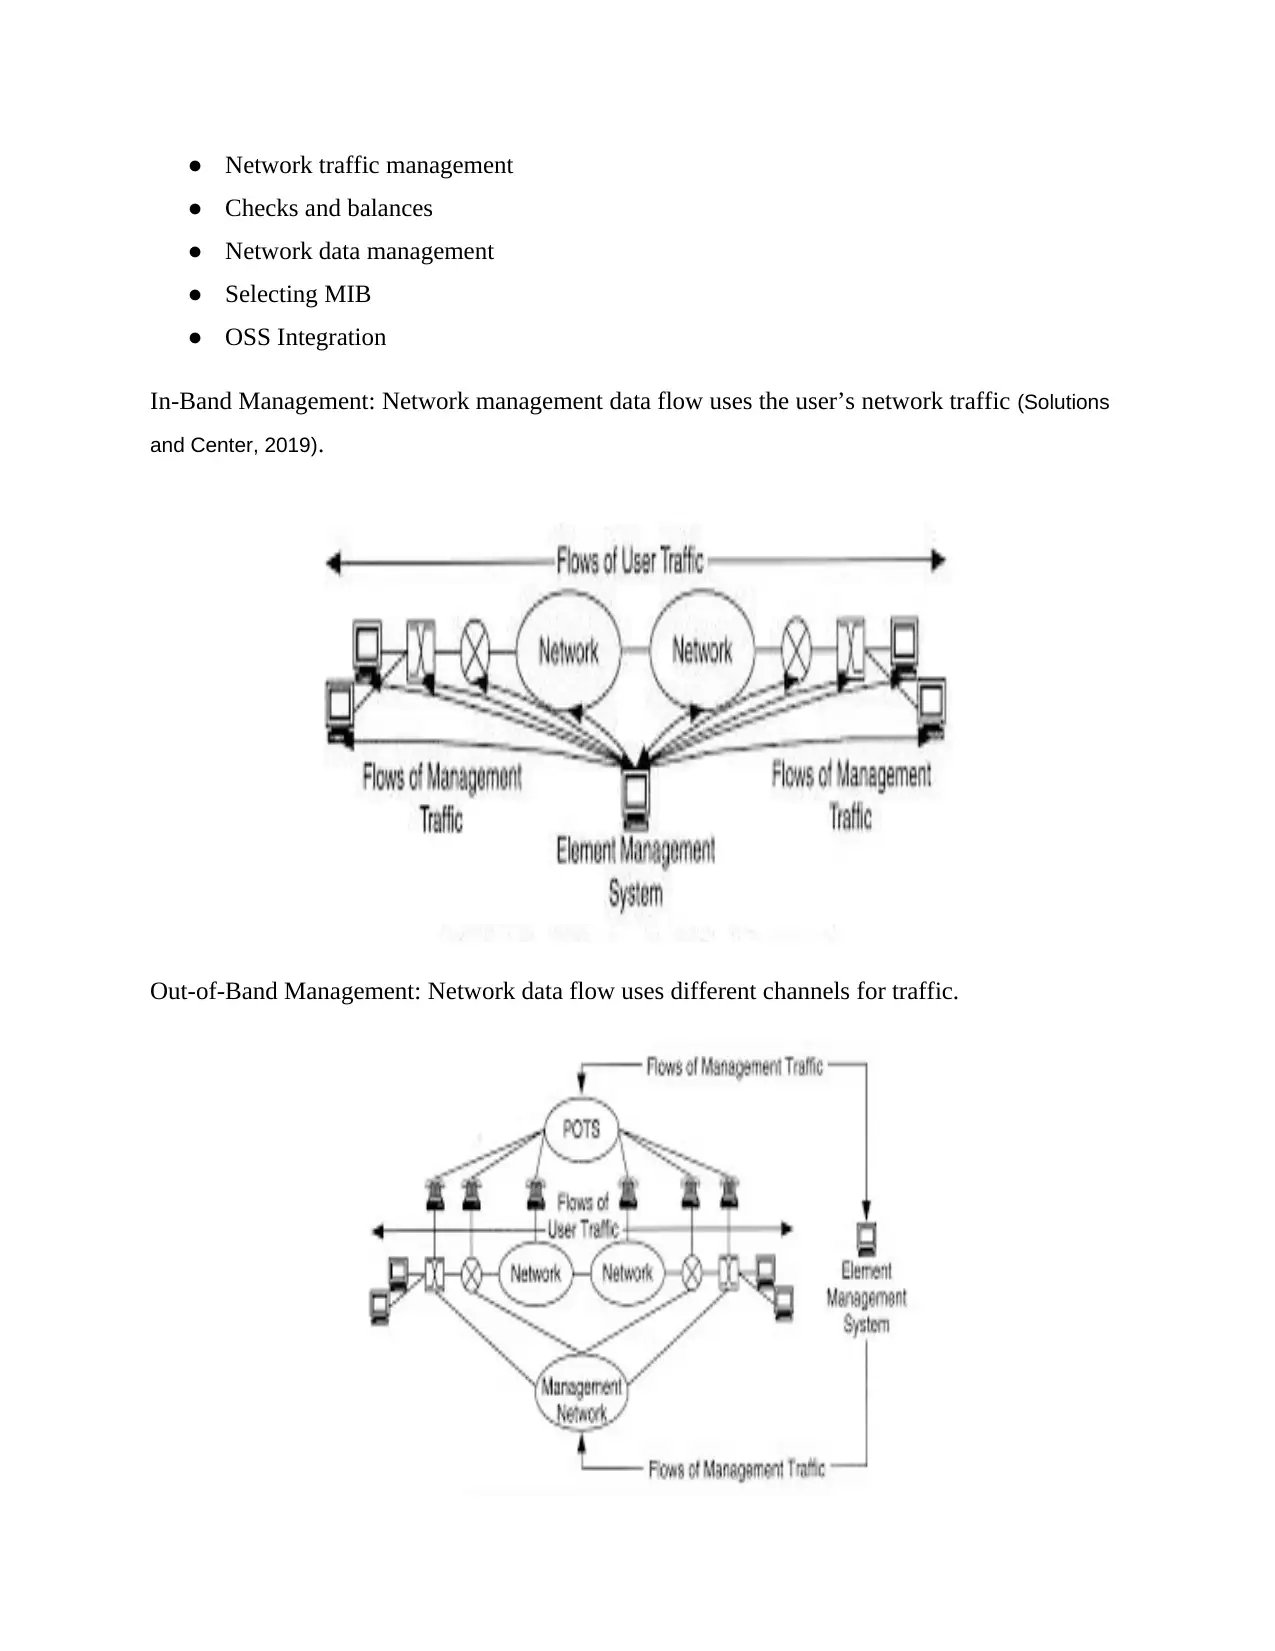
This assignment focuses on network management, encompassing architecture selection, Zabbix configuration, SNMPv2c setup, and performance baselining. The project requires the student to configure and run a Zabbix appliance, configure SNMP clients, and monitor network devices. The document also includes a section on troubleshooting a network shared folder issue, outlining the steps required to diagnose and resolve the problem. The assignment covers key performance indicators, resource monitoring, and troubleshooting techniques. The student has provided detailed steps for troubleshooting shared folder access, including checking permissions, firewall settings, and network configurations. The document also provides references to relevant sources used in the assignment.

2019
NETWORK MANAGEMENT
NETWORK MANAGEMENT
Secure Best Marks with AI Grader
Need help grading? Try our AI Grader for instant feedback on your assignments.

1. Network Management Architecture
Introduction:
Network management is a hierarchy of 5 layer which can be shown and explained as follows
(Whang, Jain and Chan, 2002):
Business Layer: Business layer contains Finance structure, resource management, policies and
so on.
Service Functions: This part of the hierarchy contains data management, SLAs, Application
delivery, bandwidth access and so on.
System Management: It includes the whole network system and the devices used for the
system.
Network Element Management: a unit of router, switch, hub and so on, are included in
network element management.

Functions:
Network management function is divided into 2 categories (Whang, Jain and Chan, 2002):
1. Network management information transport, and
2. The element management
Tasks:
Event Notification Observation that is connected with alarm triggers.
Monitoring trends to decide long term impacts and to recognize patterns.
Configuring Network Parameters in devices.
Recognizing faults in the network and troubleshooting.
Network Devices:

Hosts, Routers, Switches, Data Service Units (DSUs), Hubs, NICs, Cable segments, etc. are
some of the examples of network devices (Vacca, 2014) (Whang, Jain and Chan, 2002).
Network Characteristics:
1. E2E Characteristics: can be measured across multiple network devices, and
2. Per-link and per-element Characteristics: are particular to the type of the device that is
being used.
Systems:
The network management system is operated through Utilities like ping, tracert, etc. and
protocols like SNMP, CMIP, CMOT, etc. There are three categories of Network management
system namely,
1. Monitoring,
2. Instrumentation, and
3. Configuration
Monitoring System:
It includes collecting data from network Characteristics. Method used for data collection usually
include protocols. Data collected is usually raw in nature which can be extracted and calculated.
Data, alarms, and events need to be stored and displayed.
Secure Best Marks with AI Grader
Need help grading? Try our AI Grader for instant feedback on your assignments.

Event Notification Monitoring:
A network event can mean occurrence of something to take note of like a problem or a failure in
devices. Real-time analysis is an important aspect of event notification monitoring that includes
capacity, CPU, memory, storage, etc. which needs to be monitored in short polling intervals.
Traffic is also a significant aspect of event notification monitoring.
Example of Traffic:

Trend Observation:
Trend observation provide long term result of network behavior. It mostly uses the same network
characteristics i.e. E2E, and per-link and per-element. It helps in deriving plan for network
growth.
Trend observation provide long term result of network behavior. It mostly uses the same network
characteristics i.e. E2E, and per-link and per-element. It helps in deriving plan for network
growth.

Instrumentation System:
Instrumentation is defined as ‘set of tools, and utilities needed to probe the network’. SNMP,
ping, traceroute are some of the examples of instruments used for network probing. Instruments
must be dependable especially at the time failures and must provide accurate results. Instruments
can be physically separate or replicate network management unit.
System Configuration:
It means parameter setting for operations and control of devices.
Network Architecture:
The Network architecture process includes choosing characteristics, adding network devices,
processing data, display, and data storage. All factors of network architecture are included in
Fault Management, Configuration Management, Accounting Management, Performance
Management, and Security Management (FCAPS). Network architecture needs to consider
following points:
● In-band and out-of-band management
● Centralized, distributed, and hierarchical management
Paraphrase This Document
Need a fresh take? Get an instant paraphrase of this document with our AI Paraphraser

● Network traffic management
● Checks and balances
● Network data management
● Selecting MIB
● OSS Integration
In-Band Management: Network management data flow uses the user’s network traffic (Solutions
and Center, 2019).
Out-of-Band Management: Network data flow uses different channels for traffic.
● Checks and balances
● Network data management
● Selecting MIB
● OSS Integration
In-Band Management: Network management data flow uses the user’s network traffic (Solutions
and Center, 2019).
Out-of-Band Management: Network data flow uses different channels for traffic.

Centralized Management: A centralized network management system uses a single management
system.
Distributed Management: A distributed network management system uses separate and multiple
elements of the management system (Solutions and Center, 2019).
Hierarchical Network Management:
system.
Distributed Management: A distributed network management system uses separate and multiple
elements of the management system (Solutions and Center, 2019).
Hierarchical Network Management:

Network monitoring, display, data storage, and processing are bifurcated and stored in different
locations (Solutions and Center, 2019).
Network Traffic Management:
Network traffic management is divided into two parts:
1. For a LAN: One monitoring device for an IP subnet.
2. For a WAN: One monitoring device for each LAN or WAN interface.
Checks and Balances:
It means modes of duplicating measurements to verify data. It is an important method of data
collection even if it adds overhead. It is used to record errors, locate counter rollover, and
identify MIB changes.
Network Data Management:
Network data management includes frequent interval event notification and data of trend
analysis. Following are 4 rules of data management:
1. Local vs. Archive: Data that needed quick access should be stored locally, other data can
be archived.
Secure Best Marks with AI Grader
Need help grading? Try our AI Grader for instant feedback on your assignments.

2. Selective copying: Data selected at equal intervals to archive for data and storage
management.
3. Metadata: This includes data sources, types, pointers, etc. It helps in data references in
the future.
4. Data migration: To reduce network stress, data can be transferred from one location to
another at a less busy traffic hours.
MIB Selection:
This part decides which MIB is to be monitored and configured to fulfill the objective.

OSS Integration:
Operation Support System (OSS) also called as a northbound interface is a method to decide
management’s integration with the OSS.
2. Zabbix Installation
Zabbix (Zabbix.com, 2019) installation procedure is explained below.
Downloaded zabbix appliance from https://www.zabbix.com/download_appliance
Operation Support System (OSS) also called as a northbound interface is a method to decide
management’s integration with the OSS.
2. Zabbix Installation
Zabbix (Zabbix.com, 2019) installation procedure is explained below.
Downloaded zabbix appliance from https://www.zabbix.com/download_appliance

The download status in browser is shown above. Got tar.gz file.
Unzipped the tar.gz file and got OVF file.
Already installed Oracle virtual box in my system. Created zabbix vm by importing the OVF
file.
Unzipped the tar.gz file and got OVF file.
Already installed Oracle virtual box in my system. Created zabbix vm by importing the OVF
file.
Paraphrase This Document
Need a fresh take? Get an instant paraphrase of this document with our AI Paraphraser

Got zabbix login id.
Logged into the zabbix by giving user name : appliance and password : zabbix

sudo service zabbix-server status gave the following results showing that the zabbix is running
fine.
fine.

Configured zabbix by referring zabbix documentation (Zabbix.com, 2019)
https://www.zabbix.com/documentation/4.2/manual/config
Configured SNMP clients and started monitoring the devices with the help of zabbix
3. Performance Baselining
Health
This will help us in ensuring whether or not the specific controlling parameters related to the
device are in limit. If by any chance, some or any of the parameters get deviated from the already
designed range, then it will be a clear indicator of the fact that the specific device is not in a
healthy state. (Vacca, 2014)
Performance:
This will help to know about the performance of the device under the basic conditions.
Availability
The first step in this is to check whether or not the target device is available with us. This will
enable us to test whether or not the target device is reachable or not. Utilities like PING will be
run with the help of the protocols like ICMB. If the PING response (as shown in the figure is
received by us, then it will be a direct indication of the fact that the target device which we are in
search of is available. Also, it will indicate that the path to the target device is healthy as well as
connected properly.
Secure Best Marks with AI Grader
Need help grading? Try our AI Grader for instant feedback on your assignments.

Before studying the Monitoring of Resources, it is very important to identify the different
valuable resources such as memory, CPU, storage as well as bandwidth. Resource Monitoring is
nothing but the data which is relevant to the use of one or more program resources only. Since
assets have a great impact on the performance of the system, resource monitoring is of crucial
importance in various system administration systems. For the purpose of locating resources
across the cloud as well as to monitor VMs to the project, Resource Monitoring has now become
a necessity. For exploring resources across the cloud even the Hypervisor API can be used.
Since, out method will be limited to a specific hypervisor, so in order to perform the monitoring
of the pool of cloud resources, a resource tracking tool will be utilized by us.
Key performance indicators in network monitoring are explained above
4. Network Shared Folder Troubleshooting
Firstly, we have to access the shared folder manually by following the steps (Vacca, 2014)
as Start-->Run--> \\Server_name\Folder name.
In case the folder is accessible manually, then the service account (which is responsible
for doing the mapping task when the end user is not present) will not be having much of
the permissions (Halsey and Bettany, 2015).
To identify the problem, the Windows Repair and Diagnostic tool can be utilized.
The file sharing port may not be allowed by the Windows firewall. This further needs to
be verified by the use of command TELNET TARGETIP POSTNUMBER.
Next, in the source sever, the sharing protocol needs to be enabled.
Next, the network sharing permissions need to be given.
Everyone should be allowed to see the folder as per the sharing permissions.
The share requestor must be given the access to the file and folder by the security
permissions.
Then, the computer needs to be re- started.
This step will ensure that the majority of the problems from the source side as well as the
network side have been resolved well.

Then, the router needs to be re- started.
Doing this step will ensure that all of the present network conditions have been brought
to the initial or earlier state.
5. References
Halsey, M. and Bettany, A. (2015). Windows file system troubleshooting. Place of
publication not identified: Apress.
Solutions, S. and Center, C. (2019). Small Business Networking Resources. [online]
Cisco. Available at: https://www.cisco.com/c/en/us/solutions/small-business/resource-
center/networking.html [Accessed 13 Sep. 2019].
Support.pagerduty.com. (2019). Zabbix Troubleshooting Guide. [online] Available at:
https://support.pagerduty.com/docs/zabbix-troubleshooting-guide [Accessed 13 Sep.
2019].
Vacca, J. (2014). Network and system security. Amsterdam: Syngress.
Whang, K., Jain, R. and Chan, P. (2002). Network element management architecture
for the 7 R/E™ Trunk Access Gateway. Bell Labs Technical Journal, 4(4), pp.204-
224.
Zabbix.com. (2019). Zabbix:: The Enterprise-Class Open Source Network
Monitoring Solution. [online] Available at: https://www.zabbix.com/ [Accessed 13
Sep. 2019].
Zabbix.com. (2019). 6. Zabbix appliance [Zabbix Documentation 4.2]. [online]
Available at: https://www.zabbix.com/documentation/4.2/manual/appliance [Accessed
13 Sep. 2019].
Zabbix.com. (2019). 7. Configuration [Zabbix Documentation 4.2]. [online] Available
at: https://www.zabbix.com/documentation/4.2/manual/config [Accessed 13 Sep.
2019].
1 out of 18
Related Documents

Your All-in-One AI-Powered Toolkit for Academic Success.
+13062052269
info@desklib.com
Available 24*7 on WhatsApp / Email
Unlock your academic potential
© 2024 | Zucol Services PVT LTD | All rights reserved.