Network Performance Analysis: Wireshark and Website Analysis
VerifiedAdded on 2021/02/19
|15
|1319
|354
Practical Assignment
AI Summary
This assignment provides a comprehensive analysis of network performance using the Wireshark tool. It begins with an introduction to network performance and its significance, followed by a detailed examination of three websites and an audio streaming website. The analysis of the websites involves capturing and interpreting Wireshark data, including load distribution, throughput, time sequence, flow, and window scaling graphs. The audio streaming analysis focuses on TCP packet monitoring and the interpretation of throughput and time sequence graphs. The assignment utilizes Wireshark to measure and analyze various network parameters, offering insights into the performance of the distributed systems behind the given web systems. The conclusion summarizes the findings, emphasizing the effectiveness of Wireshark in maintaining and improving website service quality. The document also references relevant books and journals that support the analysis.

NETWORK
PERFORMANCE
ANALYSIS
PERFORMANCE
ANALYSIS
Paraphrase This Document
Need a fresh take? Get an instant paraphrase of this document with our AI Paraphraser
TABLE OF CONTENTS
INTRODUCTION...........................................................................................................................1
TASK 1............................................................................................................................................1
Three websites performance analysis..........................................................................................1
TASK 2..........................................................................................................................................11
Audio streaming website that delivers over TCP through listening to internet live radio and
monitoring the transmitted packets............................................................................................11
CONCLUSION..............................................................................................................................12
REFERENCES..............................................................................................................................13
INTRODUCTION
Network performance can be defined as review or analysis of network statistics in order
to define service quality provided by the computer network [1]. It also helps in defining as well
as measuring performance level of a network. It also helps in measuring, improving and guiding
network services. Network performance can be used for discussing performance issues,
deployment issues associated with the network [2]. This assignment will lay emphasis on
capturing of Wireshark data in order to discuss performance of distributed system behind given
web system with the help of flow graph, time sequence graph, throughput graph, load
distribution and windows scaling graph. Analysis of this data will be done with the help of
Wireshark tool. Other than this analysis of output of audio streaming website will also be done in
order to measure its performance.
TASK 1
Three websites performance analysis
Wireshark: Wireshark is an open source, free packet analyser which is used for analysis, trouble
shooting, development of communication protocols and for various other things [2]. It has a
graphical front end with integrated filtering and sorting options. It runs on different platforms
such as windows, Linux, MacOs and various others.
Website 1: http://www.onlinenewspapers.com/australi.htm
It has been determined that ip address of http://www.onlinenewspapers.com/australi.htm
website is 52.23.105.176. Wireshark tool has helped in analysing and capturing packet
transmission.
Load Distribution
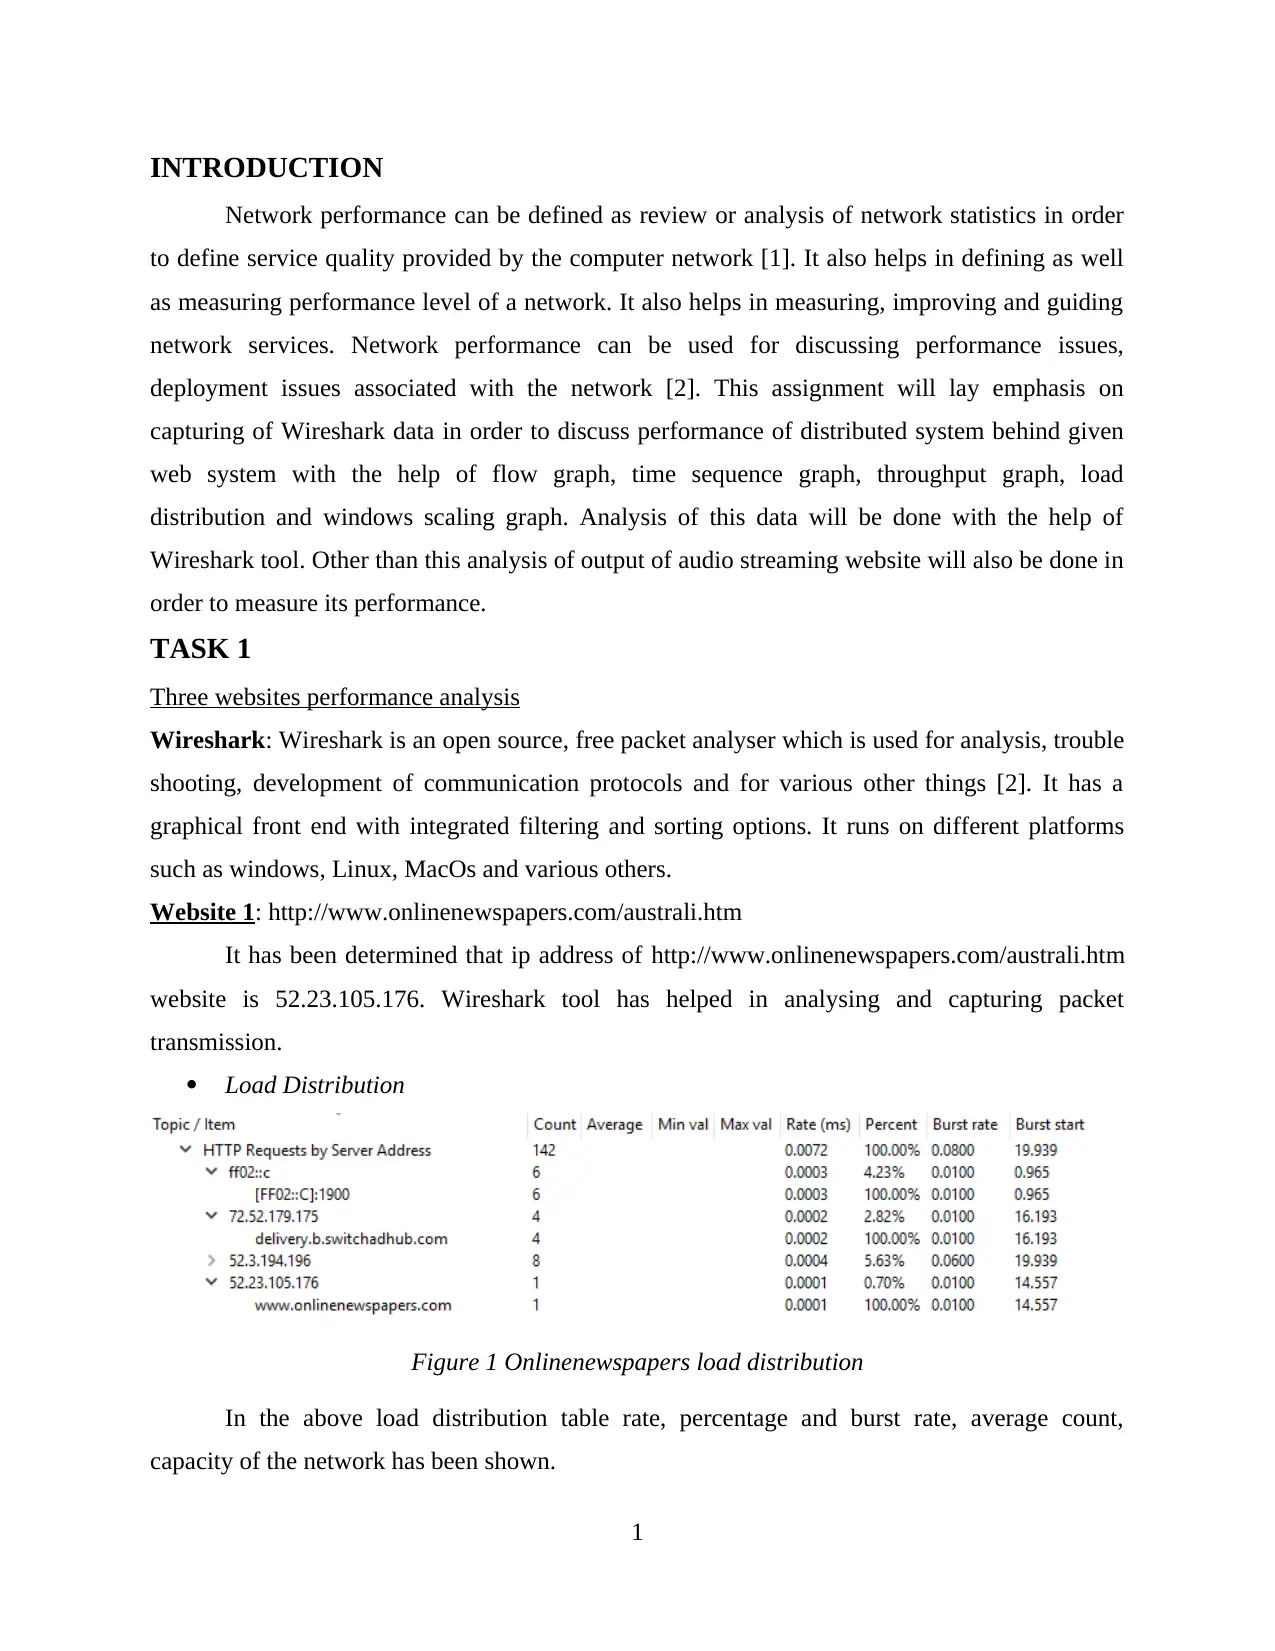
Figure 1 Onlinenewspapers load distribution
In the above load distribution table rate, percentage and burst rate, average count,
capacity of the network has been shown.
1
⊘ This is a preview!⊘
Do you want full access?
Subscribe today to unlock all pages.

Trusted by 1+ million students worldwide
Throughput graph
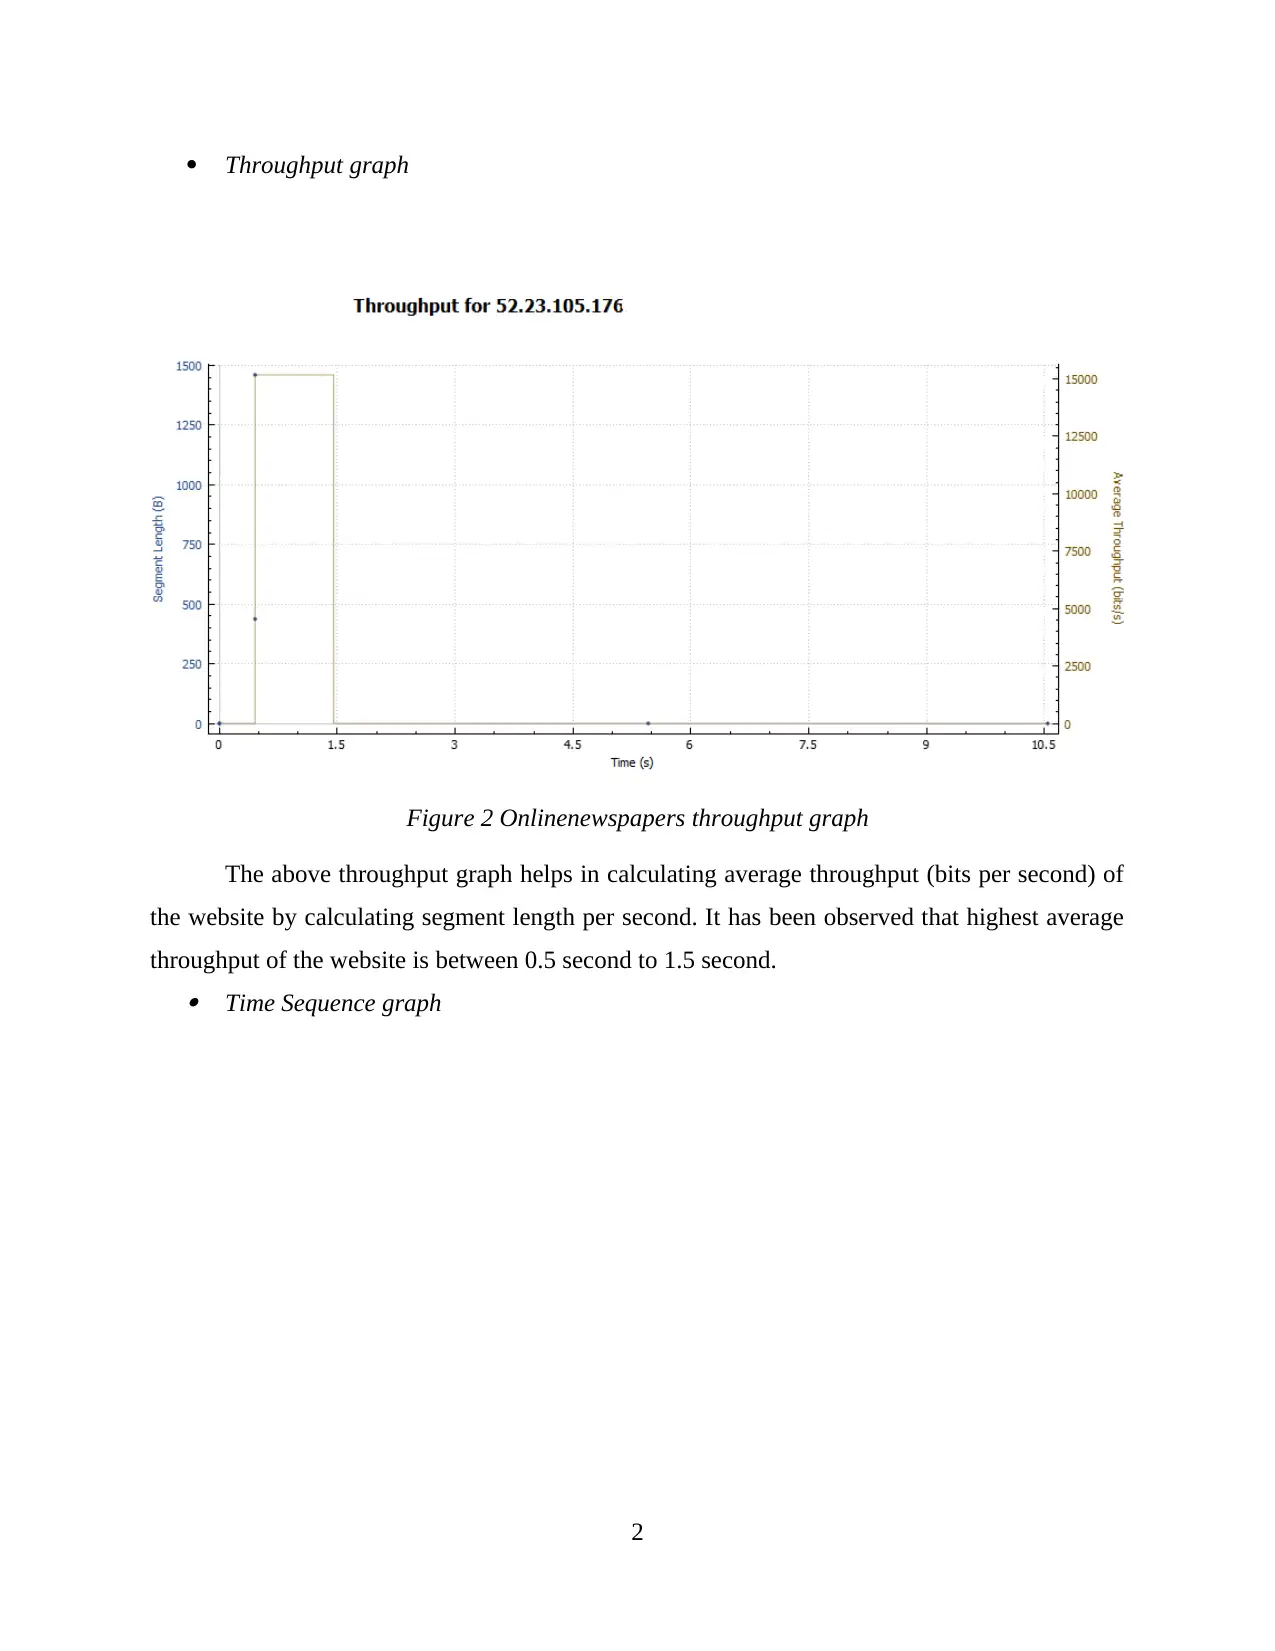
Figure 2 Onlinenewspapers throughput graph
The above throughput graph helps in calculating average throughput (bits per second) of
the website by calculating segment length per second. It has been observed that highest average
throughput of the website is between 0.5 second to 1.5 second. Time Sequence graph
2
Paraphrase This Document
Need a fresh take? Get an instant paraphrase of this document with our AI Paraphraser
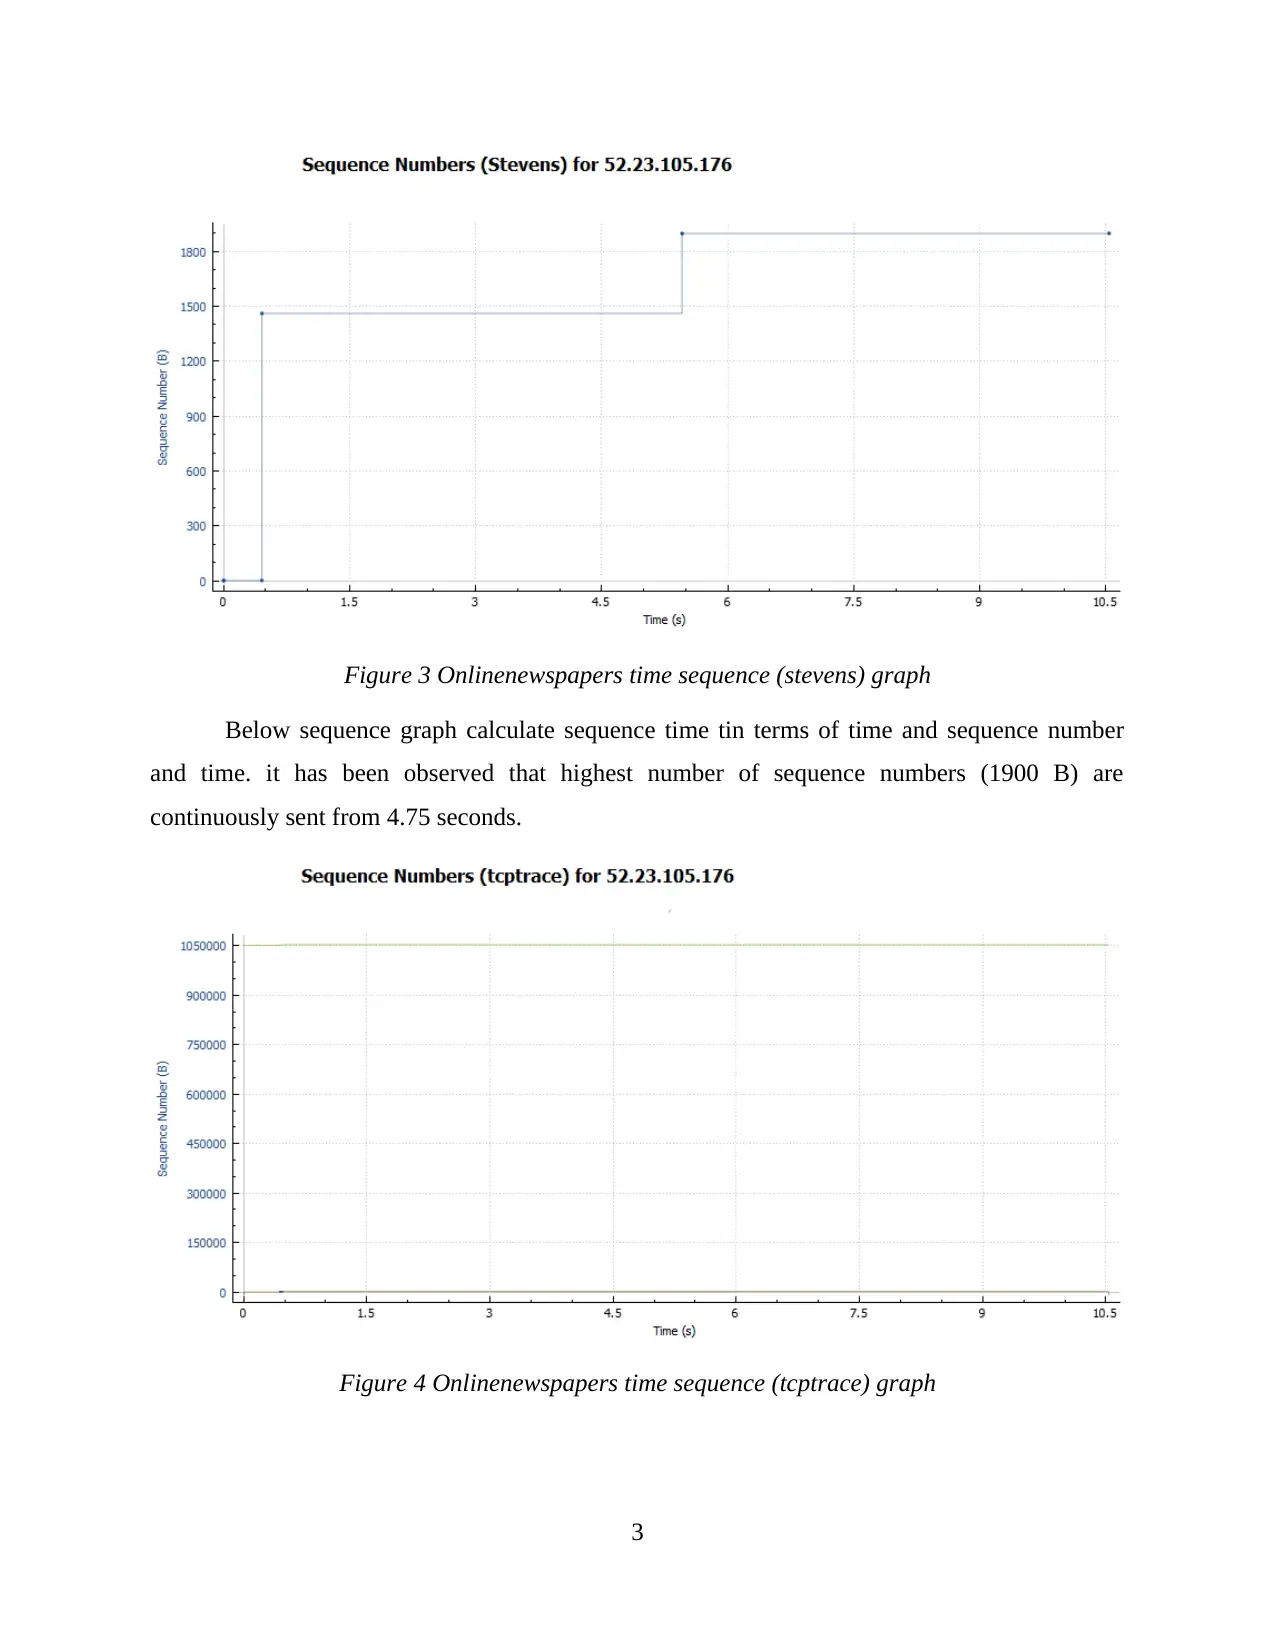
Figure 3 Onlinenewspapers time sequence (stevens) graph
Below sequence graph calculate sequence time tin terms of time and sequence number
and time. it has been observed that highest number of sequence numbers (1900 B) are
continuously sent from 4.75 seconds.
Figure 4 Onlinenewspapers time sequence (tcptrace) graph
3
Below sequence graph calculate sequence time tin terms of time and sequence number
and time. it has been observed that highest number of sequence numbers (1900 B) are
continuously sent from 4.75 seconds.
Figure 4 Onlinenewspapers time sequence (tcptrace) graph
3
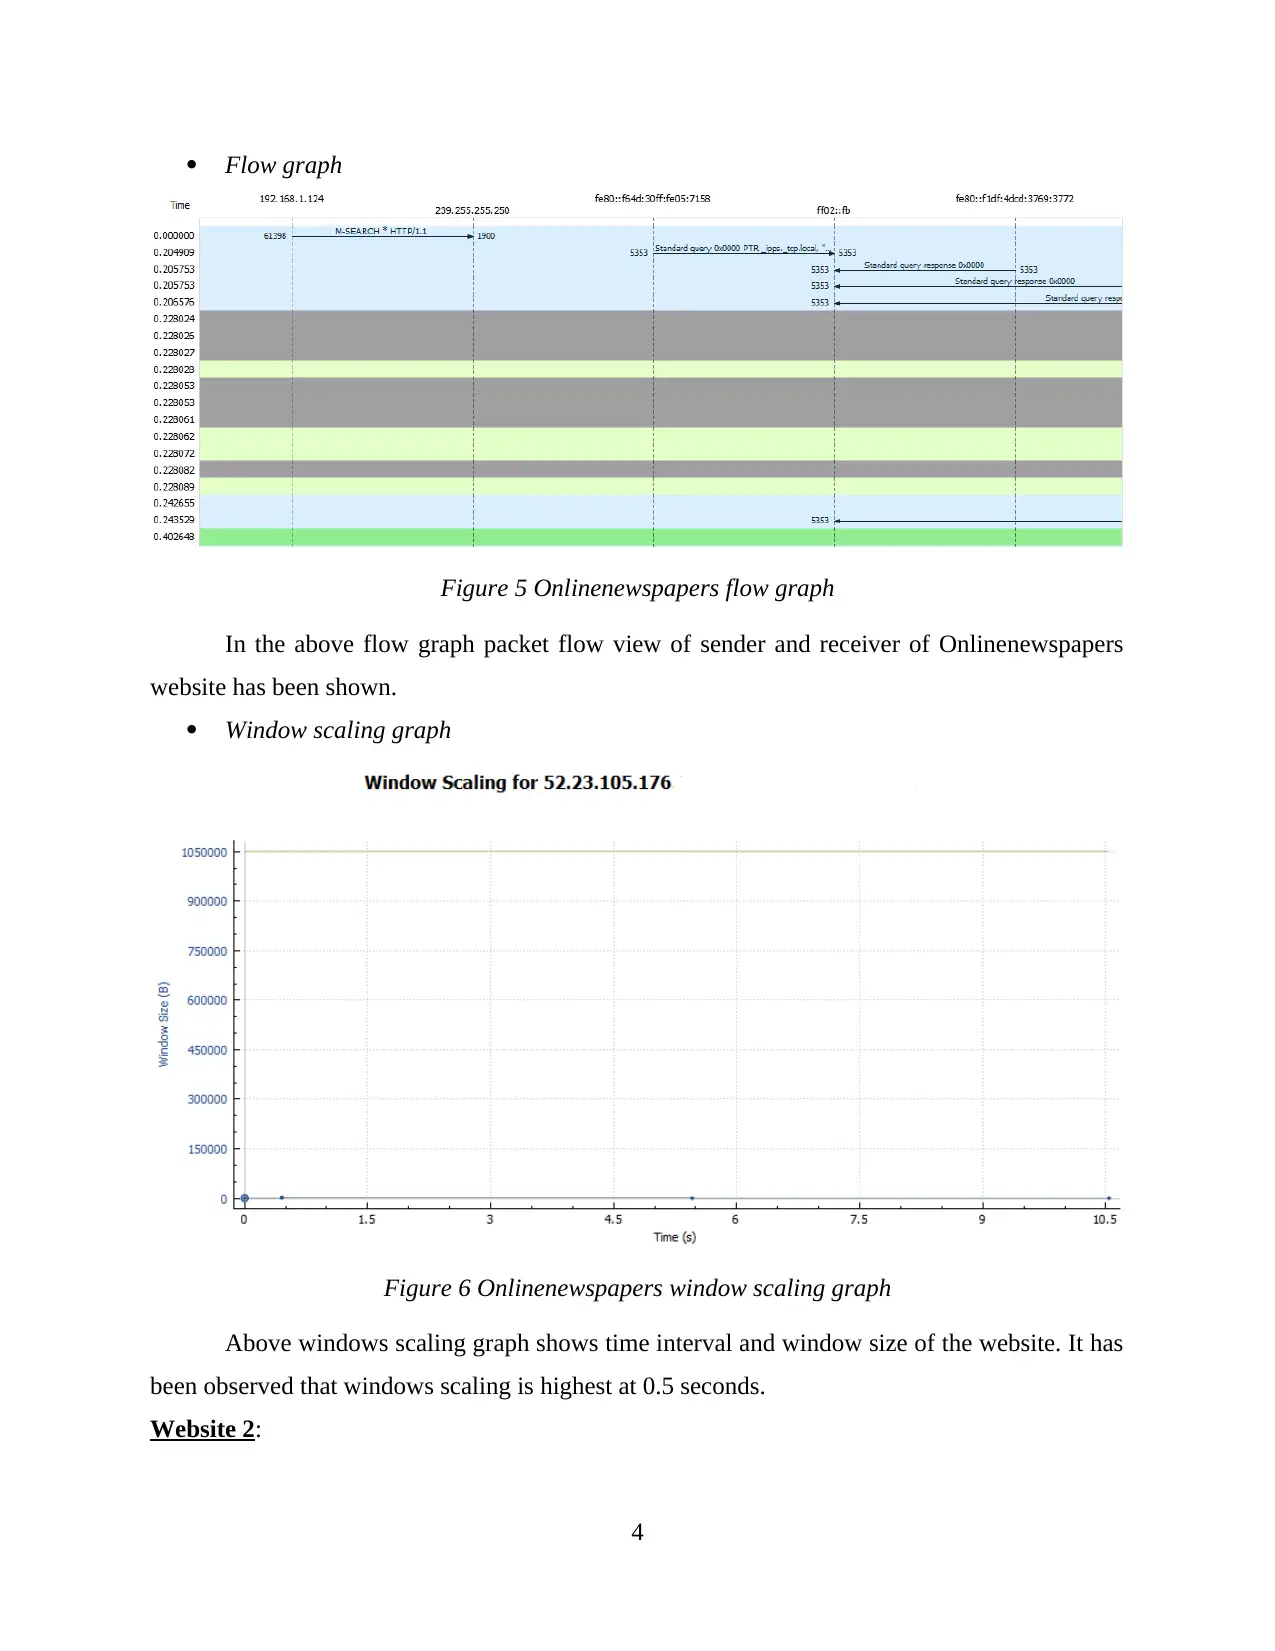
Flow graph
Figure 5 Onlinenewspapers flow graph
In the above flow graph packet flow view of sender and receiver of Onlinenewspapers
website has been shown.
Window scaling graph
Figure 6 Onlinenewspapers window scaling graph
Above windows scaling graph shows time interval and window size of the website. It has
been observed that windows scaling is highest at 0.5 seconds.
Website 2:
4
⊘ This is a preview!⊘
Do you want full access?
Subscribe today to unlock all pages.

Trusted by 1+ million students worldwide
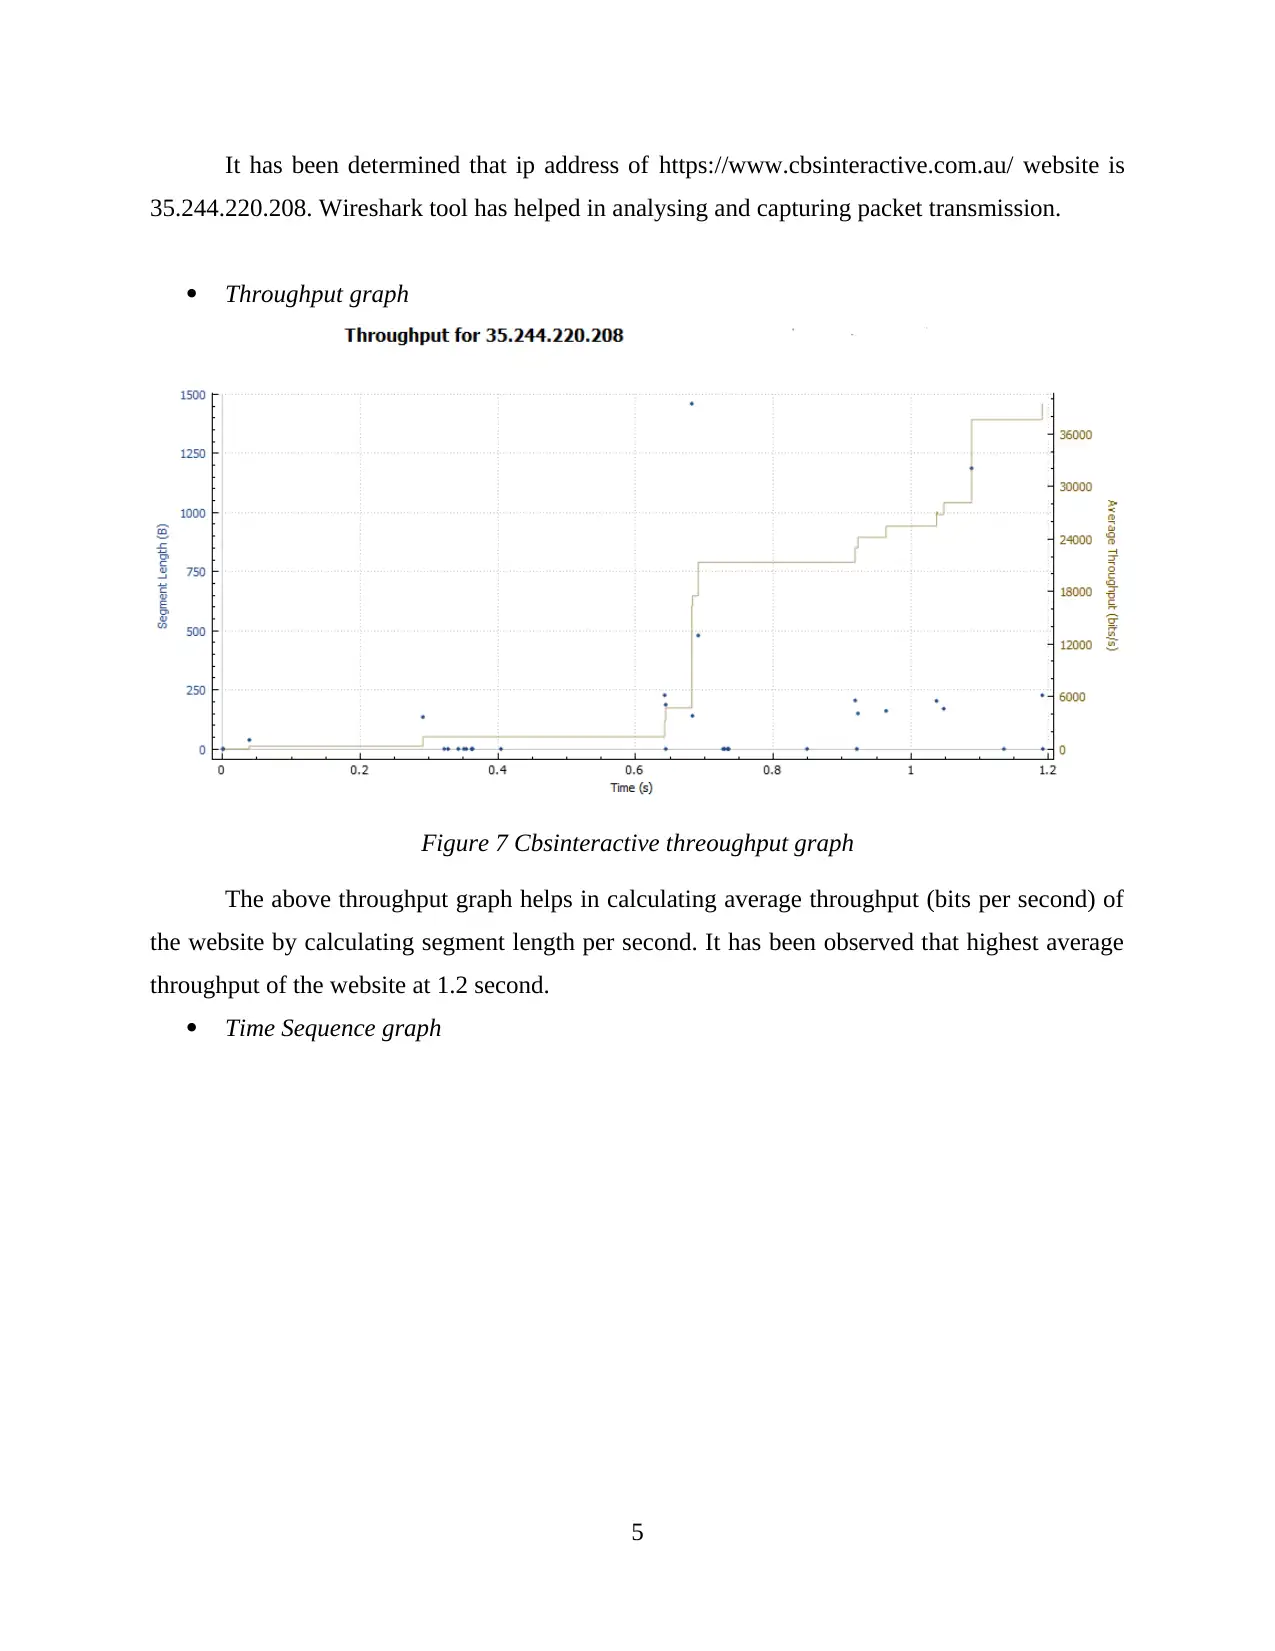
It has been determined that ip address of https://www.cbsinteractive.com.au/ website is
35.244.220.208. Wireshark tool has helped in analysing and capturing packet transmission.
Throughput graph
Figure 7 Cbsinteractive threoughput graph
The above throughput graph helps in calculating average throughput (bits per second) of
the website by calculating segment length per second. It has been observed that highest average
throughput of the website at 1.2 second.
Time Sequence graph
5
Paraphrase This Document
Need a fresh take? Get an instant paraphrase of this document with our AI Paraphraser
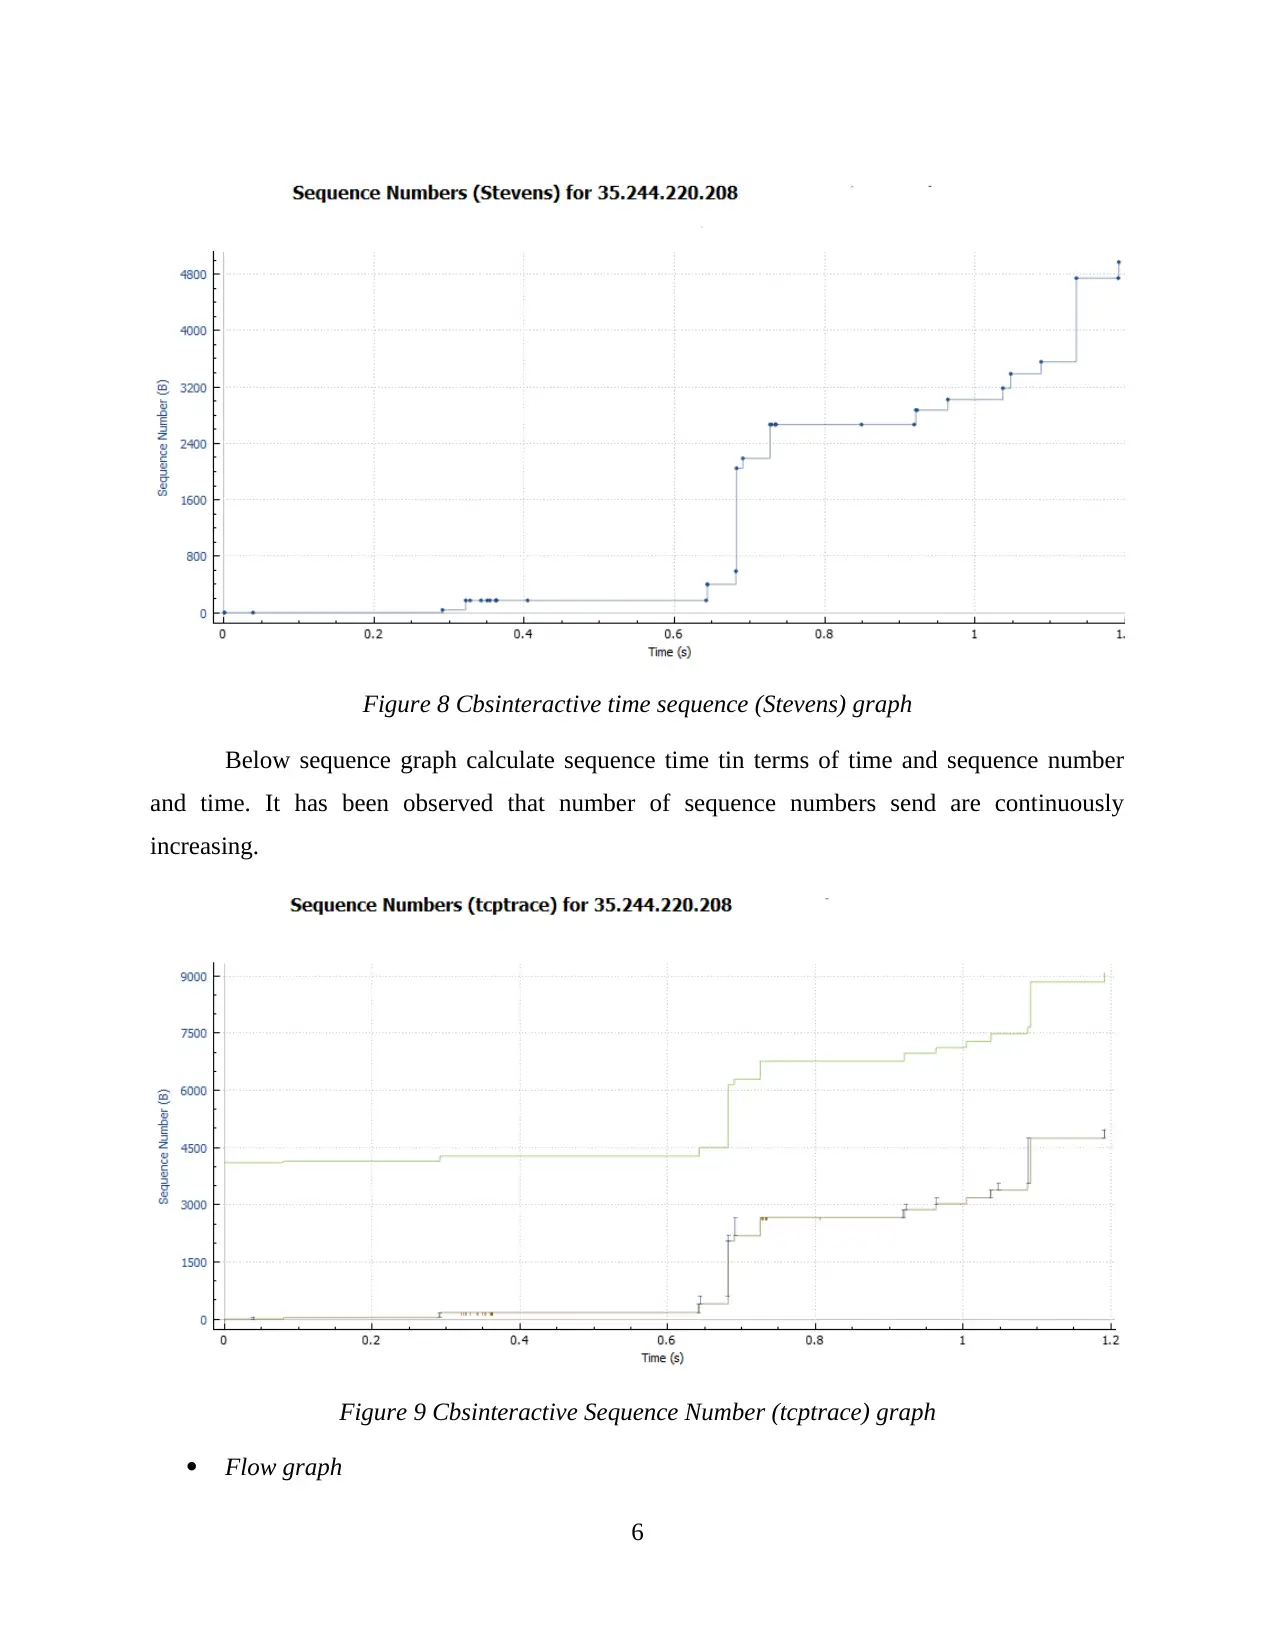
Figure 8 Cbsinteractive time sequence (Stevens) graph
Below sequence graph calculate sequence time tin terms of time and sequence number
and time. It has been observed that number of sequence numbers send are continuously
increasing.
Figure 9 Cbsinteractive Sequence Number (tcptrace) graph
Flow graph
6
Below sequence graph calculate sequence time tin terms of time and sequence number
and time. It has been observed that number of sequence numbers send are continuously
increasing.
Figure 9 Cbsinteractive Sequence Number (tcptrace) graph
Flow graph
6
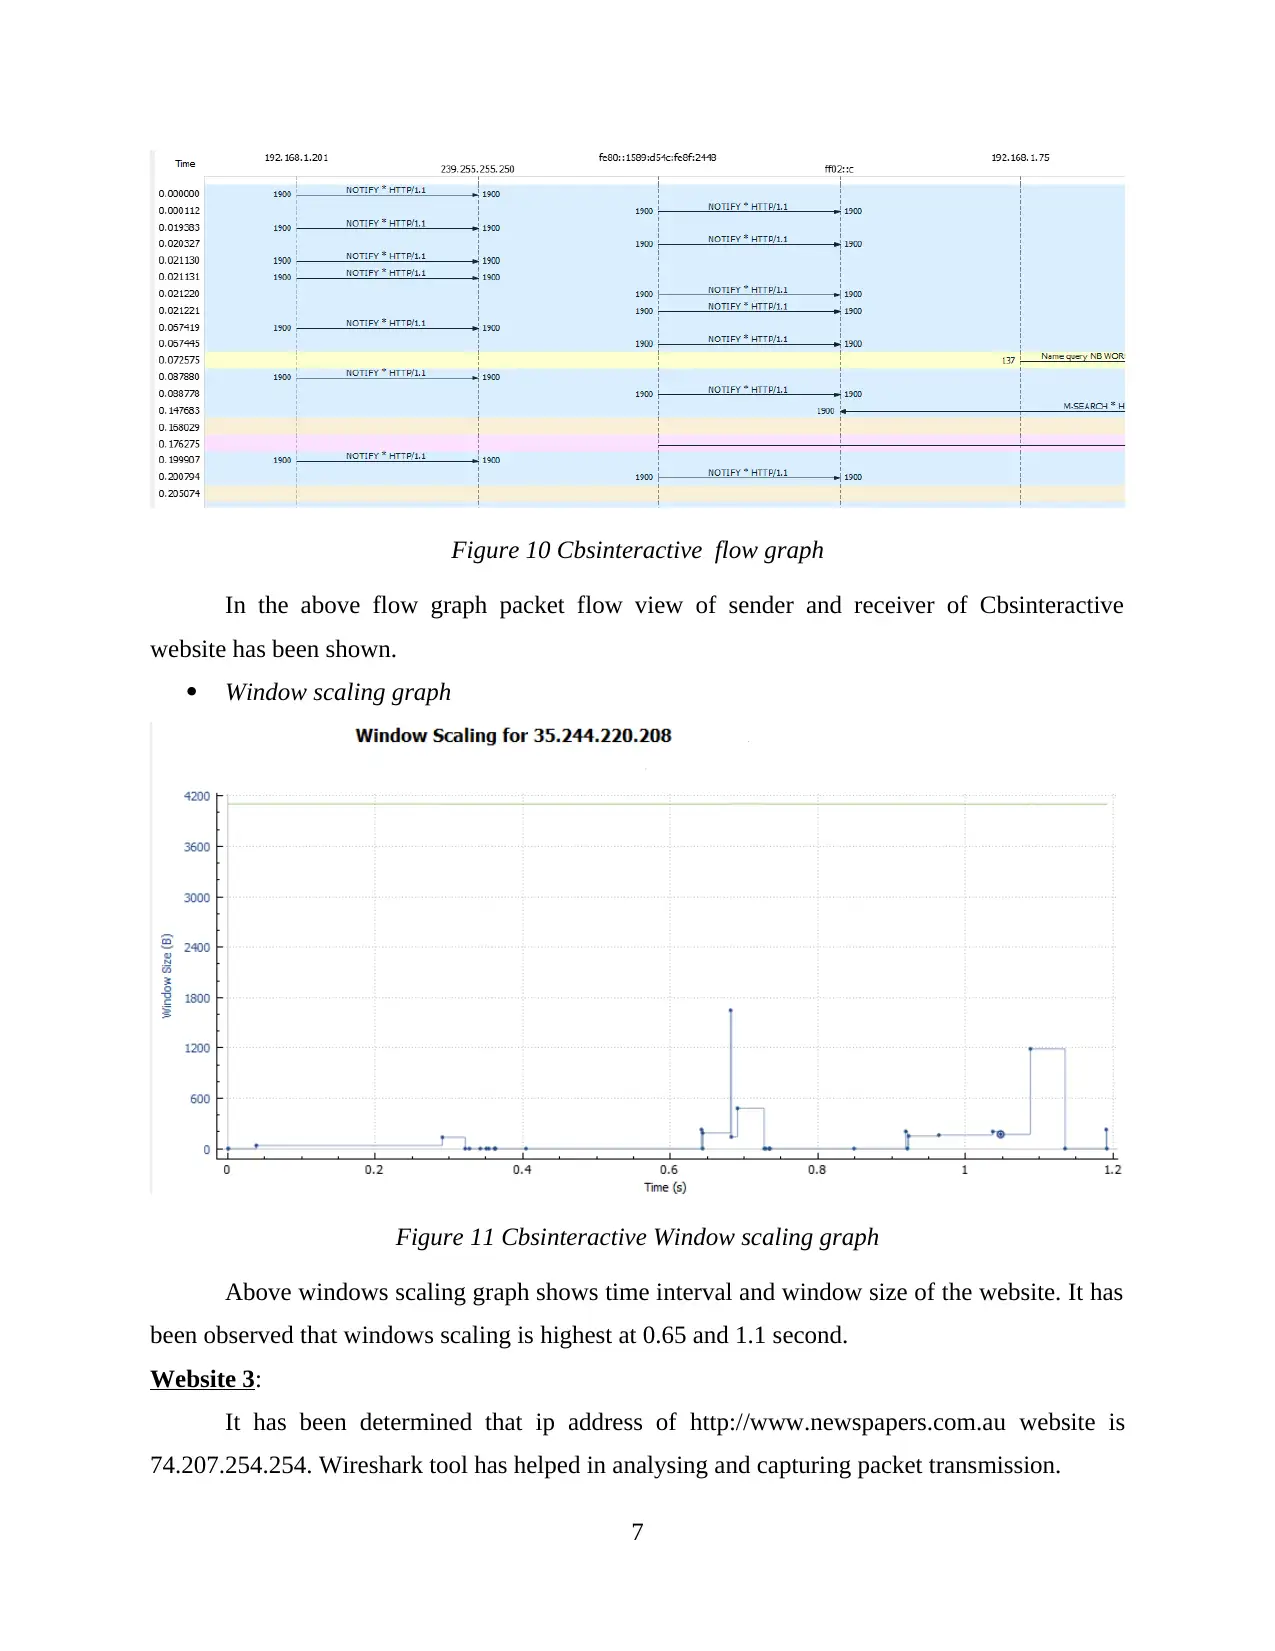
Figure 10 Cbsinteractive flow graph
In the above flow graph packet flow view of sender and receiver of Cbsinteractive
website has been shown.
Window scaling graph
Figure 11 Cbsinteractive Window scaling graph
Above windows scaling graph shows time interval and window size of the website. It has
been observed that windows scaling is highest at 0.65 and 1.1 second.
Website 3:
It has been determined that ip address of http://www.newspapers.com.au website is
74.207.254.254. Wireshark tool has helped in analysing and capturing packet transmission.
7
⊘ This is a preview!⊘
Do you want full access?
Subscribe today to unlock all pages.

Trusted by 1+ million students worldwide
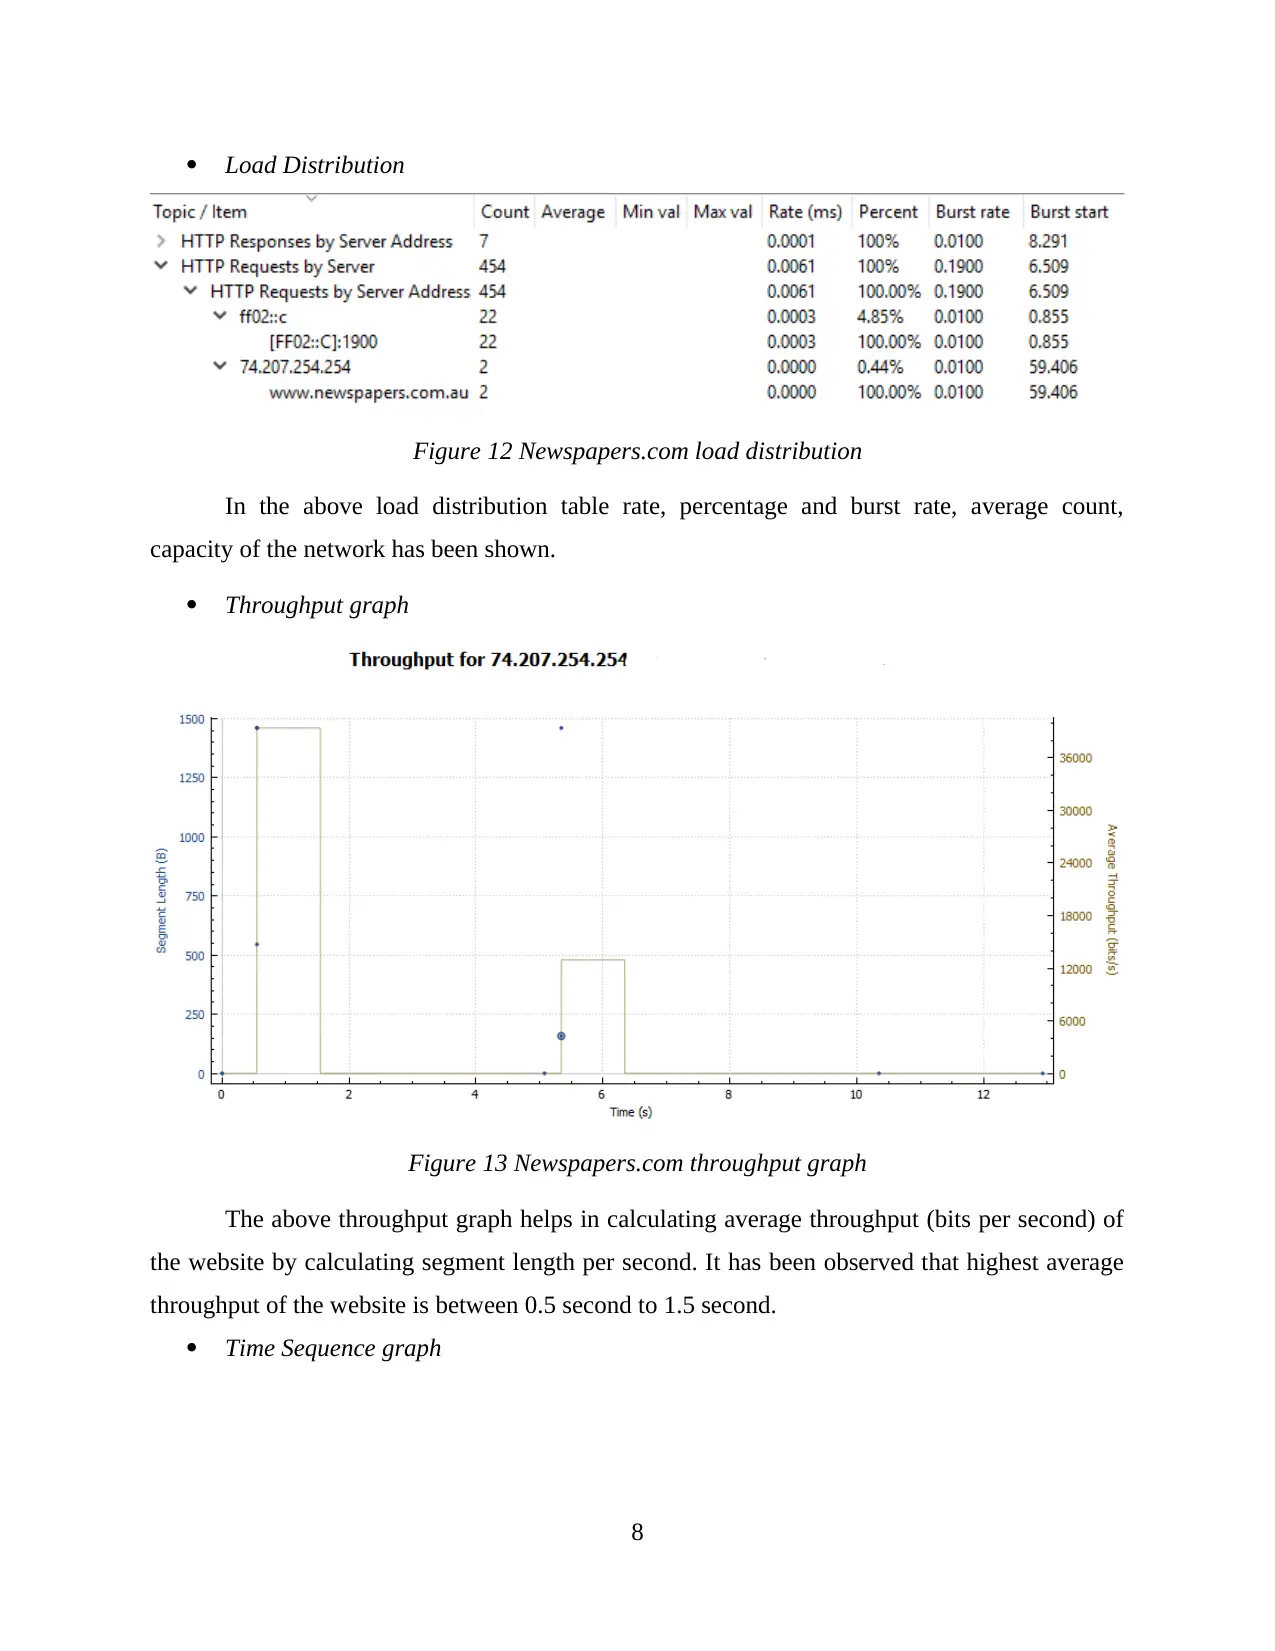
Load Distribution
Figure 12 Newspapers.com load distribution
In the above load distribution table rate, percentage and burst rate, average count,
capacity of the network has been shown.
Throughput graph
Figure 13 Newspapers.com throughput graph
The above throughput graph helps in calculating average throughput (bits per second) of
the website by calculating segment length per second. It has been observed that highest average
throughput of the website is between 0.5 second to 1.5 second.
Time Sequence graph
8
Paraphrase This Document
Need a fresh take? Get an instant paraphrase of this document with our AI Paraphraser
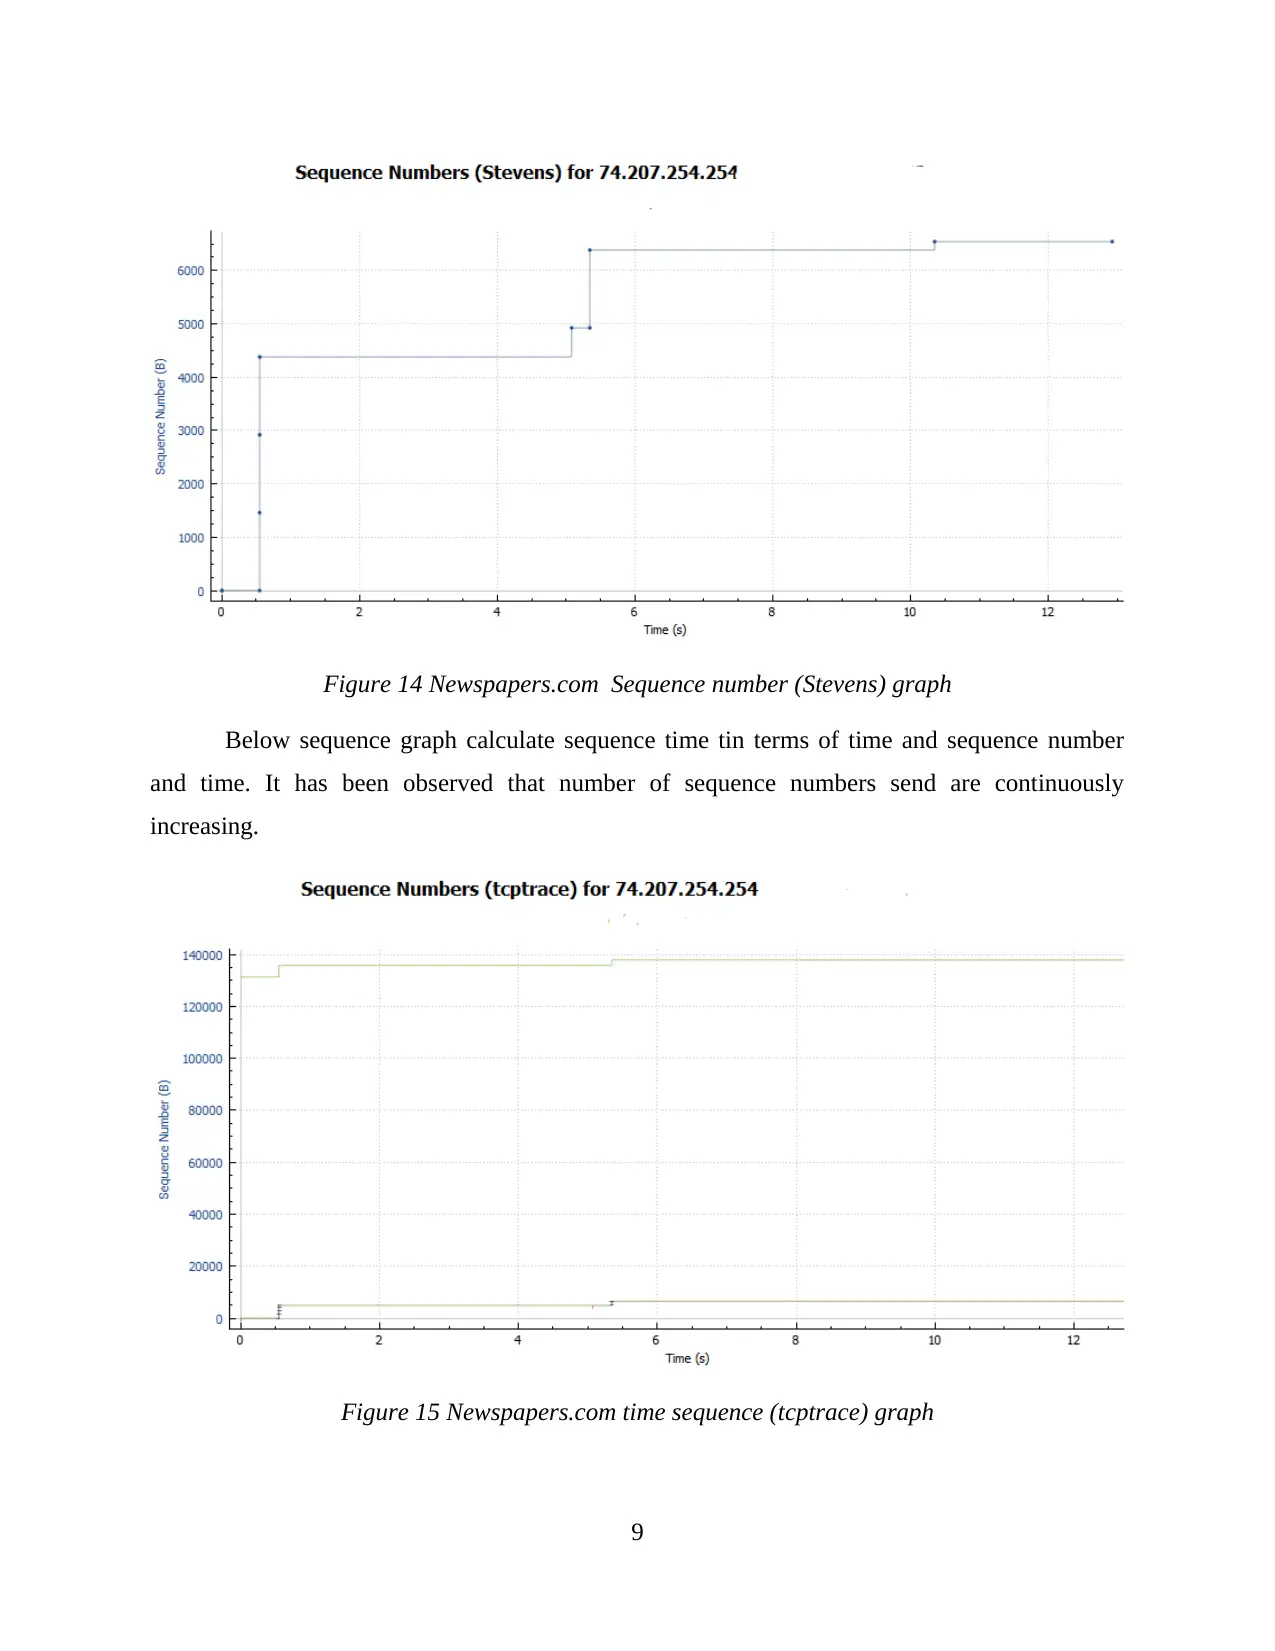
Figure 14 Newspapers.com Sequence number (Stevens) graph
Below sequence graph calculate sequence time tin terms of time and sequence number
and time. It has been observed that number of sequence numbers send are continuously
increasing.
Figure 15 Newspapers.com time sequence (tcptrace) graph
9
Below sequence graph calculate sequence time tin terms of time and sequence number
and time. It has been observed that number of sequence numbers send are continuously
increasing.
Figure 15 Newspapers.com time sequence (tcptrace) graph
9
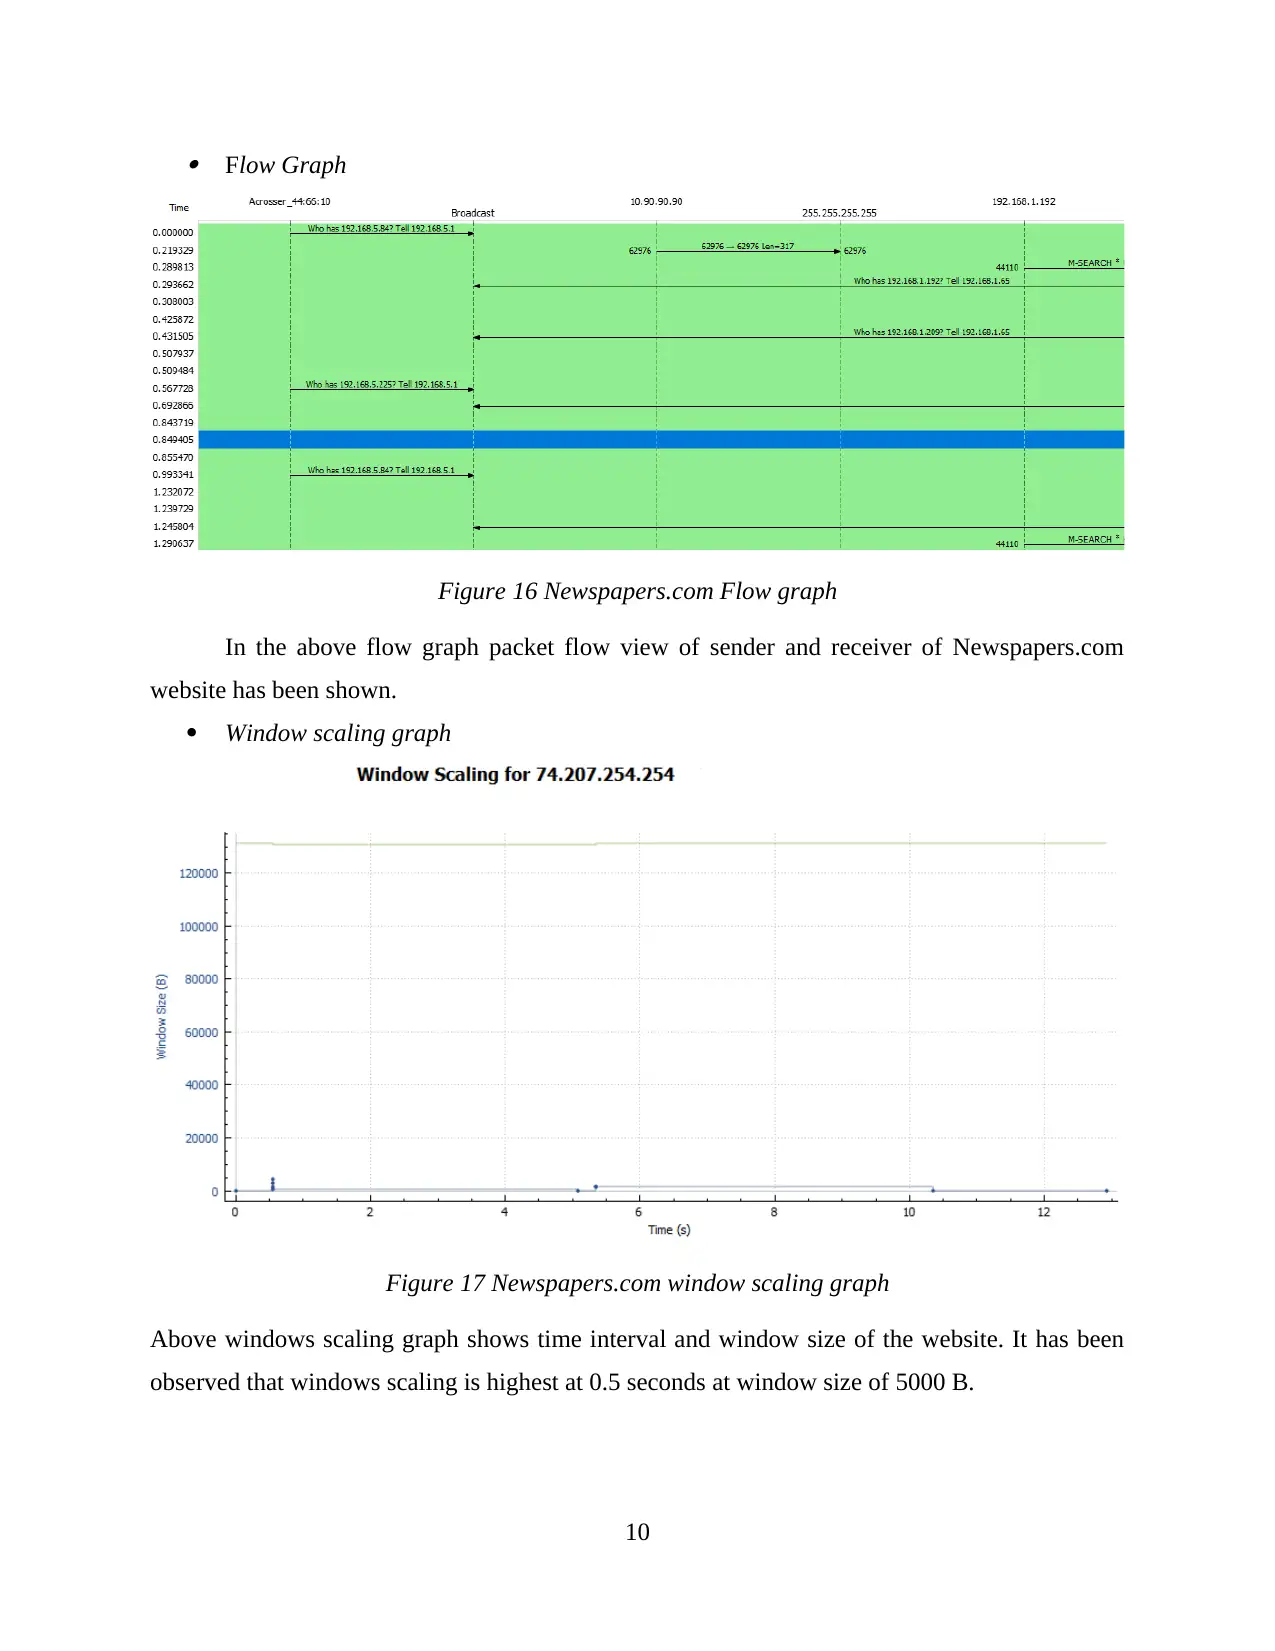
Flow Graph
Figure 16 Newspapers.com Flow graph
In the above flow graph packet flow view of sender and receiver of Newspapers.com
website has been shown.
Window scaling graph
Figure 17 Newspapers.com window scaling graph
Above windows scaling graph shows time interval and window size of the website. It has been
observed that windows scaling is highest at 0.5 seconds at window size of 5000 B.
10
⊘ This is a preview!⊘
Do you want full access?
Subscribe today to unlock all pages.

Trusted by 1+ million students worldwide
1 out of 15
Related Documents
Your All-in-One AI-Powered Toolkit for Academic Success.
+13062052269
info@desklib.com
Available 24*7 on WhatsApp / Email
![[object Object]](/_next/static/media/star-bottom.7253800d.svg)
Unlock your academic potential
Copyright © 2020–2026 A2Z Services. All Rights Reserved. Developed and managed by ZUCOL.


