Analysis of NEUROPOWER and IQFORCE Projects: Financial Report
VerifiedAdded on 2022/08/27
|10
|1731
|21
Report
AI Summary
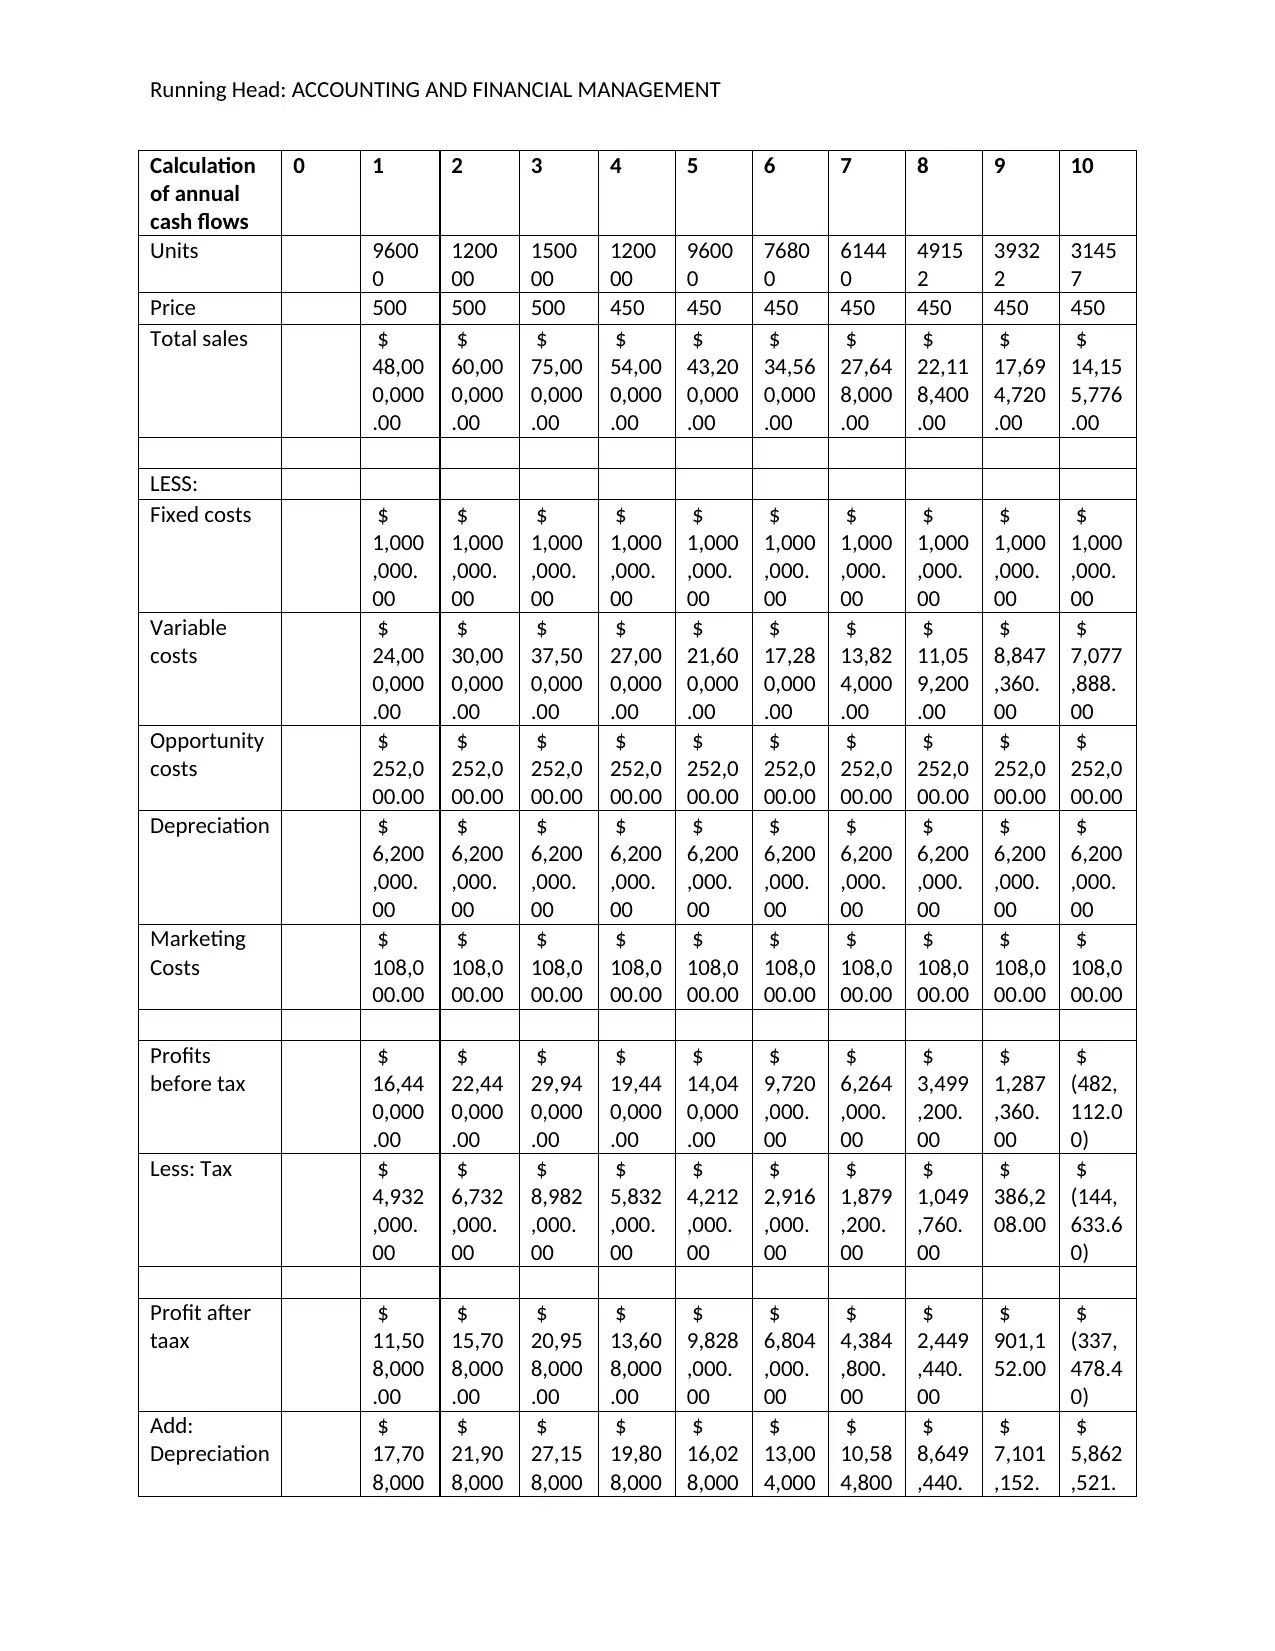
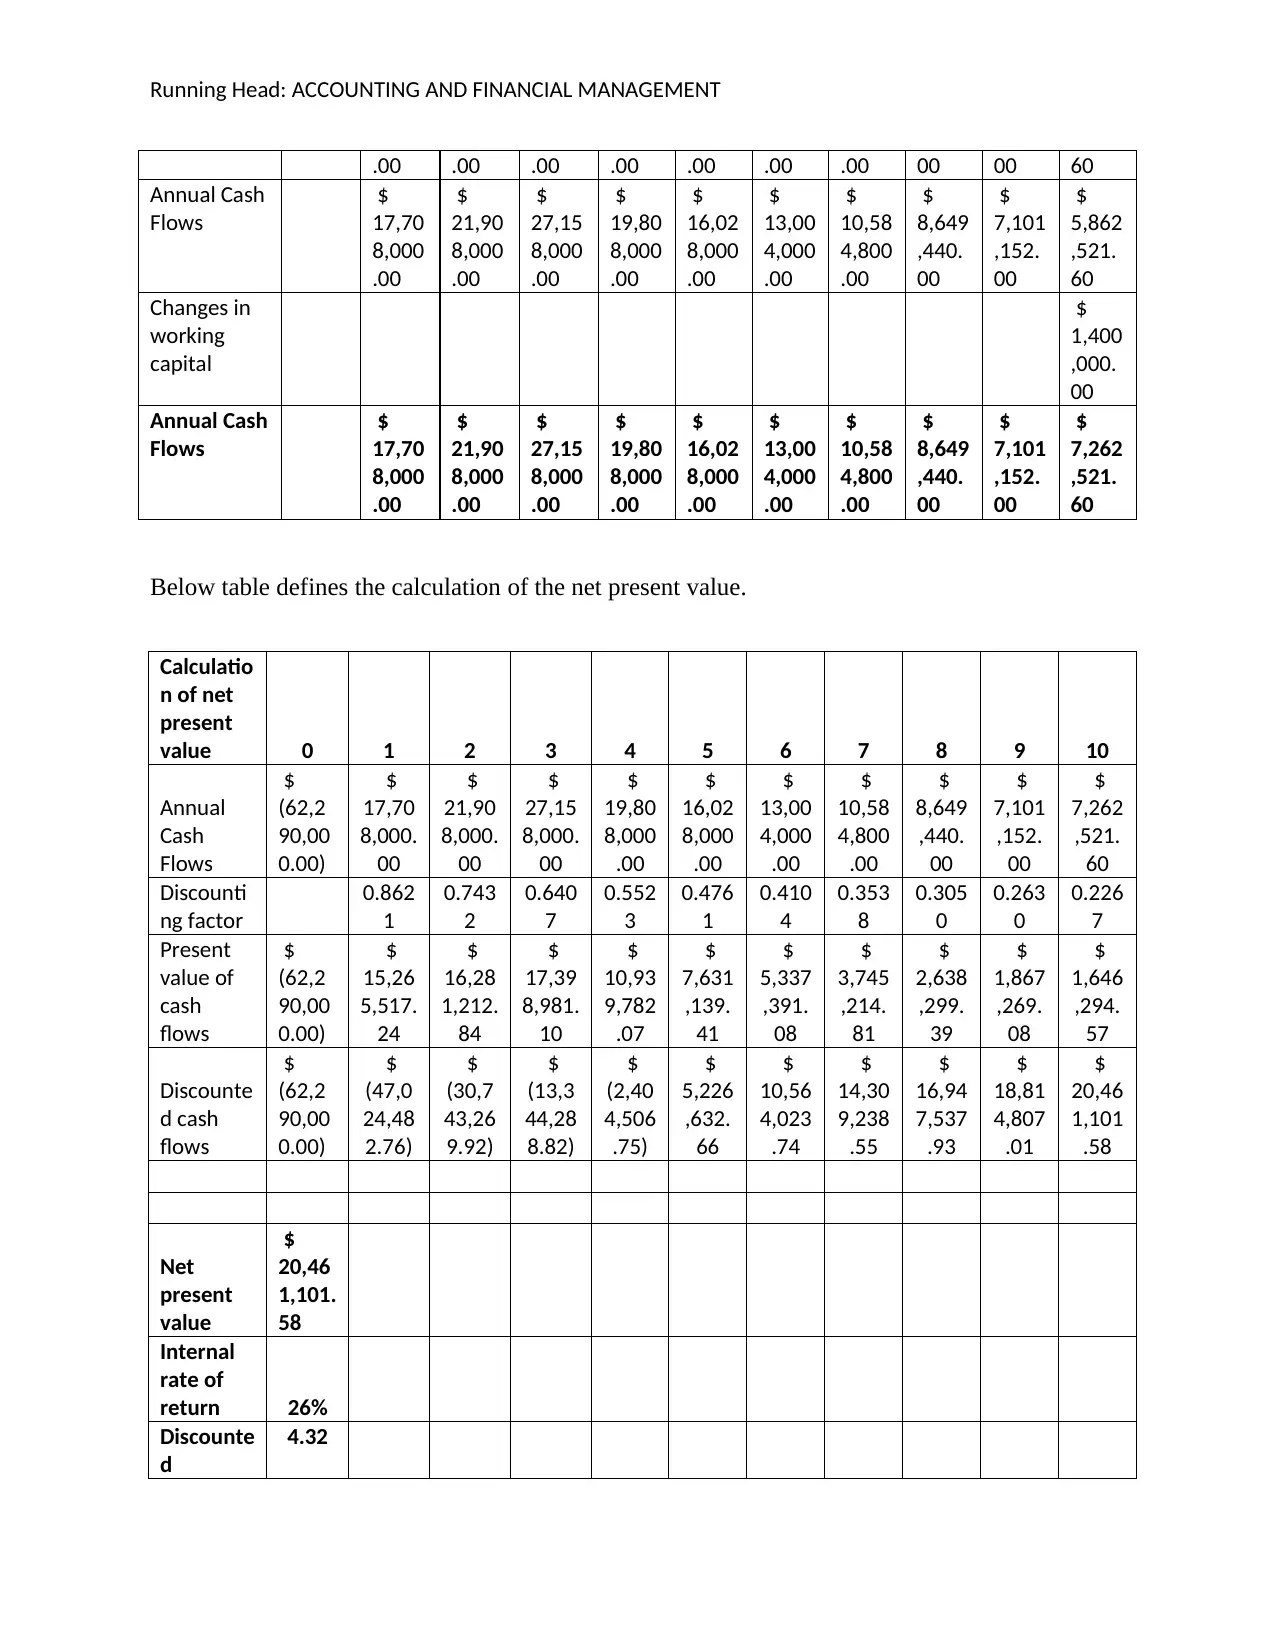
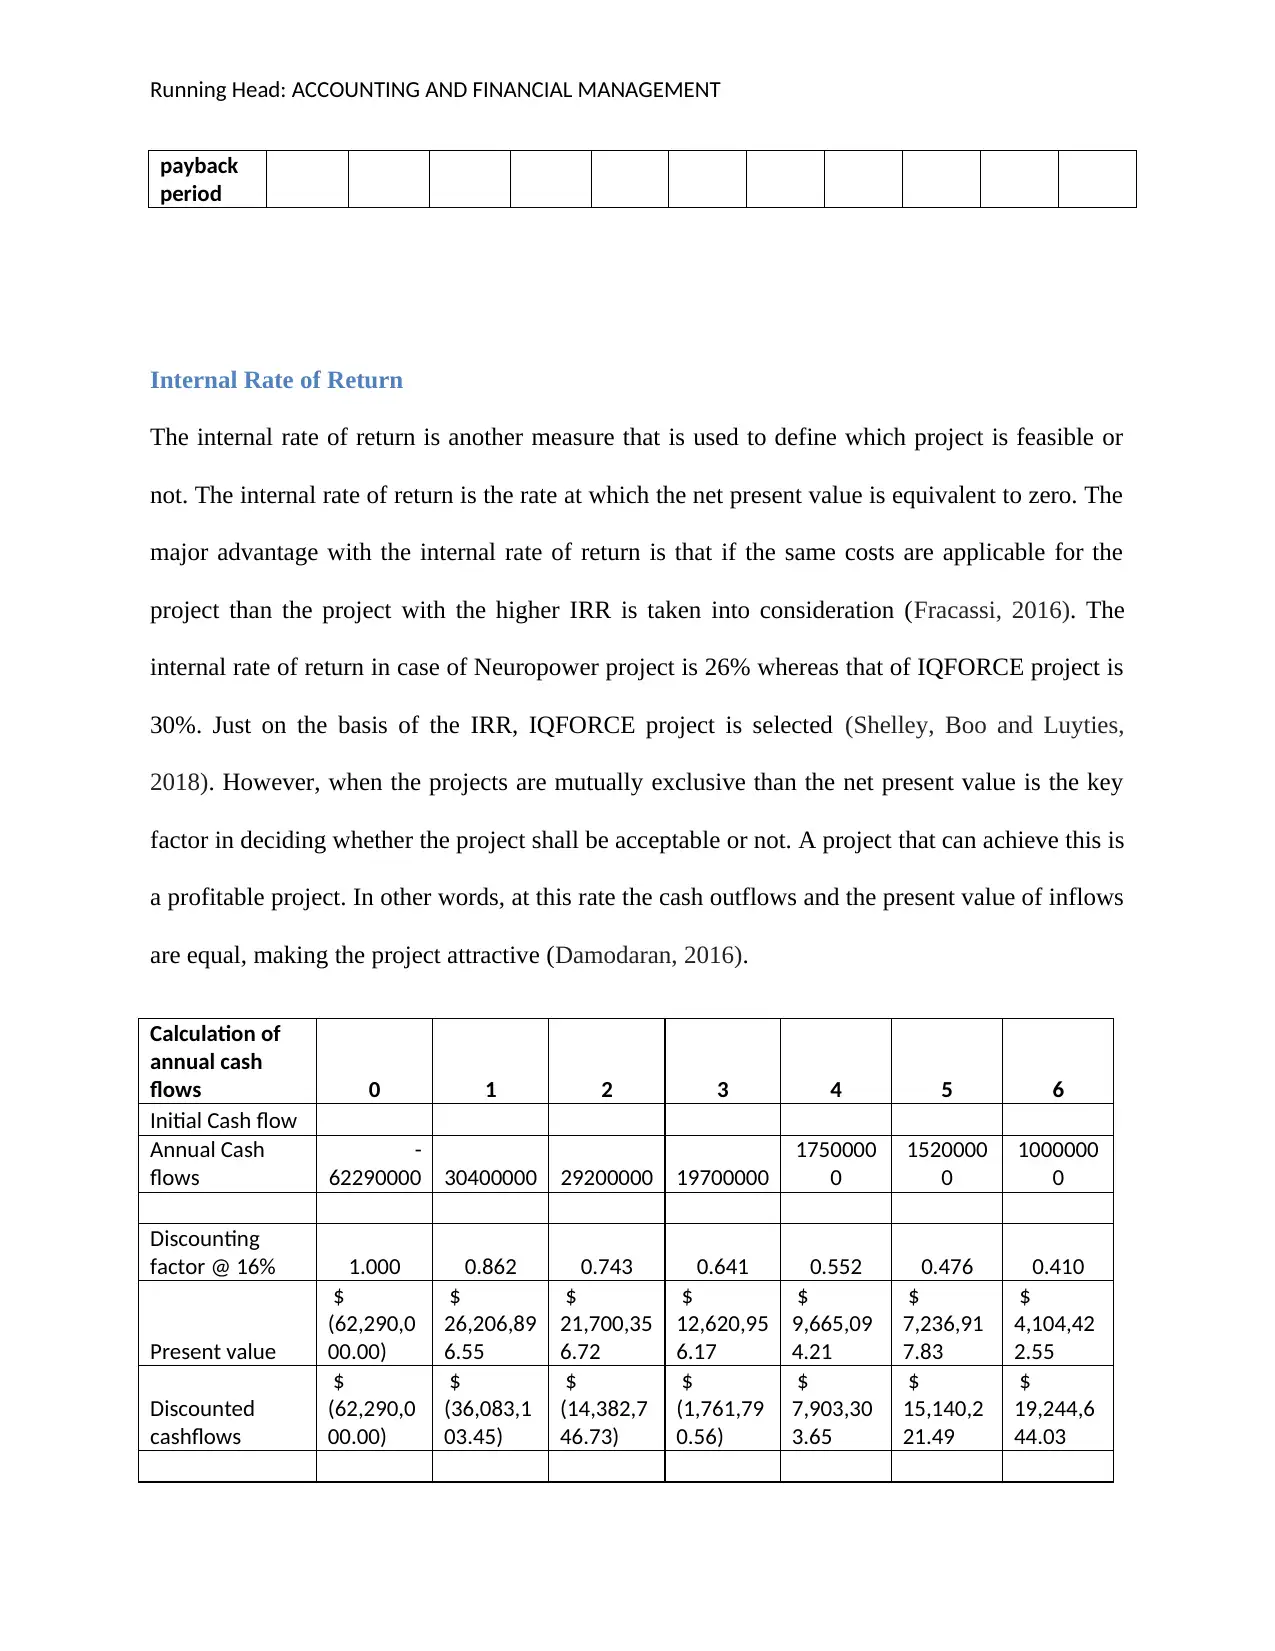
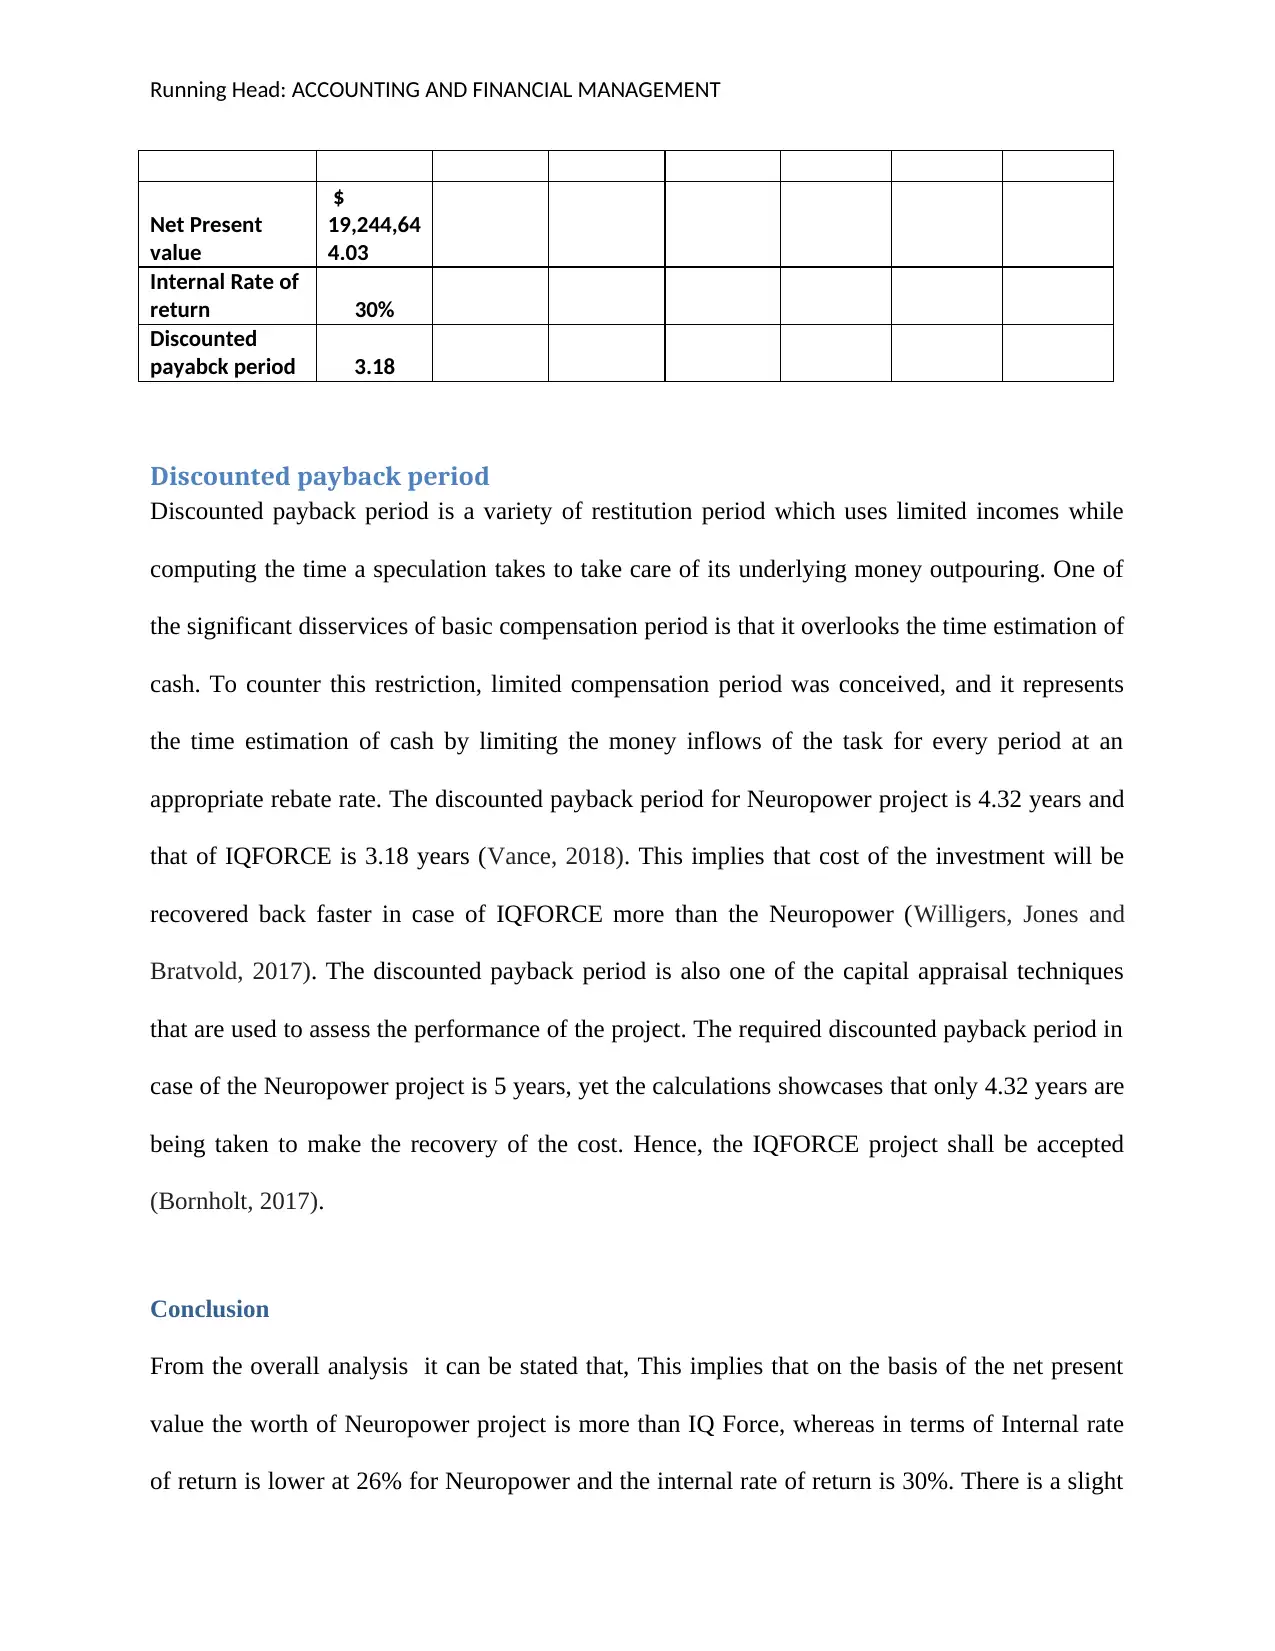
This report undertakes a detailed financial analysis of two projects, NEUROPOWER and IQFORCE, using capital budgeting techniques. The analysis focuses on Net Present Value (NPV), Internal Rate of Return (IRR), and discounted payback period to determine project viability. The report calculates annual cash flows, considering factors such as sales, fixed and variable costs, depreciation, and taxes. The NPV calculations show that NEUROPOWER has a higher value than IQFORCE. The IRR for NEUROPOWER is 26%, while IQFORCE has an IRR of 30%. The discounted payback period is 4.32 years for NEUROPOWER and 3.18 years for IQFORCE. Based on the analysis, the report recommends the IQFORCE project due to its higher IRR and faster payback period, despite NEUROPOWER's higher NPV.
Contribute Materials
Your contribution can guide someone’s learning journey. Share your
documents today.

Running Head: ACCOUNTING AND FINANCIAL MANAGEMENT 1
ACCOUNTING AND FINANCIAL MANAGEMENT
Secure Best Marks with AI Grader
Need help grading? Try our AI Grader for instant feedback on your assignments.

Running Head: ACCOUNTING AND FINANCIAL MANAGEMENT
Contents
Introduction.................................................................................................................................................3
Net Present value.....................................................................................................................................3
Calculation of the cash flows...................................................................................................................3
Internal Rate of Return............................................................................................................................6
Discounted payback period.....................................................................................................................7
Conclusion...................................................................................................................................................7
References...................................................................................................................................................9

Running Head: ACCOUNTING AND FINANCIAL MANAGEMENT
Introduction
In this report a detailed analysis is undertaken on the basis of net present value and the internal
rate of return of the project. The viability of the project is decided on the basis of the capital
budgeting techniques. The common methods that are used for evaluating the project are net
present value and the internal rate of return. In this report the two projects are considered on the
basis of the capital appraisal techniques such as NEUROPOWER AND IQFORCE. Below is the
calculative description that could help in understanding which project will be feasible or not
(Ismail, 2016).
Net Present value
The net present value is the value which is defined as the difference between the present value of
the cash flows which are coming in and going out. The best element while calculating the net
present value is that it considers the concept of the time value of money. The biggest advantage
of the net present value is that it considers the value of money more worthy at present than in
terms of the future value (Loubière, et al 2016). In order to select the viability of the project the
project with the positive net present value is selected and the project with the higher value is
selected. In the present scenario it can be ascertained that the net present value of the
Neuropower is $ 20,461,101.58, whereas that of IQFORCE is $ 19,244,644.03 (Iooss and
Lemaître, 2015).
The existing project will give more potential returns to the company when compared
against the IQFORCE project (Gabriel Filho, et al 2016).
Calculation of the cash flows

Running Head: ACCOUNTING AND FINANCIAL MANAGEMENT
Calculation
of annual
cash flows
0 1 2 3 4 5 6 7 8 9 10
Units 9600
0
1200
00
1500
00
1200
00
9600
0
7680
0
6144
0
4915
2
3932
2
3145
7
Price 500 500 500 450 450 450 450 450 450 450
Total sales $
48,00
0,000
.00
$
60,00
0,000
.00
$
75,00
0,000
.00
$
54,00
0,000
.00
$
43,20
0,000
.00
$
34,56
0,000
.00
$
27,64
8,000
.00
$
22,11
8,400
.00
$
17,69
4,720
.00
$
14,15
5,776
.00
LESS:
Fixed costs $
1,000
,000.
00
$
1,000
,000.
00
$
1,000
,000.
00
$
1,000
,000.
00
$
1,000
,000.
00
$
1,000
,000.
00
$
1,000
,000.
00
$
1,000
,000.
00
$
1,000
,000.
00
$
1,000
,000.
00
Variable
costs
$
24,00
0,000
.00
$
30,00
0,000
.00
$
37,50
0,000
.00
$
27,00
0,000
.00
$
21,60
0,000
.00
$
17,28
0,000
.00
$
13,82
4,000
.00
$
11,05
9,200
.00
$
8,847
,360.
00
$
7,077
,888.
00
Opportunity
costs
$
252,0
00.00
$
252,0
00.00
$
252,0
00.00
$
252,0
00.00
$
252,0
00.00
$
252,0
00.00
$
252,0
00.00
$
252,0
00.00
$
252,0
00.00
$
252,0
00.00
Depreciation $
6,200
,000.
00
$
6,200
,000.
00
$
6,200
,000.
00
$
6,200
,000.
00
$
6,200
,000.
00
$
6,200
,000.
00
$
6,200
,000.
00
$
6,200
,000.
00
$
6,200
,000.
00
$
6,200
,000.
00
Marketing
Costs
$
108,0
00.00
$
108,0
00.00
$
108,0
00.00
$
108,0
00.00
$
108,0
00.00
$
108,0
00.00
$
108,0
00.00
$
108,0
00.00
$
108,0
00.00
$
108,0
00.00
Profits
before tax
$
16,44
0,000
.00
$
22,44
0,000
.00
$
29,94
0,000
.00
$
19,44
0,000
.00
$
14,04
0,000
.00
$
9,720
,000.
00
$
6,264
,000.
00
$
3,499
,200.
00
$
1,287
,360.
00
$
(482,
112.0
0)
Less: Tax $
4,932
,000.
00
$
6,732
,000.
00
$
8,982
,000.
00
$
5,832
,000.
00
$
4,212
,000.
00
$
2,916
,000.
00
$
1,879
,200.
00
$
1,049
,760.
00
$
386,2
08.00
$
(144,
633.6
0)
Profit after
taax
$
11,50
8,000
.00
$
15,70
8,000
.00
$
20,95
8,000
.00
$
13,60
8,000
.00
$
9,828
,000.
00
$
6,804
,000.
00
$
4,384
,800.
00
$
2,449
,440.
00
$
901,1
52.00
$
(337,
478.4
0)
Add:
Depreciation
$
17,70
8,000
$
21,90
8,000
$
27,15
8,000
$
19,80
8,000
$
16,02
8,000
$
13,00
4,000
$
10,58
4,800
$
8,649
,440.
$
7,101
,152.
$
5,862
,521.
Secure Best Marks with AI Grader
Need help grading? Try our AI Grader for instant feedback on your assignments.

Running Head: ACCOUNTING AND FINANCIAL MANAGEMENT
.00 .00 .00 .00 .00 .00 .00 00 00 60
Annual Cash
Flows
$
17,70
8,000
.00
$
21,90
8,000
.00
$
27,15
8,000
.00
$
19,80
8,000
.00
$
16,02
8,000
.00
$
13,00
4,000
.00
$
10,58
4,800
.00
$
8,649
,440.
00
$
7,101
,152.
00
$
5,862
,521.
60
Changes in
working
capital
$
1,400
,000.
00
Annual Cash
Flows
$
17,70
8,000
.00
$
21,90
8,000
.00
$
27,15
8,000
.00
$
19,80
8,000
.00
$
16,02
8,000
.00
$
13,00
4,000
.00
$
10,58
4,800
.00
$
8,649
,440.
00
$
7,101
,152.
00
$
7,262
,521.
60
Below table defines the calculation of the net present value.
Calculatio
n of net
present
value 0 1 2 3 4 5 6 7 8 9 10
Annual
Cash
Flows
$
(62,2
90,00
0.00)
$
17,70
8,000.
00
$
21,90
8,000.
00
$
27,15
8,000.
00
$
19,80
8,000
.00
$
16,02
8,000
.00
$
13,00
4,000
.00
$
10,58
4,800
.00
$
8,649
,440.
00
$
7,101
,152.
00
$
7,262
,521.
60
Discounti
ng factor
0.862
1
0.743
2
0.640
7
0.552
3
0.476
1
0.410
4
0.353
8
0.305
0
0.263
0
0.226
7
Present
value of
cash
flows
$
(62,2
90,00
0.00)
$
15,26
5,517.
24
$
16,28
1,212.
84
$
17,39
8,981.
10
$
10,93
9,782
.07
$
7,631
,139.
41
$
5,337
,391.
08
$
3,745
,214.
81
$
2,638
,299.
39
$
1,867
,269.
08
$
1,646
,294.
57
Discounte
d cash
flows
$
(62,2
90,00
0.00)
$
(47,0
24,48
2.76)
$
(30,7
43,26
9.92)
$
(13,3
44,28
8.82)
$
(2,40
4,506
.75)
$
5,226
,632.
66
$
10,56
4,023
.74
$
14,30
9,238
.55
$
16,94
7,537
.93
$
18,81
4,807
.01
$
20,46
1,101
.58
Net
present
value
$
20,46
1,101.
58
Internal
rate of
return 26%
Discounte
d
4.32

Running Head: ACCOUNTING AND FINANCIAL MANAGEMENT
payback
period
Internal Rate of Return
The internal rate of return is another measure that is used to define which project is feasible or
not. The internal rate of return is the rate at which the net present value is equivalent to zero. The
major advantage with the internal rate of return is that if the same costs are applicable for the
project than the project with the higher IRR is taken into consideration (Fracassi, 2016). The
internal rate of return in case of Neuropower project is 26% whereas that of IQFORCE project is
30%. Just on the basis of the IRR, IQFORCE project is selected (Shelley, Boo and Luyties,
2018). However, when the projects are mutually exclusive than the net present value is the key
factor in deciding whether the project shall be acceptable or not. A project that can achieve this is
a profitable project. In other words, at this rate the cash outflows and the present value of inflows
are equal, making the project attractive (Damodaran, 2016).
Calculation of
annual cash
flows 0 1 2 3 4 5 6
Initial Cash flow
Annual Cash
flows
-
62290000 30400000 29200000 19700000
1750000
0
1520000
0
1000000
0
Discounting
factor @ 16% 1.000 0.862 0.743 0.641 0.552 0.476 0.410
Present value
$
(62,290,0
00.00)
$
26,206,89
6.55
$
21,700,35
6.72
$
12,620,95
6.17
$
9,665,09
4.21
$
7,236,91
7.83
$
4,104,42
2.55
Discounted
cashflows
$
(62,290,0
00.00)
$
(36,083,1
03.45)
$
(14,382,7
46.73)
$
(1,761,79
0.56)
$
7,903,30
3.65
$
15,140,2
21.49
$
19,244,6
44.03

Running Head: ACCOUNTING AND FINANCIAL MANAGEMENT
Net Present
value
$
19,244,64
4.03
Internal Rate of
return 30%
Discounted
payabck period 3.18
Discounted payback period
Discounted payback period is a variety of restitution period which uses limited incomes while
computing the time a speculation takes to take care of its underlying money outpouring. One of
the significant disservices of basic compensation period is that it overlooks the time estimation of
cash. To counter this restriction, limited compensation period was conceived, and it represents
the time estimation of cash by limiting the money inflows of the task for every period at an
appropriate rebate rate. The discounted payback period for Neuropower project is 4.32 years and
that of IQFORCE is 3.18 years (Vance, 2018). This implies that cost of the investment will be
recovered back faster in case of IQFORCE more than the Neuropower (Willigers, Jones and
Bratvold, 2017). The discounted payback period is also one of the capital appraisal techniques
that are used to assess the performance of the project. The required discounted payback period in
case of the Neuropower project is 5 years, yet the calculations showcases that only 4.32 years are
being taken to make the recovery of the cost. Hence, the IQFORCE project shall be accepted
(Bornholt, 2017).
Conclusion
From the overall analysis it can be stated that, This implies that on the basis of the net present
value the worth of Neuropower project is more than IQ Force, whereas in terms of Internal rate
of return is lower at 26% for Neuropower and the internal rate of return is 30%. There is a slight
Paraphrase This Document
Need a fresh take? Get an instant paraphrase of this document with our AI Paraphraser

Running Head: ACCOUNTING AND FINANCIAL MANAGEMENT
difference in case of the net present value; otherwise the project is feasible fully. Hence Iqforce
is the right choice for the company to proceed with.
difference in case of the net present value; otherwise the project is feasible fully. Hence Iqforce
is the right choice for the company to proceed with.

Running Head: ACCOUNTING AND FINANCIAL MANAGEMENT
References
Bornholt, G., 2017. What is an Investment Project's Implied Rate of Return?. Abacus, 53(4),
pp.513-526.
Damodaran, A., 2016. Damodaran on valuation: security analysis for investment and corporate
finance (Vol. 324). John Wiley & Sons.
Fracassi, C., 2016. Corporate finance policies and social networks. Management Science, 63(8),
pp.2420-2438.
Gabriel Filho, L.A., Cremasco, C.P., Putti, F.F., Goes, B.C. and Magalhaes, M.M., 2016.
Geometric Analysis of Net Present Value and Internal Rate of Return. Journal of Applied
Mathematics & Informatics, 34, pp.75-84.
Iooss, B. and Lemaître, P., 2015. A review on global sensitivity analysis methods. In Uncertainty
management in simulation-optimization of complex systems (pp. 101-122). Springer, Boston,
MA.
Ismail, R., 2016. Impact of Liquidity Management on Profitability of Pakistani Firms: A Case of
KSE-100 Index. International Journal of Innovation and Applied Studies, 14(2), p.304.
Loubière, P., Jourdan, A., Siarry, P. and Chelouah, R., 2016. A sensitivity analysis method for
driving the Artificial Bee Colony algorithm's search process. Applied Soft Computing, 41,
pp.515-531.

Running Head: ACCOUNTING AND FINANCIAL MANAGEMENT
Shelley, A.S., Boo, S.Y. and Luyties, W., 2018. Net Project Value Assessment of Korean
Offshore Floating Wind Farm using Y-Wind Semi Platform. In Korea Wind Energy Association
(KWEA), Fall Conference.
Vance, D.E., 2018. A New Algorithm for Internal Rate of Return. Journal of Economics,
Management and Trade, pp.1-9.
Willigers, B.J., Jones, B. and Bratvold, R.B., 2017. The Net-Present-Value Paradox: Criticized
by Many, Applied by All. SPE Economics & Management.
1 out of 10
Related Documents

Your All-in-One AI-Powered Toolkit for Academic Success.
+13062052269
info@desklib.com
Available 24*7 on WhatsApp / Email
Unlock your academic potential
© 2024 | Zucol Services PVT LTD | All rights reserved.