BTEC Applied Science: Neutralization Reaction Lab Report and Analysis

Verified

Added on  2022/08/26

|7
|1698
|24
Report
AI Summary
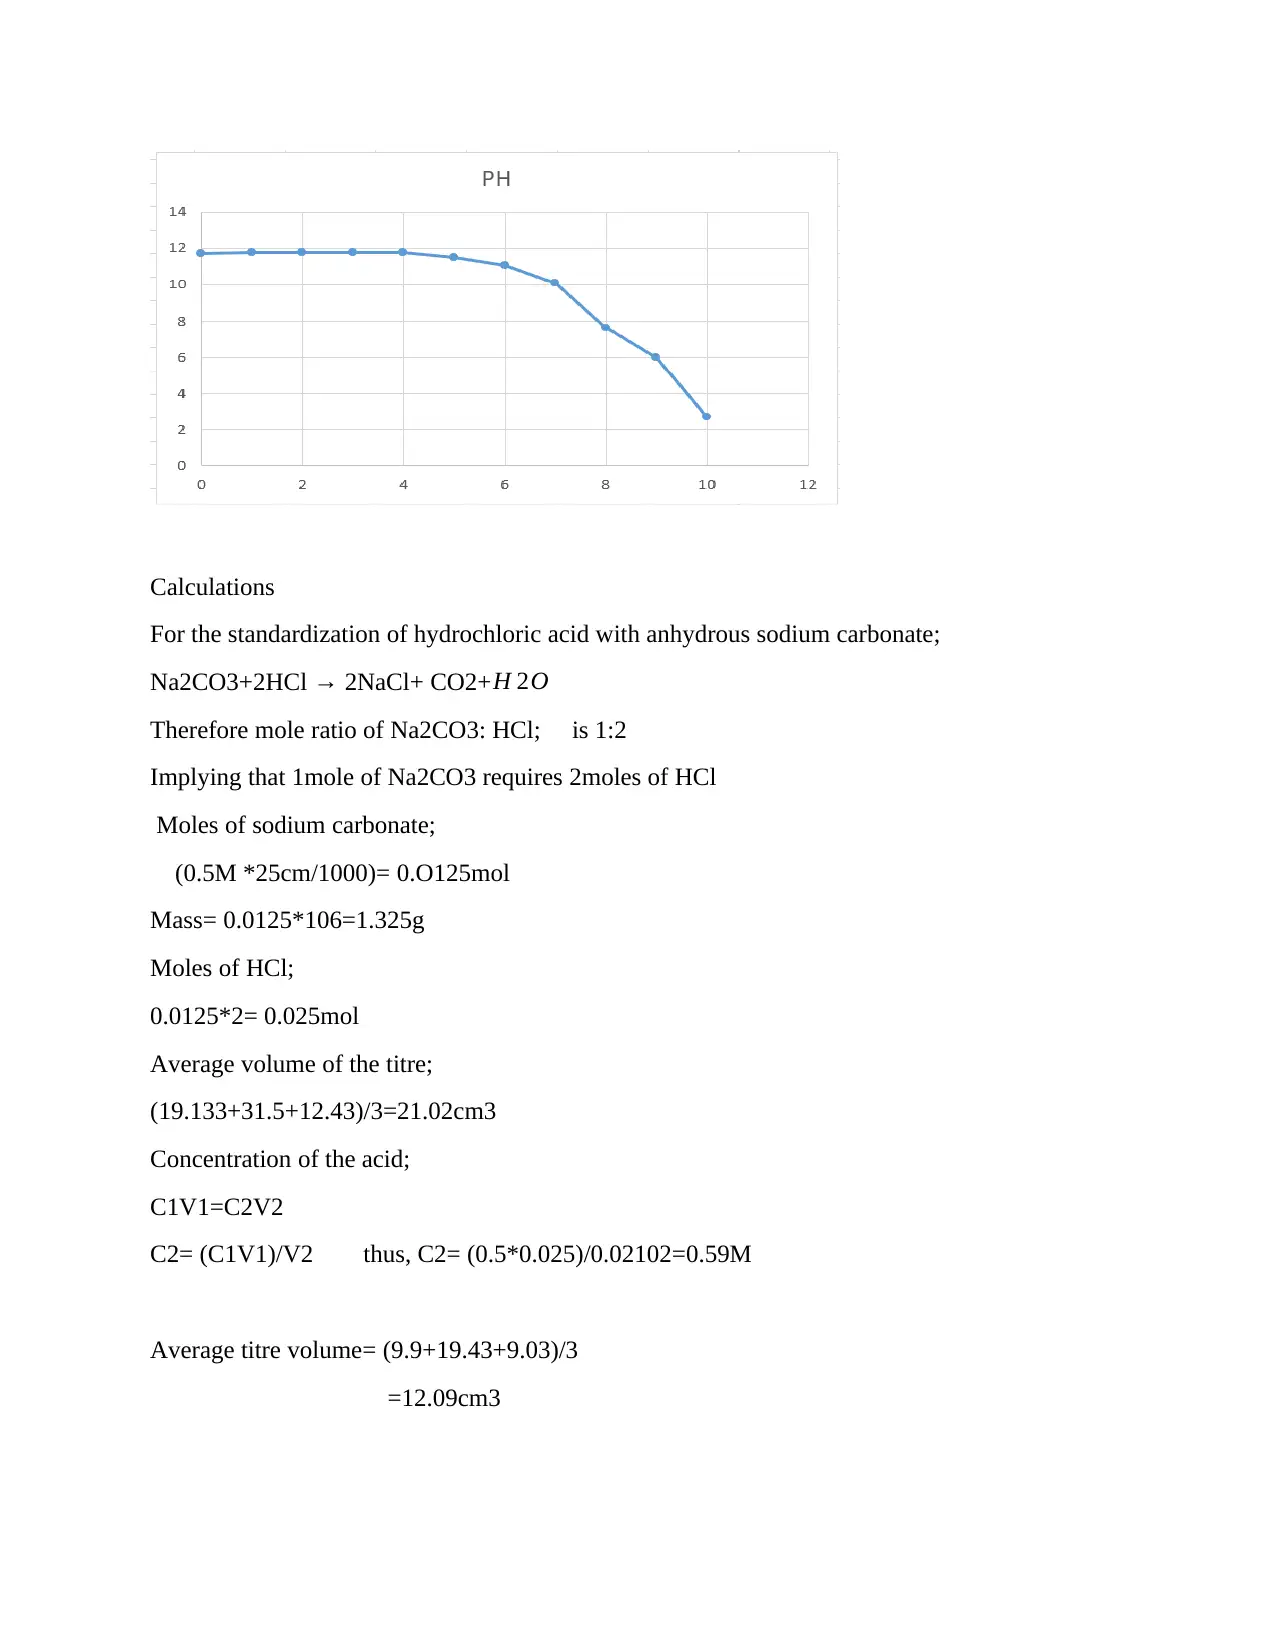
This lab report details an experiment on neutralization reactions, performed by a student as part of a BTEC Applied Science course. The experiment focuses on the titration of a strong base (sodium hydroxide) with a strong acid (hydrochloric acid) to determine the concentration of an unknown solution. The report includes an introduction to titration techniques, the requirements and reagents used, and a detailed methods section outlining the standardization of the acid and the titration process using both an indicator (methyl orange) and a pH meter. The results section presents calculations for determining the concentration of the acid and the average titre volume, followed by a discussion of the observed results, potential sources of error (such as hygroscopic primary standards and endpoint determination), and suggestions for minimizing errors. The student also reflects on the importance of proper equipment handling and safety procedures, including the use of personal protective equipment and proper disposal of solutions, along with relevant references. The report aims to demonstrate proficiency in practical scientific procedures and techniques, as required for the student's role as a technical assistant at Chemcalequip.
Document Page
Lab Report on Neutralization Reaction
Lab Report
October 23, 2020
1285 words
Name
Institution
Introduction
This is analytical technique use in quantitative analysis of analyte of interest (Zhu and
Wang 2010). Basically, the most common titration technique is an acid-base method which
entails the quantitation analysis of acids and bases. The essential part of understanding the basic
chemical reactions is to understanding the nature of acids and bases, whether strong or weak,
thus determining the shape of the titration curve in the chemical analysis.
In this process, stoichiometric volume of the standard titrant is expected to react completely
with unknown reactant i.e. analyte (Hu et al. 2001). During the reaction process, the titrant
neutralizes the analyte. Not all chemical reactions serves as the basis of titrations procedure, but
certain conditions has to be met (Avdeef, Berger and Brownell 2000) i.e.
The rate of chemical reaction must be high/fast
Proceeds stoichiometrically
The reaction must be spontaneous in which the change in Gibb’s free energy ( G) must
be sufficiently large
And finally, there must be a way out to detect the reaction completion
Titration makes use of the neutralization that occurs between acids and bases and the
knowledge of reaction between acids and bases. Buffer solutions are used to stabilize the pH. In
the neutralization reaction, chemical reaction is made between a known volume of solution of
unknown concentration and a known volume of solution with a known concentration.
As the neutralization reaction proceeds, an appropriate indicator is inserted onto the titration
chamber to indicate the pH range of the equivalence point and the end point, where the
equivalence point is determined by the stoichiometry of the reaction whereas endpoint is by
colour change. Other ways of detecting the endpoint of acid-reaction includes potentiometer (use
to measure the electrode potential of the solution), pH meter, precipitation and conductance, but
tabler-icon-diamond-filled.svg

Paraphrase This Document

Need a fresh take? Get an instant paraphrase of this document with our AI Paraphraser
Document Page
in this experiment, we rely on the use of an indicator and pHmeter. Use of pHindicator is prone
to susceptible to imprecise readings because of the subjective choice of colour.
The product of a neutralization reaction are water and salts. The salts formed are from equal
weights of acids and bases (Mitchell and Moyle 1967). In this experiment, we will quantitatively
analyze unknown solution of sodium hydroxide i.e. a strong base via titration method using
strong monoprotic acid, hydrochloric acid. Being the reaction is between strong acid and strong
acid, then the indicator use will be methyl orange which shows a colour change at the p H near
the endpoint. A titration curve is to be drawn to reflect the strength of the corresponding acids
and base by showing the pHchange as the titration proceeds (Soldatov 1995).
Requirements and Reagents
a) Pipette
b) Methyl orange indicator
c) 100cm3 beaker
d) 0.1M Hydrochloric acid
e) Burette
f) 250cm3 Erlenmeyer flask
g) White tile
h) Clamp and stand
i) pH meter
j) Analytical balance
k) Anhydrous sodium carbonate
l) Ranbowed
m) Funnel
n) Electric scale
Methods
Part 2- standardization of an acid
I. Pipette was calibrated
II. 25cm3 of sodium carbonate solution was carefully and accurately transferred into a
250cm3 conical flask followed by a few drops of methyl orange indicator.
III. A burette was cleaned and filled with a given solution of hydrochloric acid, with a
proximate centration of approximately 0.1M
IV. The sodium carbonate solution was titrated with the hydrochloric acid, until the indicator
changes colour changes at the endpoint.
V. All measurements were accurately and precisely recorded and used to determine the exact
titre of the acid.
Part 3a- titrations of sodium with hydrochloric acid (using an indicator)
I. 25cm3 of sodium hydroxide solution (unknown) was carefully and accurately transferred
into 250cm3 conical flask then followed by few drops of methyl orange indicator
II. A burette was cleaned and filled with the standardized solution of hydrochloric acid.
Document Page
III. Sodium hydroxide solution was titrated with hydrochloric acid, until the indicator
changed the colour at the endpoint. All measurements was accurately and precisely
recorded
Part3b-titration of sodium hydroxide with hydrochloric acid (using a pH meter)
25cm3 of sodium hydroxide solution was accurately and precisely transfer into a small beaker
The pH meter was calibrated and placed into the beaker of sodium hydroxide
A burette was cleaned and filled with the standardized solution of hydrochloric acid.
Hydrochloric acid was added from the burette to the sodium hydroxide solution in 1cm3 portions
until all of the acid was added. And the pH reading was measured on the pH meter after every
1cm3 of hydrochloric acid addition.
All the burette and pH measurements were recorded accurately and precisely in the table.
Results
Document Page
tabler-icon-diamond-filled.svg

Paraphrase This Document

Need a fresh take? Get an instant paraphrase of this document with our AI Paraphraser
Document Page
Calculations
For the standardization of hydrochloric acid with anhydrous sodium carbonate;
Na2CO3+2HCl 2NaCl+ CO2+ H 2O
Therefore mole ratio of Na2CO3: HCl; is 1:2
Implying that 1mole of Na2CO3 requires 2moles of HCl
Moles of sodium carbonate;
(0.5M *25cm/1000)= 0.O125mol
Mass= 0.0125*106=1.325g
Moles of HCl;
0.0125*2= 0.025mol
Average volume of the titre;
(19.133+31.5+12.43)/3=21.02cm3
Concentration of the acid;
C1V1=C2V2
C2= (C1V1)/V2 thus, C2= (0.5*0.025)/0.02102=0.59M
Average titre volume= (9.9+19.43+9.03)/3
=12.09cm3
Document Page
Discussion
Strong acid and the strong bases fully neutralize and the resulting salt is neutral with a pH of 7.0
implying that at this point ,there exist an equal amount of hydroxyl ions and hydronium ions and
the solution is at equivalence point. This is due to the fact the both the titre and the analyte are
ionic chemicals which dissociate full to OH ion and H ions, respectively, when dissolved in
water. When the solution of hydrochloric acid, was exactly neutralized with a solution of sodium
hydroxide, the moles of the sodium hydroxide used was equal to the moles of hydrochloric acid
originally present.
The suitable indicator used was methyl orange as the reaction was involving both strong acid and
base; the colour change was in the pH range of 4 -10. Literally, it is expected that pH to change
as more of the alkali i.e. sodium hydroxide solution is added up to a neutral value consistently
(Johnson, Brandenberger and Baccini 1995), however, this was not the case in the experiment
indicating the presence of both systematic and random errors. Sources of these errors could be;
being that sodium carbonate (used as the primary standard in the standardization of the acid) is
hygroscopic hence could have absorbed water from the surroundings thereby increasing its
weight, difficulty in determining the end-point of the reaction as it quite easy to get over the end-
point with a few drops, though the colour change will be still accounted, but the quantity of the
acid used differs (Zalts et al. 2008). Moreover, pH is also affected by the temperature changes as
higher temperature raises the pH value for acidic solution while lowering that of the basic
solution (Totsche et al. 2006). And lastly, the burette might have gotten an air bubble blockage
inside with the base which might have flowed out with alkali into the acid making a value loss of
the real volume.
To help minimize errors, careful selection of indicator should be done, doing titration in
replicates will both increase precision and accuracy and temperatures considerations should be
taken into account to ensure that the data acquired does not deviate with an excessive amounts
(Cao et al. 2000). The indicator should be used in lower amounts and should have a pKa value
almost to the titration’s endpoint.
Finally, burette should be set at lower level so as to curb parallax errors.
Generally, the personnel undertaking this experiment should; (1) read and research more about
this experiment prior to practical, (2) practice proper instrumentation and equipment handling,
and (3) wear complete Personal Protective Equipment such us gloves, face mask, laboratory coat
and gloves as to ensure safety (Max and Chapados 2000). Again all solutions should be flashed
down the sink with surplus water.
References
Document Page
Avdeef A, Berger CM, Brownell C. Pharmaceutical Research 2000;17:85–9.
Cao C-X, Zhou S-L, He Y-Z et al. Experimental study on moving neutralization reaction
boundary created with the strong reactive electrolytes of HCl and NaOH in agarose gel.
Journal of Chromatography A 2000;891:337–347.
Hu H, Bhowmik P, Zhao B et al. Determination of the acidic sites of purified single-walled
carbon nanotubes by acid–base titration. Chemical Physics Letters 2001;345:25–28.
Johnson CA, Brandenberger S, B\accini P. Acid Neutralizing Capacity of Municipal Waste
Incinerator Bottom Ash. Environmental Science & Technology 1995;29:142–7.
Max J-J, Chapados C. Infrared titration of aqueous NaOH by aqueous HCl. Canadian Journal of
Chemistry 2000;78:64–72.
Mitchell P, Moyle J. Acid-base titration across the membrane system of rat-liver mitochondria.
Catalysis by uncouplers. Biochemical Journal 1967;104:588–600.
Soldatov VS. Quantitative Presentation of Potentiometric Titration Curves of Ion Exchangers.
Industrial & Engineering Chemistry Research 1995;34:2605–11.
Totsche O, Fyson A, Kalin M et al. Titration curves: a useful instrument for assessing the buffer
systems of acidic mining waters. Environmental Science and Pollution Research
International 2006;13:215–224.
Zalts A, El Hasi C, Rubio D et al. Pattern formation driven by an acid-base neutralization
reaction in aqueous media in a gravitational field. Physical Review E 2008;77, DOI:
10.1103/physreve.77.015304.
Zhu Y, Wang C. Galvanostatic Intermittent Titration Technique for Phase-Transformation
Electrodes. The Journal of Physical Chemistry C 2010;114:2830–41.
chevron_up_icon
1 out of 7
circle_padding
hide_on_mobile
zoom_out_icon
[object Object]