Financial Statement & Ratio Analysis: New Century Resources
VerifiedAdded on 2023/06/11
|14
|2412
|345
Report
AI Summary
This report provides a financial analysis of New Century Resources Limited, an Australian base metal developing company, using ratio analysis based on their annual reports for 2016 and 2017. The analysis covers liquidity, solvency, and profitability, utilizing ratios such as the current ratio, debt-to-equity ratio, return on owner's equity, net profit margin, and expense ratio. The findings suggest that New Century Resources Limited faces significant financial challenges, including poor liquidity, high debt, and negative profitability, leading to the conclusion that the company's financial performance is unsustainable and unattractive to potential investors. Recommendations are made to improve liquidity by increasing current assets, reducing the debt-to-equity ratio through equity financing, and focusing on profitable operations to enhance shareholder returns. Desklib offers a variety of study tools and resources for students.
Running Head: Financial Statement Analysis
Ratio Analysis
Ratio Analysis
Paraphrase This Document
Need a fresh take? Get an instant paraphrase of this document with our AI Paraphraser
Running Head: Financial Statement Analysis 1
Running Head: Financial Statement Analysis 2
⊘ This is a preview!⊘
Do you want full access?
Subscribe today to unlock all pages.
Trusted by 1+ million students worldwide
Running Head: Financial Statement Analysis 3
Introduction:
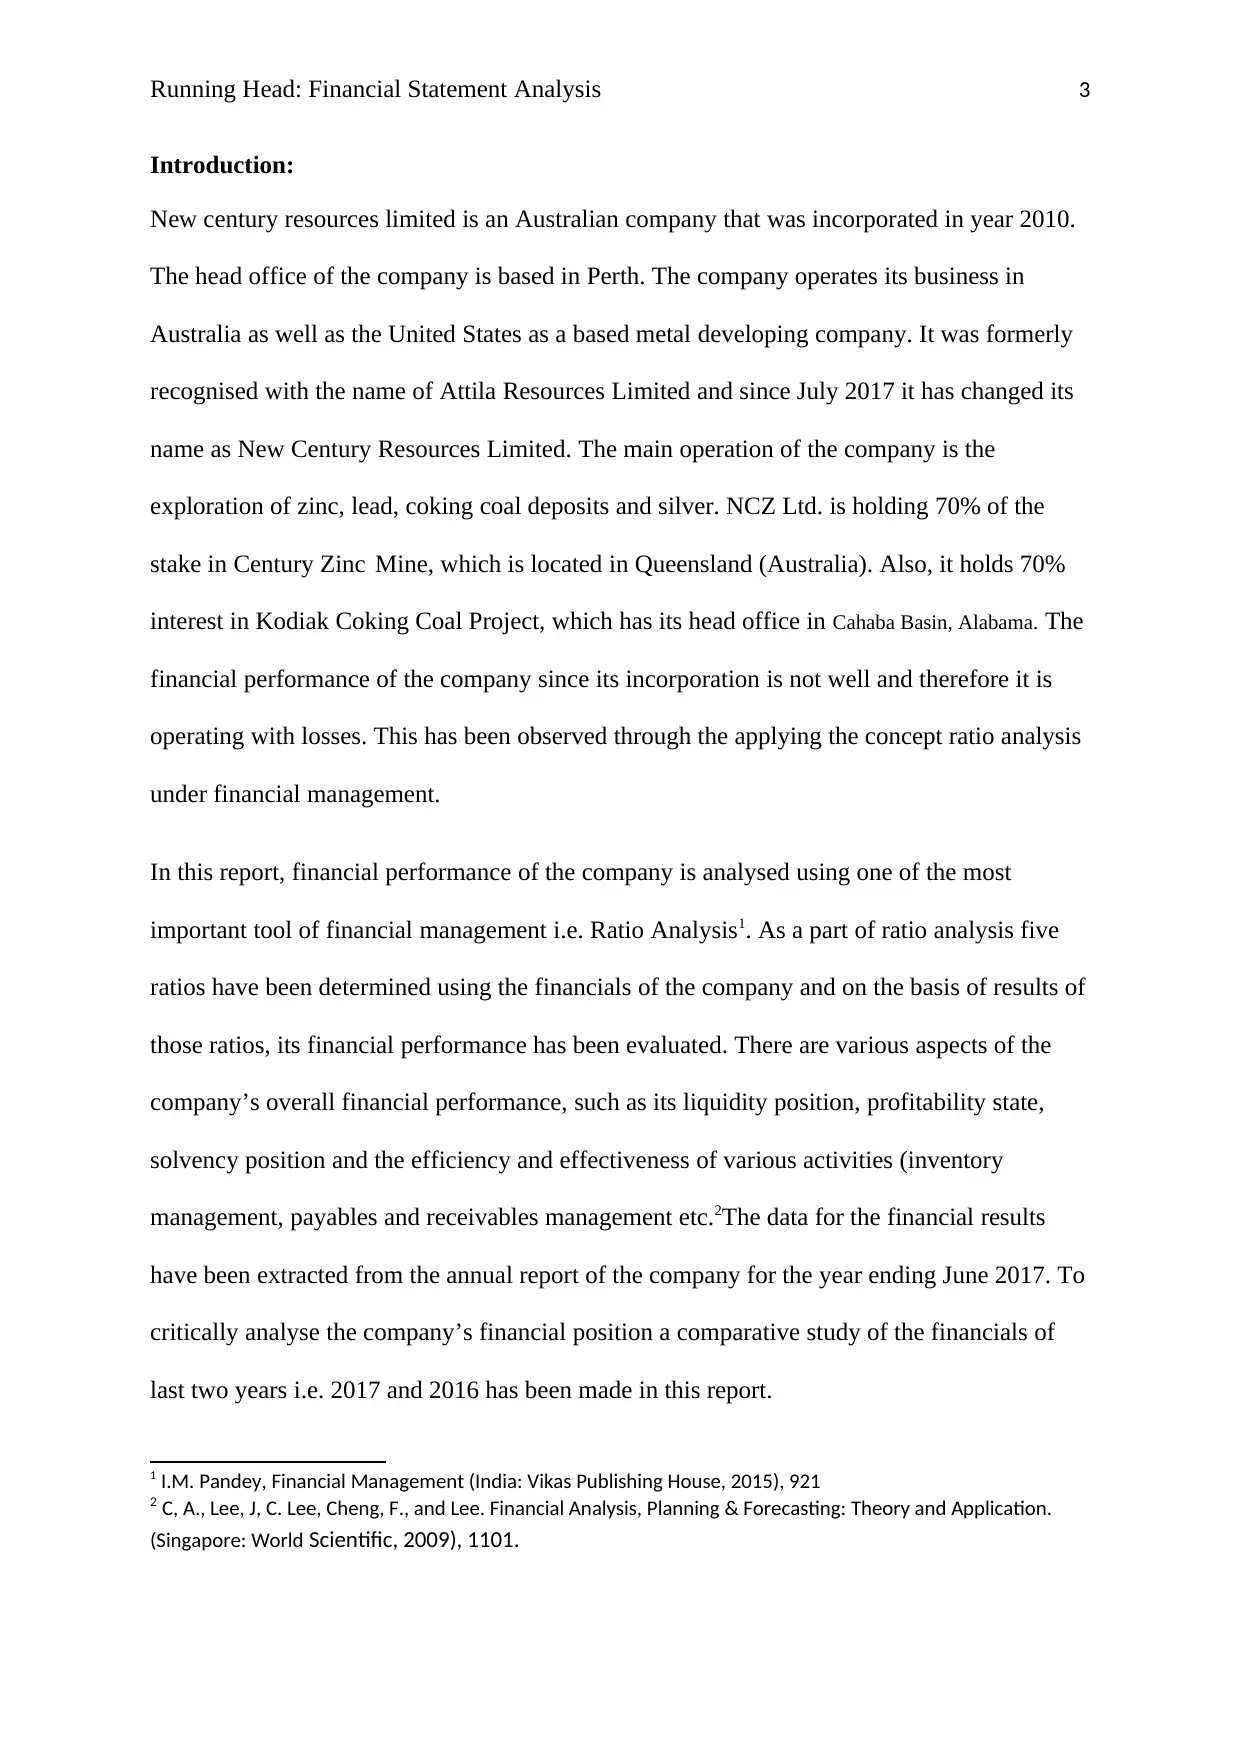
New century resources limited is an Australian company that was incorporated in year 2010.
The head office of the company is based in Perth. The company operates its business in
Australia as well as the United States as a based metal developing company. It was formerly
recognised with the name of Attila Resources Limited and since July 2017 it has changed its
name as New Century Resources Limited. The main operation of the company is the
exploration of zinc, lead, coking coal deposits and silver. NCZ Ltd. is holding 70% of the
stake in Century Zinc Mine, which is located in Queensland (Australia). Also, it holds 70%
interest in Kodiak Coking Coal Project, which has its head office in Cahaba Basin, Alabama. The
financial performance of the company since its incorporation is not well and therefore it is
operating with losses. This has been observed through the applying the concept ratio analysis
under financial management.
In this report, financial performance of the company is analysed using one of the most
important tool of financial management i.e. Ratio Analysis1. As a part of ratio analysis five
ratios have been determined using the financials of the company and on the basis of results of
those ratios, its financial performance has been evaluated. There are various aspects of the
company’s overall financial performance, such as its liquidity position, profitability state,
solvency position and the efficiency and effectiveness of various activities (inventory
management, payables and receivables management etc.2The data for the financial results
have been extracted from the annual report of the company for the year ending June 2017. To
critically analyse the company’s financial position a comparative study of the financials of
last two years i.e. 2017 and 2016 has been made in this report.
1 I.M. Pandey, Financial Management (India: Vikas Publishing House, 2015), 921
2 C, A., Lee, J, C. Lee, Cheng, F., and Lee. Financial Analysis, Planning & Forecasting: Theory and Application.
(Singapore: World Scientific, 2009), 1101.
Introduction:
New century resources limited is an Australian company that was incorporated in year 2010.
The head office of the company is based in Perth. The company operates its business in
Australia as well as the United States as a based metal developing company. It was formerly
recognised with the name of Attila Resources Limited and since July 2017 it has changed its
name as New Century Resources Limited. The main operation of the company is the
exploration of zinc, lead, coking coal deposits and silver. NCZ Ltd. is holding 70% of the
stake in Century Zinc Mine, which is located in Queensland (Australia). Also, it holds 70%
interest in Kodiak Coking Coal Project, which has its head office in Cahaba Basin, Alabama. The
financial performance of the company since its incorporation is not well and therefore it is
operating with losses. This has been observed through the applying the concept ratio analysis
under financial management.
In this report, financial performance of the company is analysed using one of the most
important tool of financial management i.e. Ratio Analysis1. As a part of ratio analysis five
ratios have been determined using the financials of the company and on the basis of results of
those ratios, its financial performance has been evaluated. There are various aspects of the
company’s overall financial performance, such as its liquidity position, profitability state,
solvency position and the efficiency and effectiveness of various activities (inventory
management, payables and receivables management etc.2The data for the financial results
have been extracted from the annual report of the company for the year ending June 2017. To
critically analyse the company’s financial position a comparative study of the financials of
last two years i.e. 2017 and 2016 has been made in this report.
1 I.M. Pandey, Financial Management (India: Vikas Publishing House, 2015), 921
2 C, A., Lee, J, C. Lee, Cheng, F., and Lee. Financial Analysis, Planning & Forecasting: Theory and Application.
(Singapore: World Scientific, 2009), 1101.
Paraphrase This Document
Need a fresh take? Get an instant paraphrase of this document with our AI Paraphraser
Running Head: Financial Statement Analysis 4
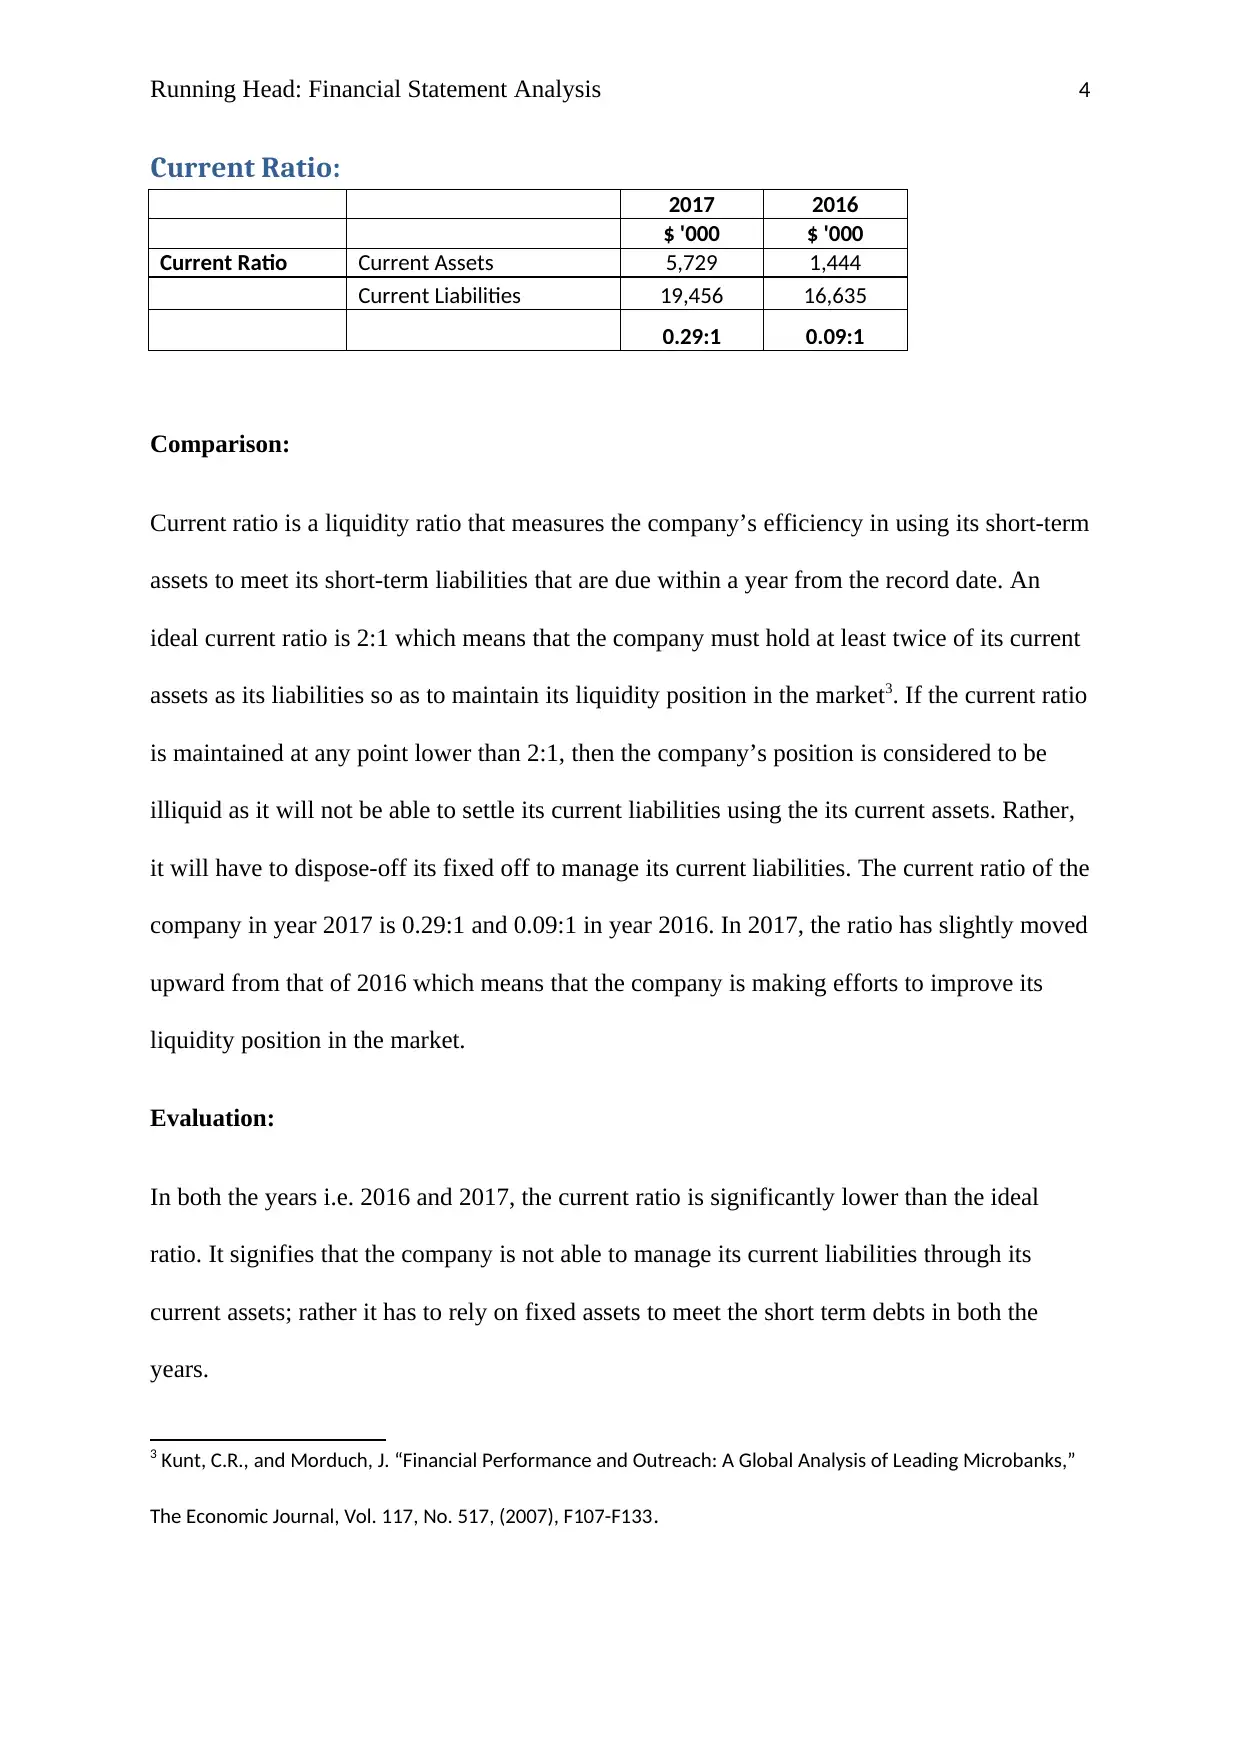
Current Ratio:
2017 2016
$ '000 $ '000
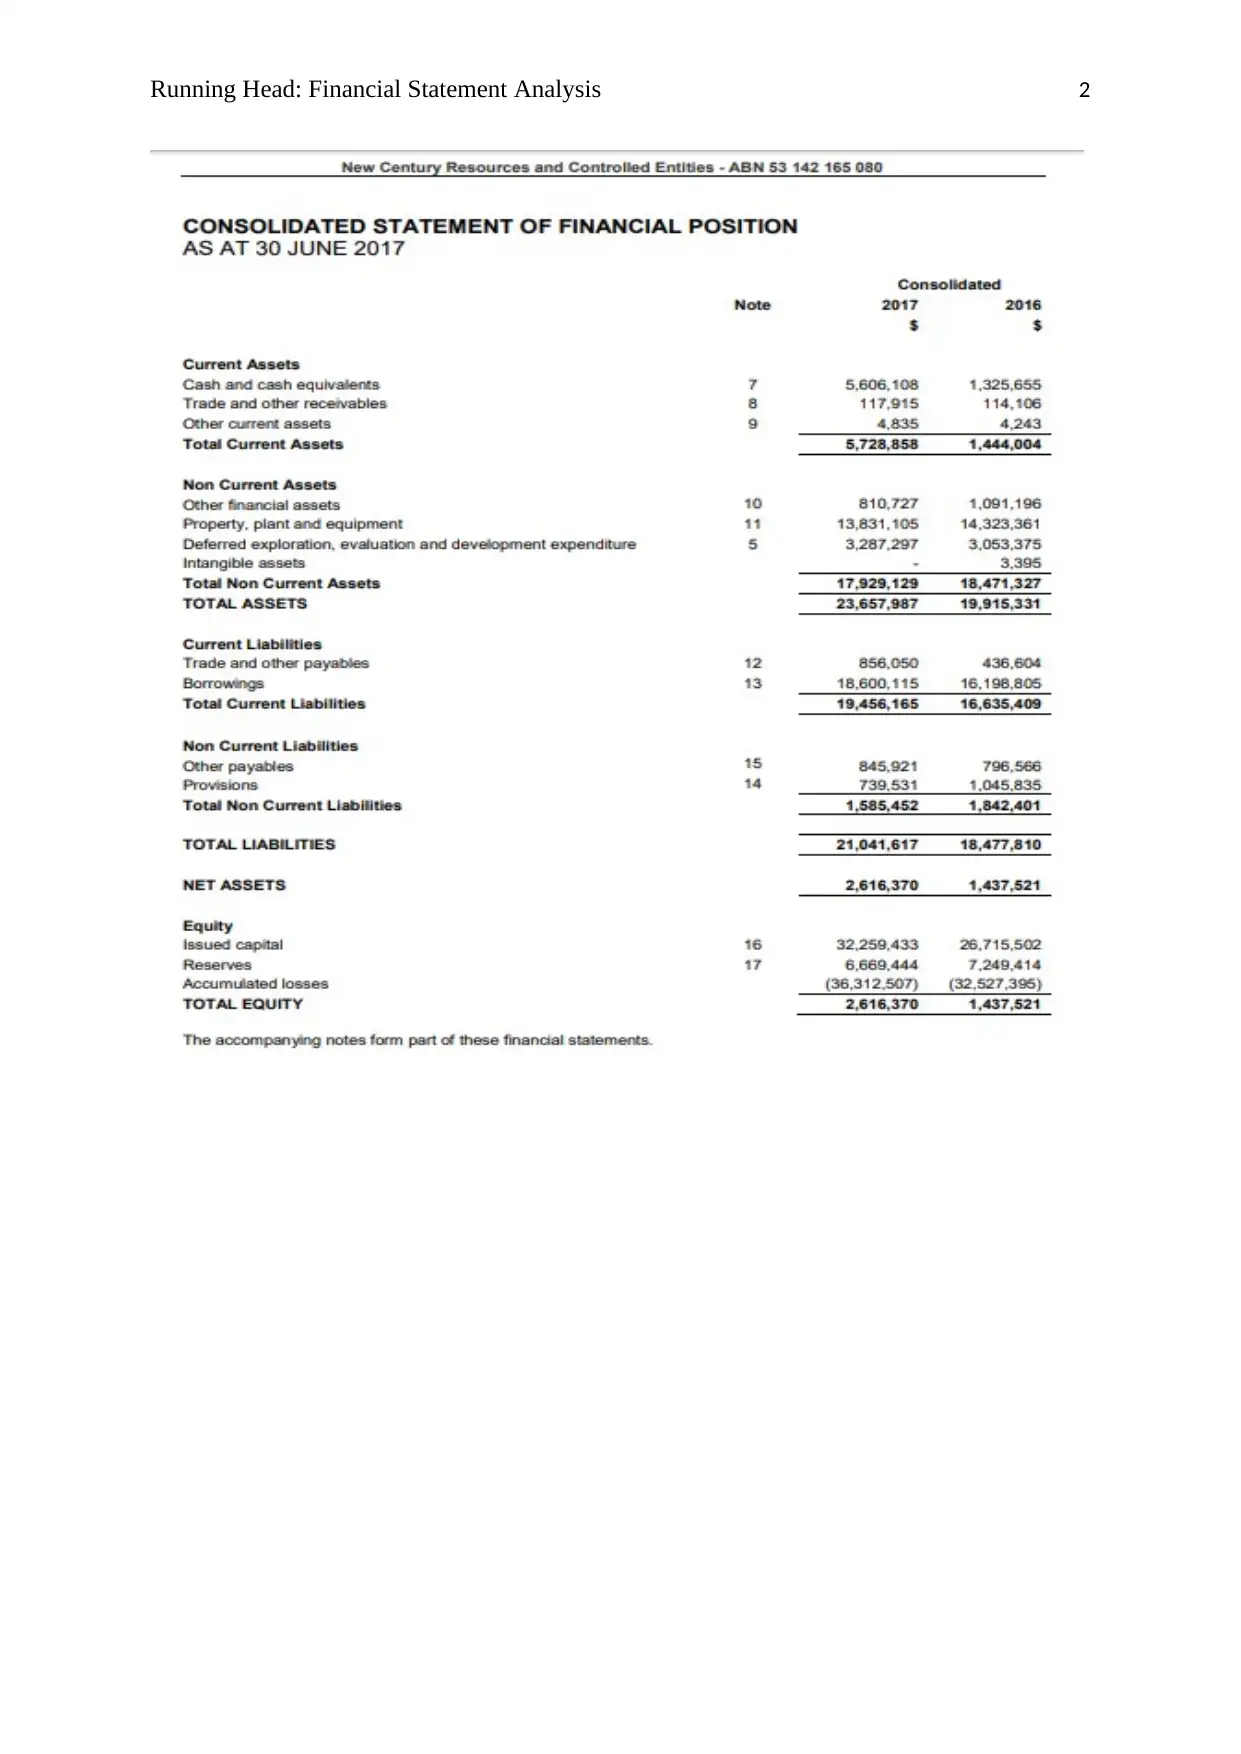
Current Ratio Current Assets 5,729 1,444
Current Liabilities 19,456 16,635
0.29:1 0.09:1
Comparison:
Current ratio is a liquidity ratio that measures the company’s efficiency in using its short-term
assets to meet its short-term liabilities that are due within a year from the record date. An
ideal current ratio is 2:1 which means that the company must hold at least twice of its current
assets as its liabilities so as to maintain its liquidity position in the market3. If the current ratio
is maintained at any point lower than 2:1, then the company’s position is considered to be
illiquid as it will not be able to settle its current liabilities using the its current assets. Rather,
it will have to dispose-off its fixed off to manage its current liabilities. The current ratio of the
company in year 2017 is 0.29:1 and 0.09:1 in year 2016. In 2017, the ratio has slightly moved
upward from that of 2016 which means that the company is making efforts to improve its
liquidity position in the market.
Evaluation:
In both the years i.e. 2016 and 2017, the current ratio is significantly lower than the ideal
ratio. It signifies that the company is not able to manage its current liabilities through its
current assets; rather it has to rely on fixed assets to meet the short term debts in both the
years.
3 Kunt, C.R., and Morduch, J. “Financial Performance and Outreach: A Global Analysis of Leading Microbanks,”
The Economic Journal, Vol. 117, No. 517, (2007), F107-F133.
Current Ratio:
2017 2016
$ '000 $ '000
Current Ratio Current Assets 5,729 1,444
Current Liabilities 19,456 16,635
0.29:1 0.09:1
Comparison:
Current ratio is a liquidity ratio that measures the company’s efficiency in using its short-term
assets to meet its short-term liabilities that are due within a year from the record date. An
ideal current ratio is 2:1 which means that the company must hold at least twice of its current
assets as its liabilities so as to maintain its liquidity position in the market3. If the current ratio
is maintained at any point lower than 2:1, then the company’s position is considered to be
illiquid as it will not be able to settle its current liabilities using the its current assets. Rather,
it will have to dispose-off its fixed off to manage its current liabilities. The current ratio of the
company in year 2017 is 0.29:1 and 0.09:1 in year 2016. In 2017, the ratio has slightly moved
upward from that of 2016 which means that the company is making efforts to improve its
liquidity position in the market.
Evaluation:
In both the years i.e. 2016 and 2017, the current ratio is significantly lower than the ideal
ratio. It signifies that the company is not able to manage its current liabilities through its
current assets; rather it has to rely on fixed assets to meet the short term debts in both the
years.
3 Kunt, C.R., and Morduch, J. “Financial Performance and Outreach: A Global Analysis of Leading Microbanks,”
The Economic Journal, Vol. 117, No. 517, (2007), F107-F133.
Running Head: Financial Statement Analysis 5
Recommendation:
To improve the liquidity position, the company must invest more in current assets to as to
square-off its liabilities that are due within one year from the date of transaction. It must al-
least hold doubles of its current assets in relation to current liabilities so that it does not have
to dispose-off its fixed assets for the purpose of current liabilities settlement4.
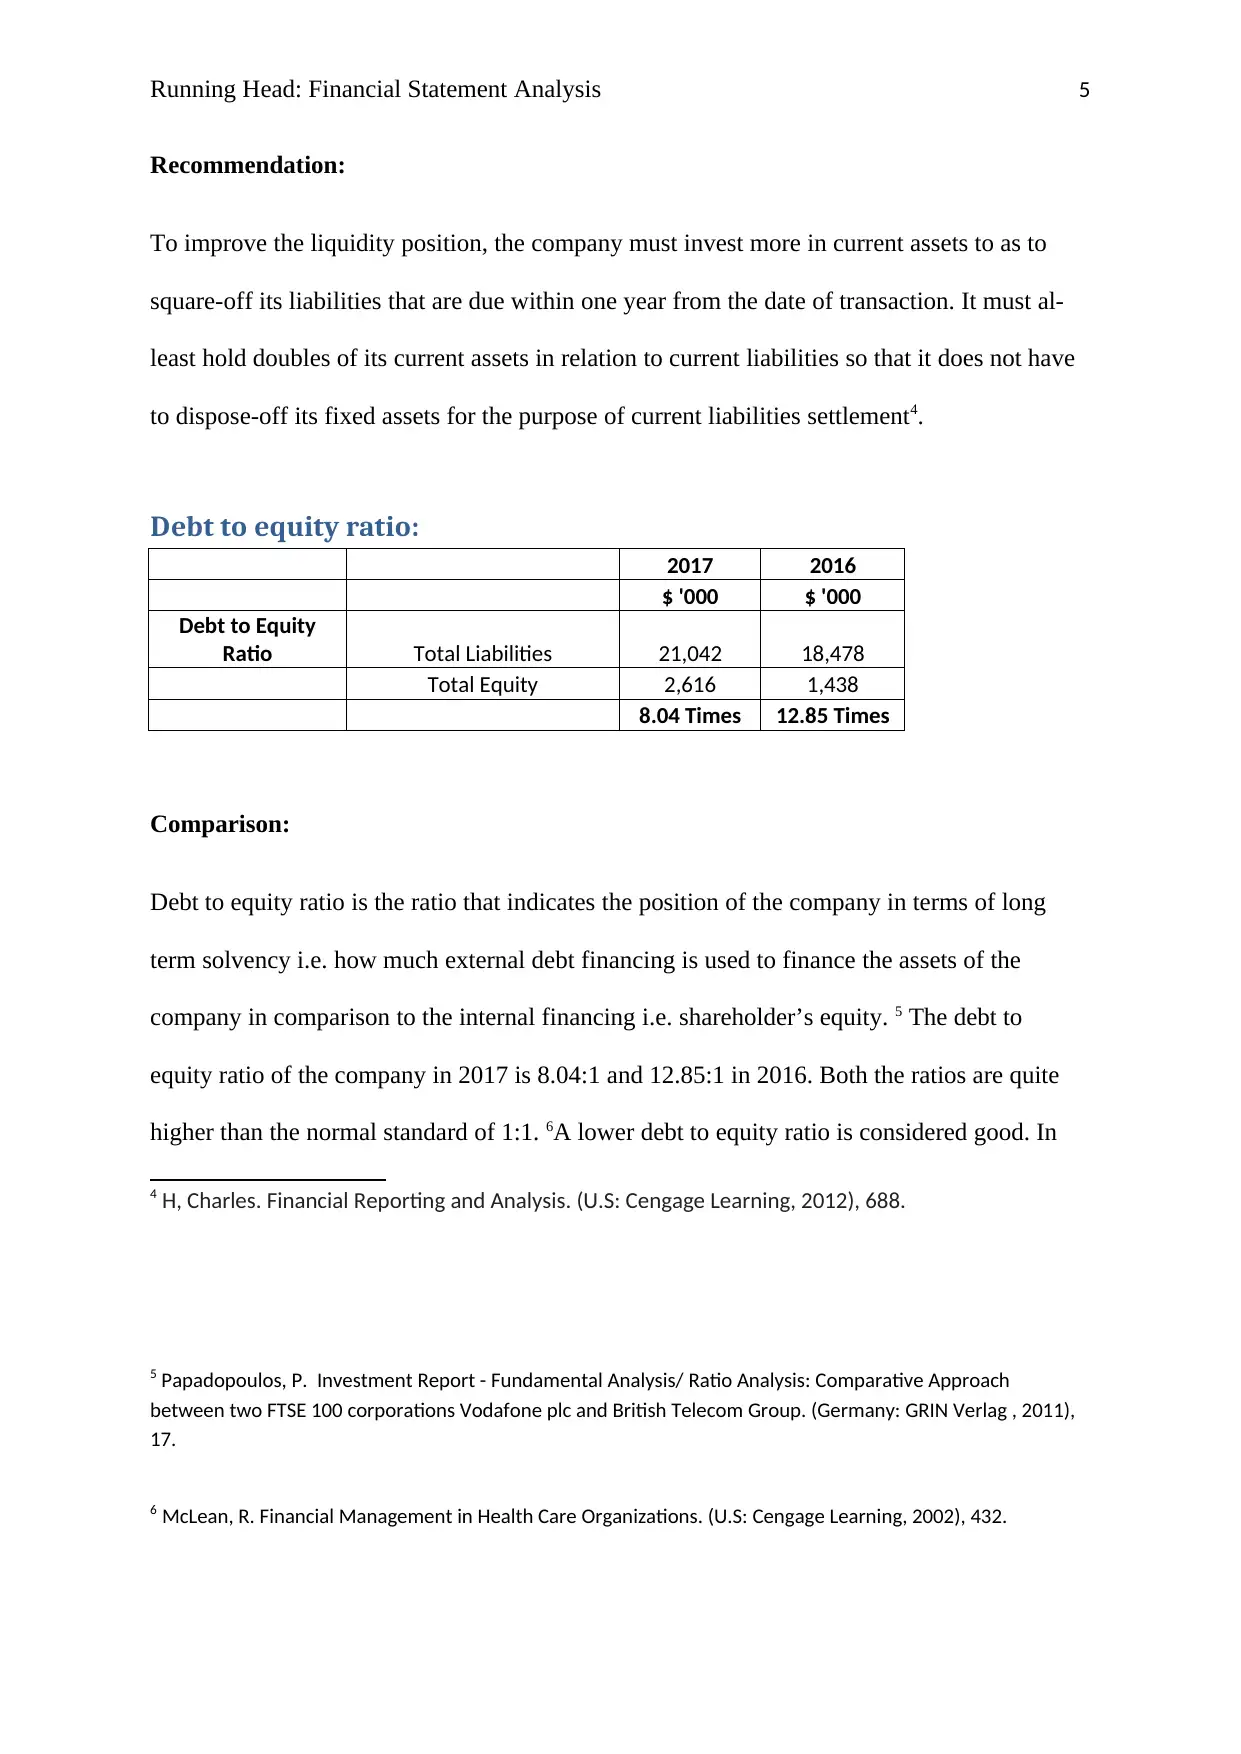
Debt to equity ratio:
2017 2016
$ '000 $ '000
Debt to Equity
Ratio Total Liabilities 21,042 18,478
Total Equity 2,616 1,438
8.04 Times 12.85 Times
Comparison:
Debt to equity ratio is the ratio that indicates the position of the company in terms of long
term solvency i.e. how much external debt financing is used to finance the assets of the
company in comparison to the internal financing i.e. shareholder’s equity. 5 The debt to
equity ratio of the company in 2017 is 8.04:1 and 12.85:1 in 2016. Both the ratios are quite
higher than the normal standard of 1:1. 6A lower debt to equity ratio is considered good. In
4 H, Charles. Financial Reporting and Analysis. (U.S: Cengage Learning, 2012), 688.
5 Papadopoulos, P. Investment Report - Fundamental Analysis/ Ratio Analysis: Comparative Approach
between two FTSE 100 corporations Vodafone plc and British Telecom Group. (Germany: GRIN Verlag , 2011),
17.
6 McLean, R. Financial Management in Health Care Organizations. (U.S: Cengage Learning, 2002), 432.
Recommendation:
To improve the liquidity position, the company must invest more in current assets to as to
square-off its liabilities that are due within one year from the date of transaction. It must al-
least hold doubles of its current assets in relation to current liabilities so that it does not have
to dispose-off its fixed assets for the purpose of current liabilities settlement4.
Debt to equity ratio:
2017 2016
$ '000 $ '000
Debt to Equity
Ratio Total Liabilities 21,042 18,478
Total Equity 2,616 1,438
8.04 Times 12.85 Times
Comparison:
Debt to equity ratio is the ratio that indicates the position of the company in terms of long
term solvency i.e. how much external debt financing is used to finance the assets of the
company in comparison to the internal financing i.e. shareholder’s equity. 5 The debt to
equity ratio of the company in 2017 is 8.04:1 and 12.85:1 in 2016. Both the ratios are quite
higher than the normal standard of 1:1. 6A lower debt to equity ratio is considered good. In
4 H, Charles. Financial Reporting and Analysis. (U.S: Cengage Learning, 2012), 688.
5 Papadopoulos, P. Investment Report - Fundamental Analysis/ Ratio Analysis: Comparative Approach
between two FTSE 100 corporations Vodafone plc and British Telecom Group. (Germany: GRIN Verlag , 2011),
17.
6 McLean, R. Financial Management in Health Care Organizations. (U.S: Cengage Learning, 2002), 432.
⊘ This is a preview!⊘
Do you want full access?
Subscribe today to unlock all pages.
Trusted by 1+ million students worldwide
Running Head: Financial Statement Analysis 6
2017, the ratio has declined in comparison to year 2016 therefore, the solvency position of
company can be said to be improved in year 2017 in comparison to 2016.
Evaluation:
The debt to equity ratio of 8.04: 1 implies that the company’s debts are 8 times higher than
the value of its stockholder equity. Higher debt to equity ratio of the present company depicts
that company has higher financial leverage it has raised funds that required to finance the
asset, through external debts and therefore it has high interest payment obligations7. The
decline in the ratio indicates that the firm is striving to finance its assets using more of its
internal sources of finance i.e. equity than the external sources such as issuance of convertible
notes. The potential investors generally do not invest in the companies whose debt equity
ratio is high.
Recommendation:
To take the long term solvency position of the company, it must manage to reduce its debt to
equity ratio by issuing more of equity stock to raise funds internally and also it must settle the
payments of its external providers of finance i.e. the convertible note holders. It must raise
the required funds through the issue of equity shares and square-off the payment due to the
note holders through the utilisation of funds raised through equity issue. 8
7 H, Alexander. Informed Traders as Liquidity Providers: Evidence from the German Equity Market. (Germany: Springer Science & Business
Media, 2007), 179.
8 M.E., Rao. Management Accounting. (India: New Age International, 2007), 588.
Paraphrase This Document
Need a fresh take? Get an instant paraphrase of this document with our AI Paraphraser
Running Head: Financial Statement Analysis 7
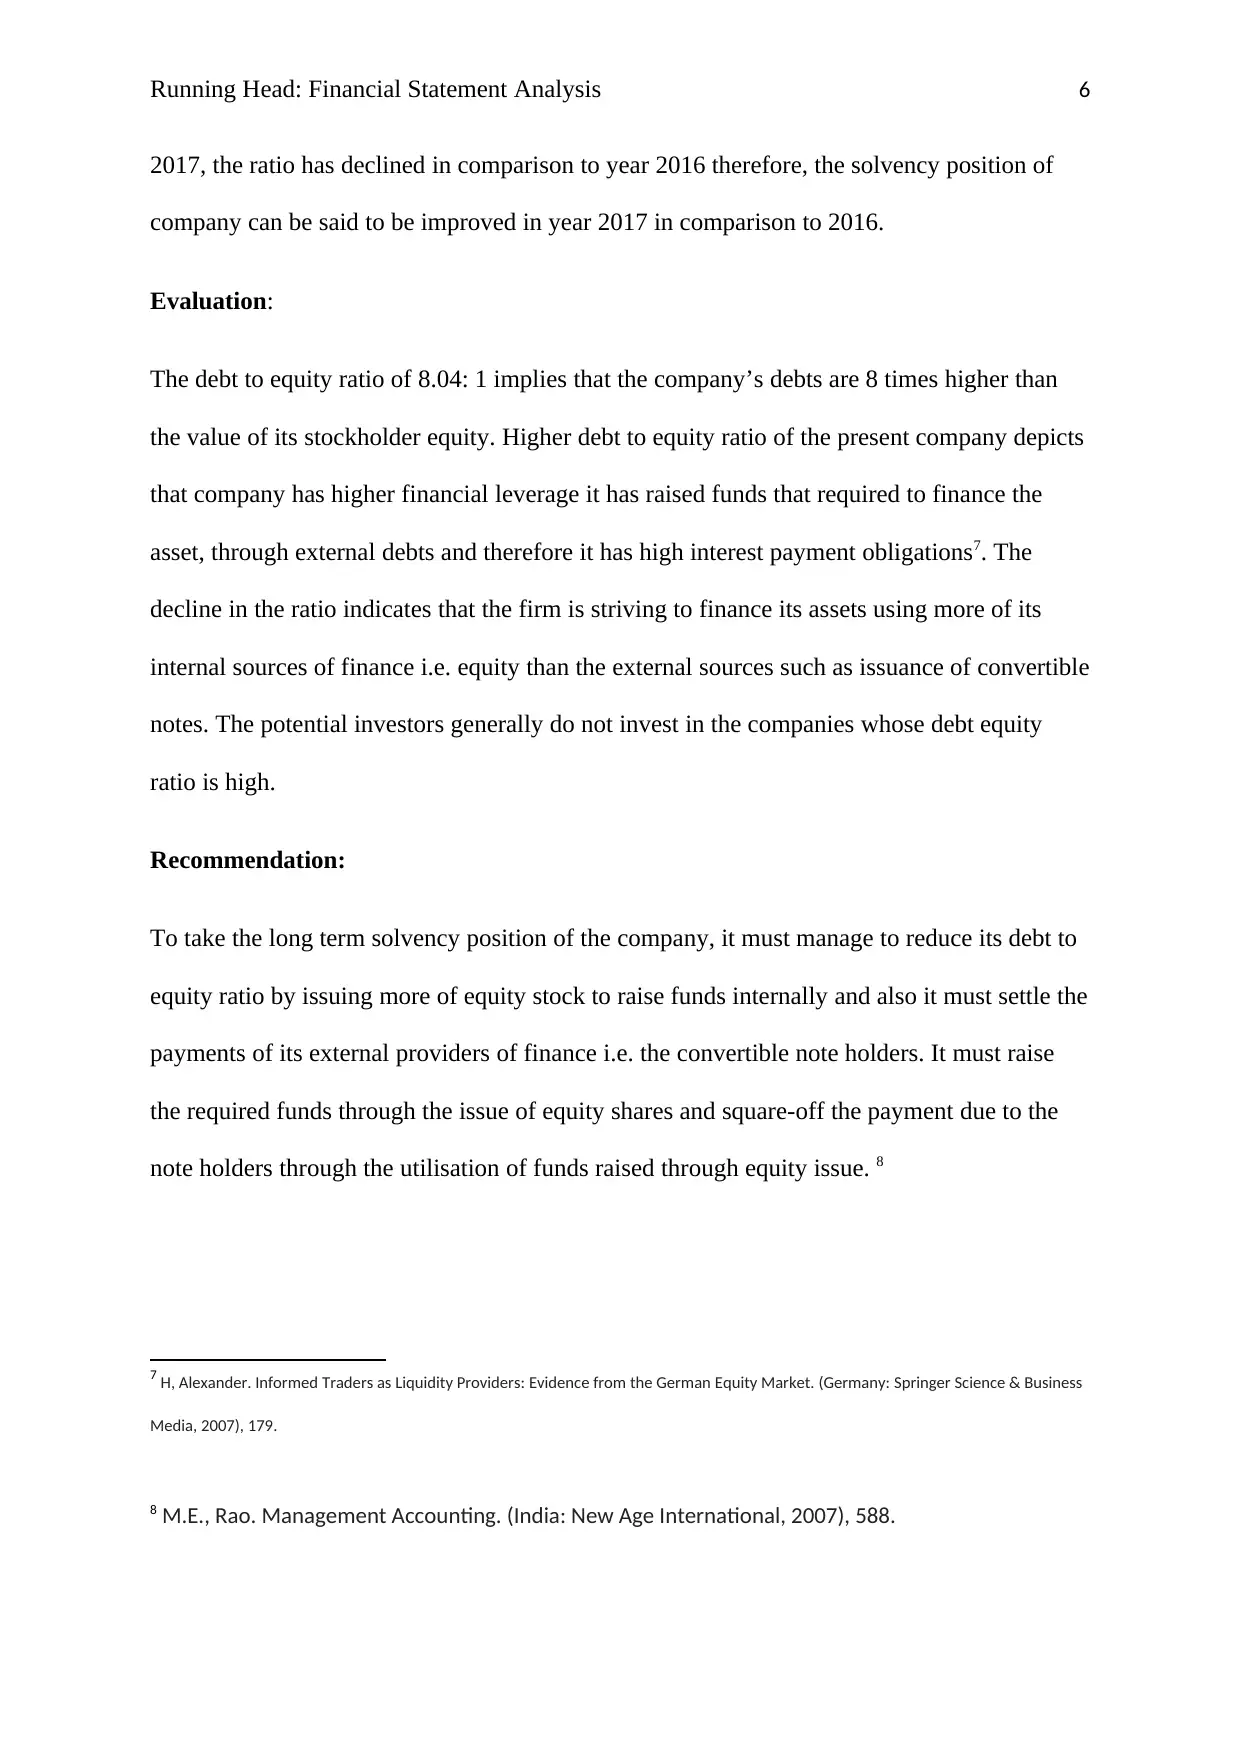
Return on owner’s equity ratio:
2017 2016
$ '000 $ '000
Return on Owner's
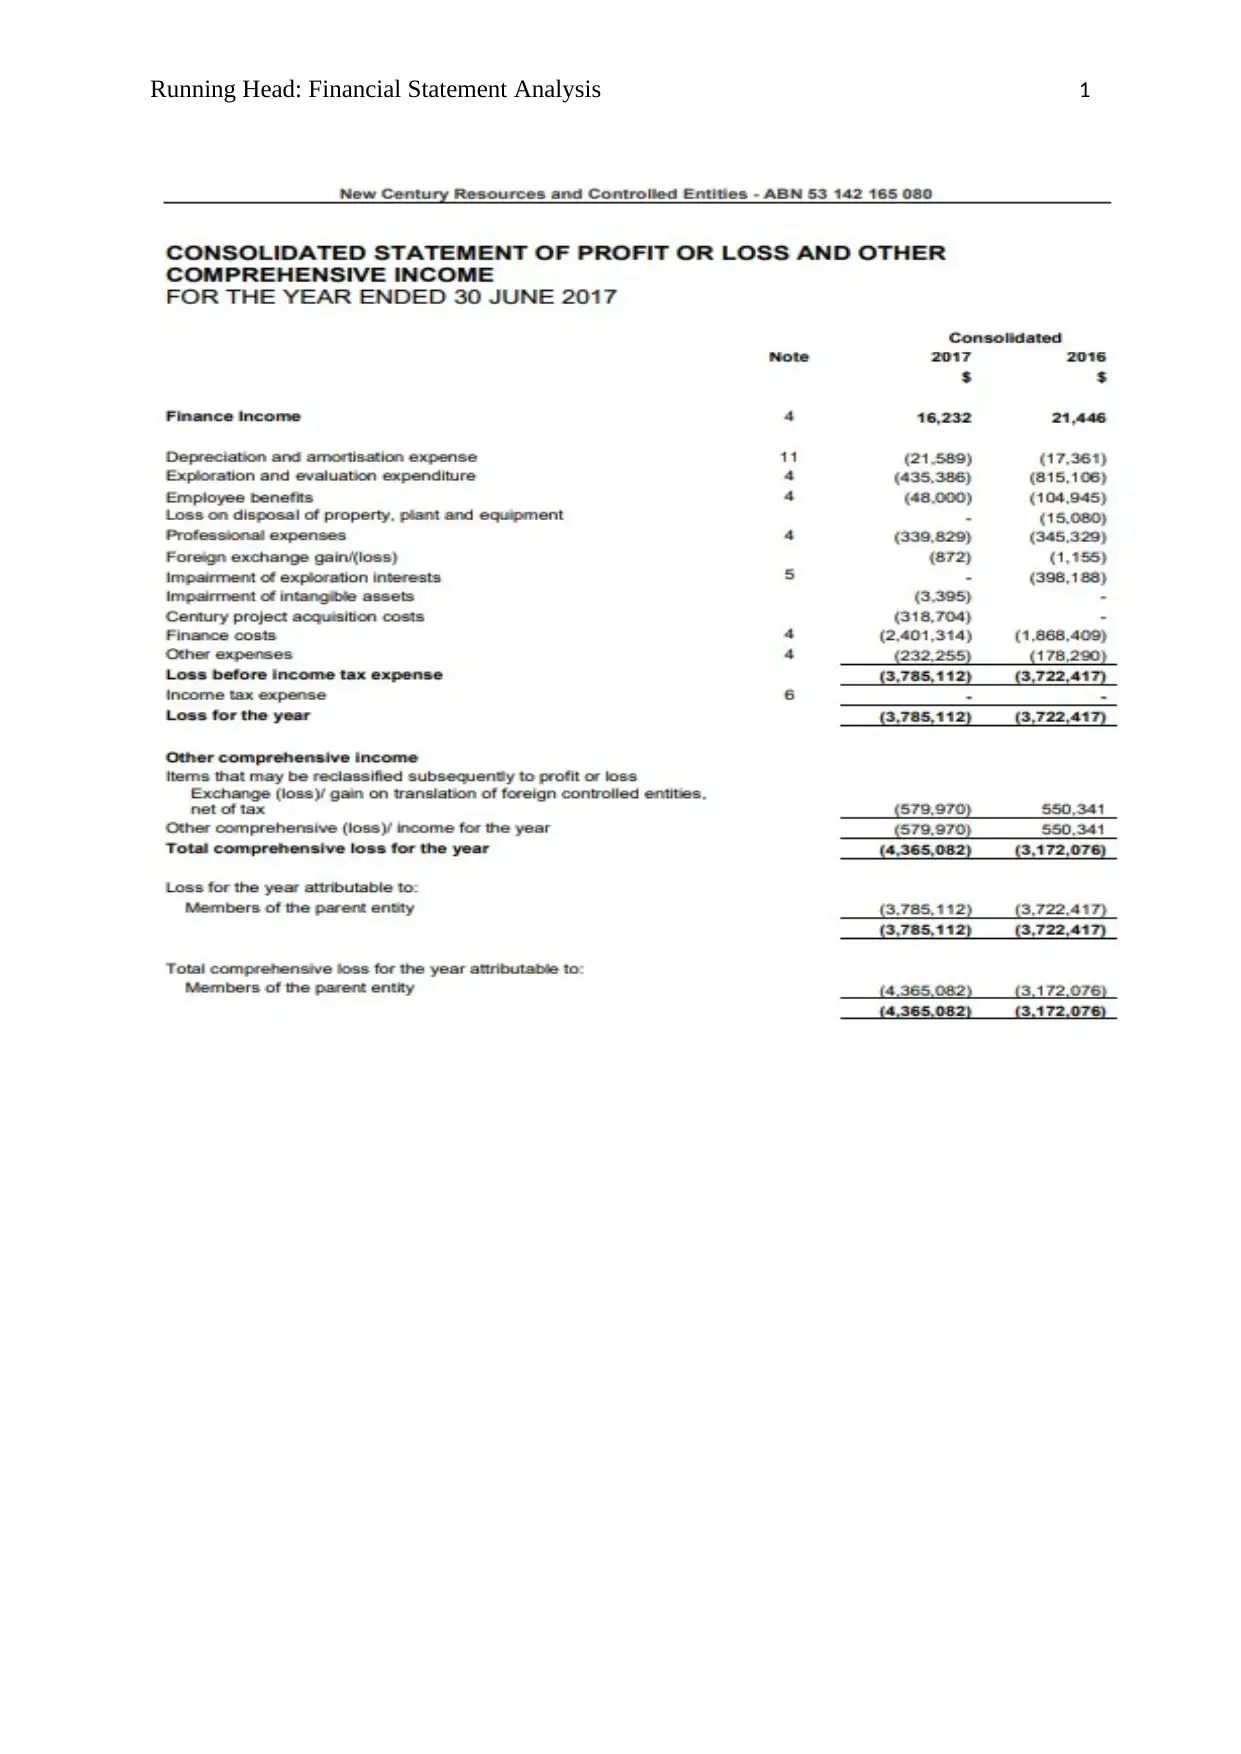
Equity Ratio Net Income -3,785 -3,722
Owner's Equity 2,027 1,816
-187% -205%
Comparison:
Return on owner’s equity ratio is the ratio that determines the profitability position of the
company. It measures the percentage of returns generated by the company by utilising the
funds that the shareholders of the company have invested in it.9 Higher return on equity ratio
is favourable as it shows higher return generations by the company for its investors. In 2017,
the ROE is negative 187% (-187%) and in 2016 it was negative 205% (-205%). Though the
negative percentage shows that company has failed to generate returns for its shareholders
but in 2017 it can be observed that the company has made efforts to improve its position in
comparison to 2016.
Evaluation:
As the ROE of the company is highly negative in both the concerned years it indicates that
company has severely failed to utilise the funds of its shareholders to generate adequate
amount of returns as desired and expected by such shareholders in consideration of such
investments made by them in the company. Negative ROE indicates that the company is
operating in high losses and hence it is not able to attract potential investors towards it10.
9 Tracy, A. Ratio Analysis Fundamentals: How 17 Financial Ratios Can Allow You to Analyse Any Business on the
Planet (Ratio Analysis.net, 2012), 82.
10 Yahoo Finance. (2017). “New Century Resources Limited (NCZ.AX),” [Online]. Available:
https://finance.yahoo.com/chart/NCZ.AX/#eyJpbnRlcnZhbCI6ImRheSIsInBlcmlvZGljaXR5IjoxLCJ0aW1lVW5pdCI
6bnVsbCwiY2FuZGxlV2lkdGgiOjgsInZvbHVtZVVuZGVybGF5Ijp0cnVlLCJhZGoiOnRydWUsImNyb3NzaGFpciI6dHJ1
ZSwiY2hhcnRUeXBlIjoibGluZSIsImV4dGVuZGVkIjpmYWxzZSwibWFya2V0U2Vzc2lvbnMiOnt9LCJhZ2dyZWdhdGl
vblR5cGUiOiJvaGxjIiwiY2hhcnRTY2FsZSI6ImxpbmVhciIsInBhbmVscyI6eyJjaGFydCI6eyJwZXJjZW50IjoxLCJkaXNw
bGF5IjoiTkNaLkFYIiwiY2hhcnROYW1lIjoiY2hhcnQiLCJ0b3AiOjB9fSwic2V0U3BhbiI6e30sImxpbmVXaWR0aCI6Mi
wic3RyaXBlZEJhY2tncm91ZCI6dHJ1ZSwiZXZlbnRzIjp0cnVlLCJjb2xvciI6IiMwMDgxZjIiLCJzeW1ib2xzIjpbeyJzeW1ib
Return on owner’s equity ratio:
2017 2016
$ '000 $ '000
Return on Owner's
Equity Ratio Net Income -3,785 -3,722
Owner's Equity 2,027 1,816
-187% -205%
Comparison:
Return on owner’s equity ratio is the ratio that determines the profitability position of the
company. It measures the percentage of returns generated by the company by utilising the
funds that the shareholders of the company have invested in it.9 Higher return on equity ratio
is favourable as it shows higher return generations by the company for its investors. In 2017,
the ROE is negative 187% (-187%) and in 2016 it was negative 205% (-205%). Though the
negative percentage shows that company has failed to generate returns for its shareholders
but in 2017 it can be observed that the company has made efforts to improve its position in
comparison to 2016.
Evaluation:
As the ROE of the company is highly negative in both the concerned years it indicates that
company has severely failed to utilise the funds of its shareholders to generate adequate
amount of returns as desired and expected by such shareholders in consideration of such
investments made by them in the company. Negative ROE indicates that the company is
operating in high losses and hence it is not able to attract potential investors towards it10.
9 Tracy, A. Ratio Analysis Fundamentals: How 17 Financial Ratios Can Allow You to Analyse Any Business on the
Planet (Ratio Analysis.net, 2012), 82.
10 Yahoo Finance. (2017). “New Century Resources Limited (NCZ.AX),” [Online]. Available:
https://finance.yahoo.com/chart/NCZ.AX/#eyJpbnRlcnZhbCI6ImRheSIsInBlcmlvZGljaXR5IjoxLCJ0aW1lVW5pdCI
6bnVsbCwiY2FuZGxlV2lkdGgiOjgsInZvbHVtZVVuZGVybGF5Ijp0cnVlLCJhZGoiOnRydWUsImNyb3NzaGFpciI6dHJ1
ZSwiY2hhcnRUeXBlIjoibGluZSIsImV4dGVuZGVkIjpmYWxzZSwibWFya2V0U2Vzc2lvbnMiOnt9LCJhZ2dyZWdhdGl
vblR5cGUiOiJvaGxjIiwiY2hhcnRTY2FsZSI6ImxpbmVhciIsInBhbmVscyI6eyJjaGFydCI6eyJwZXJjZW50IjoxLCJkaXNw
bGF5IjoiTkNaLkFYIiwiY2hhcnROYW1lIjoiY2hhcnQiLCJ0b3AiOjB9fSwic2V0U3BhbiI6e30sImxpbmVXaWR0aCI6Mi
wic3RyaXBlZEJhY2tncm91ZCI6dHJ1ZSwiZXZlbnRzIjp0cnVlLCJjb2xvciI6IiMwMDgxZjIiLCJzeW1ib2xzIjpbeyJzeW1ib
Running Head: Financial Statement Analysis 8
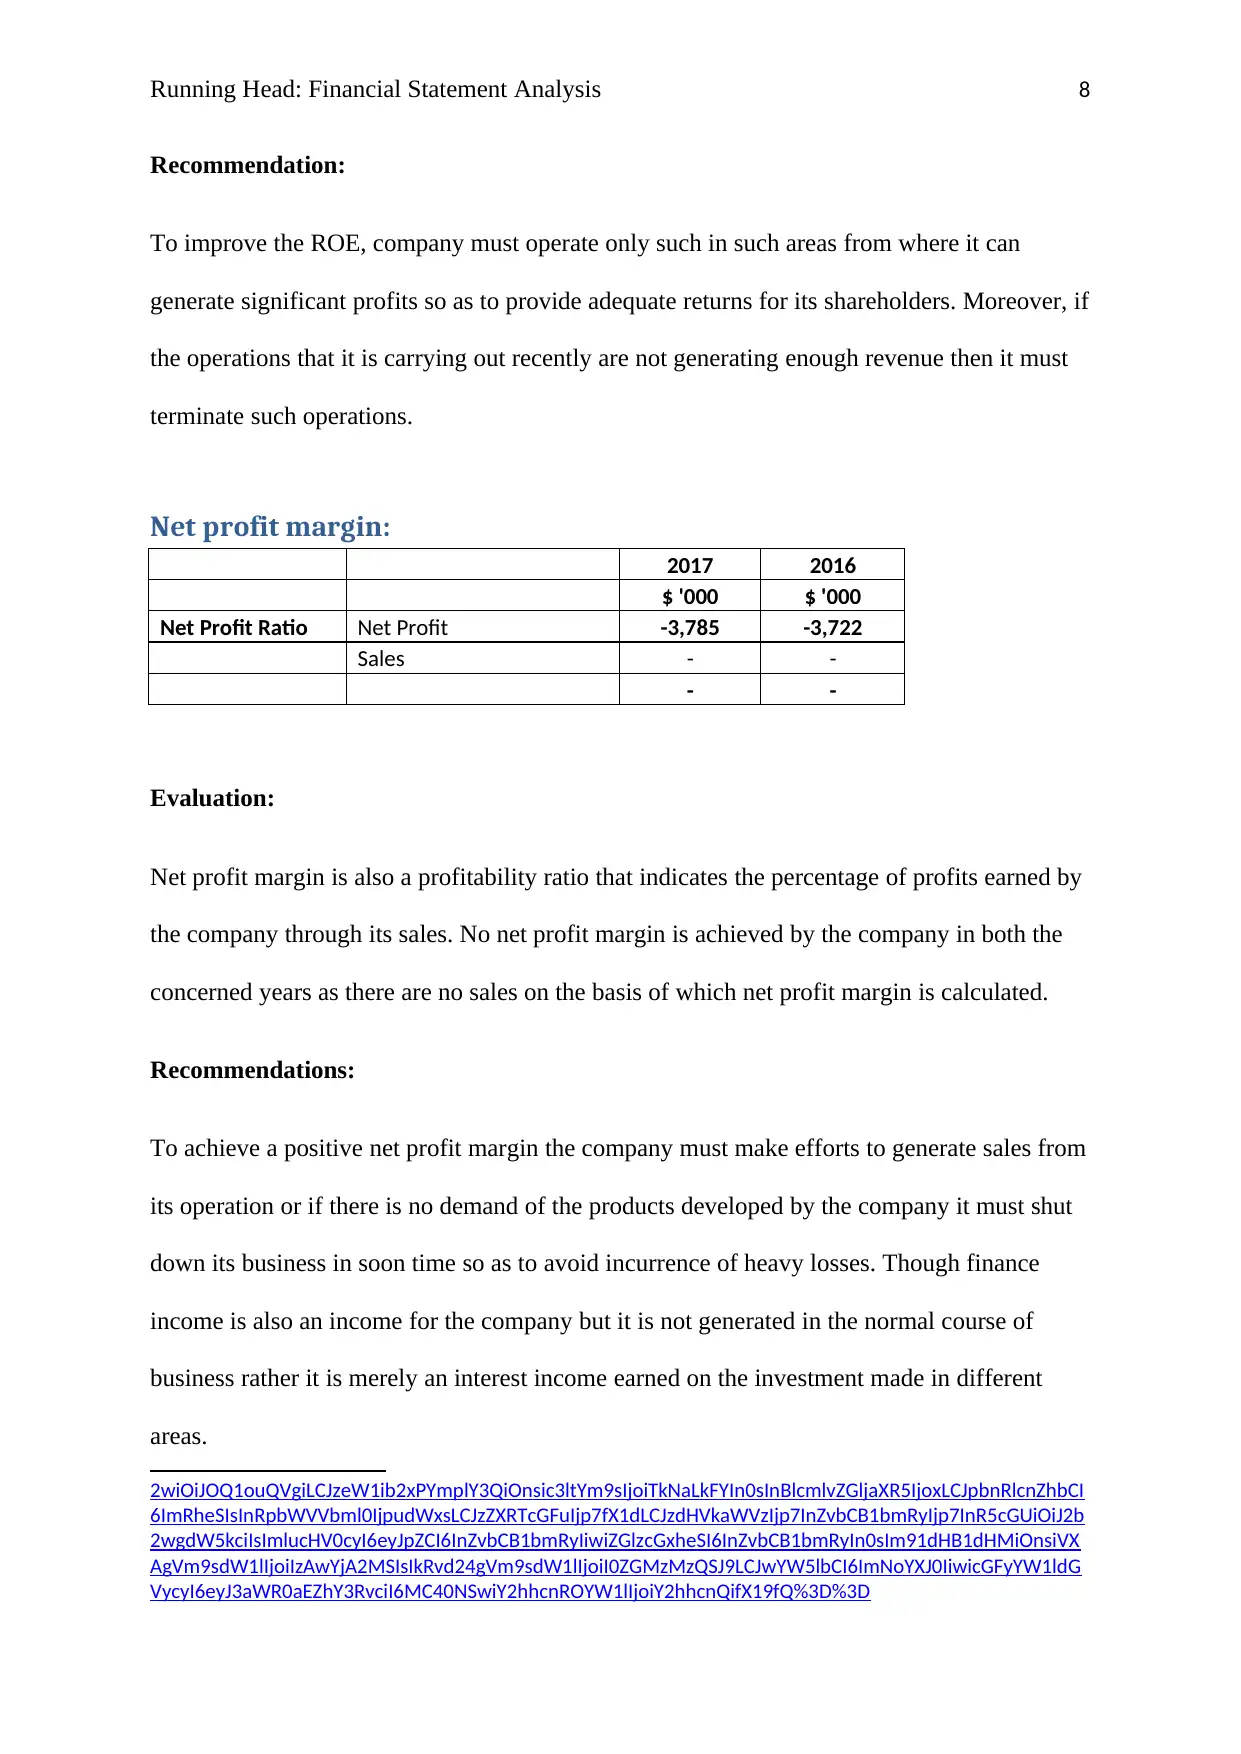
Recommendation:
To improve the ROE, company must operate only such in such areas from where it can
generate significant profits so as to provide adequate returns for its shareholders. Moreover, if
the operations that it is carrying out recently are not generating enough revenue then it must
terminate such operations.
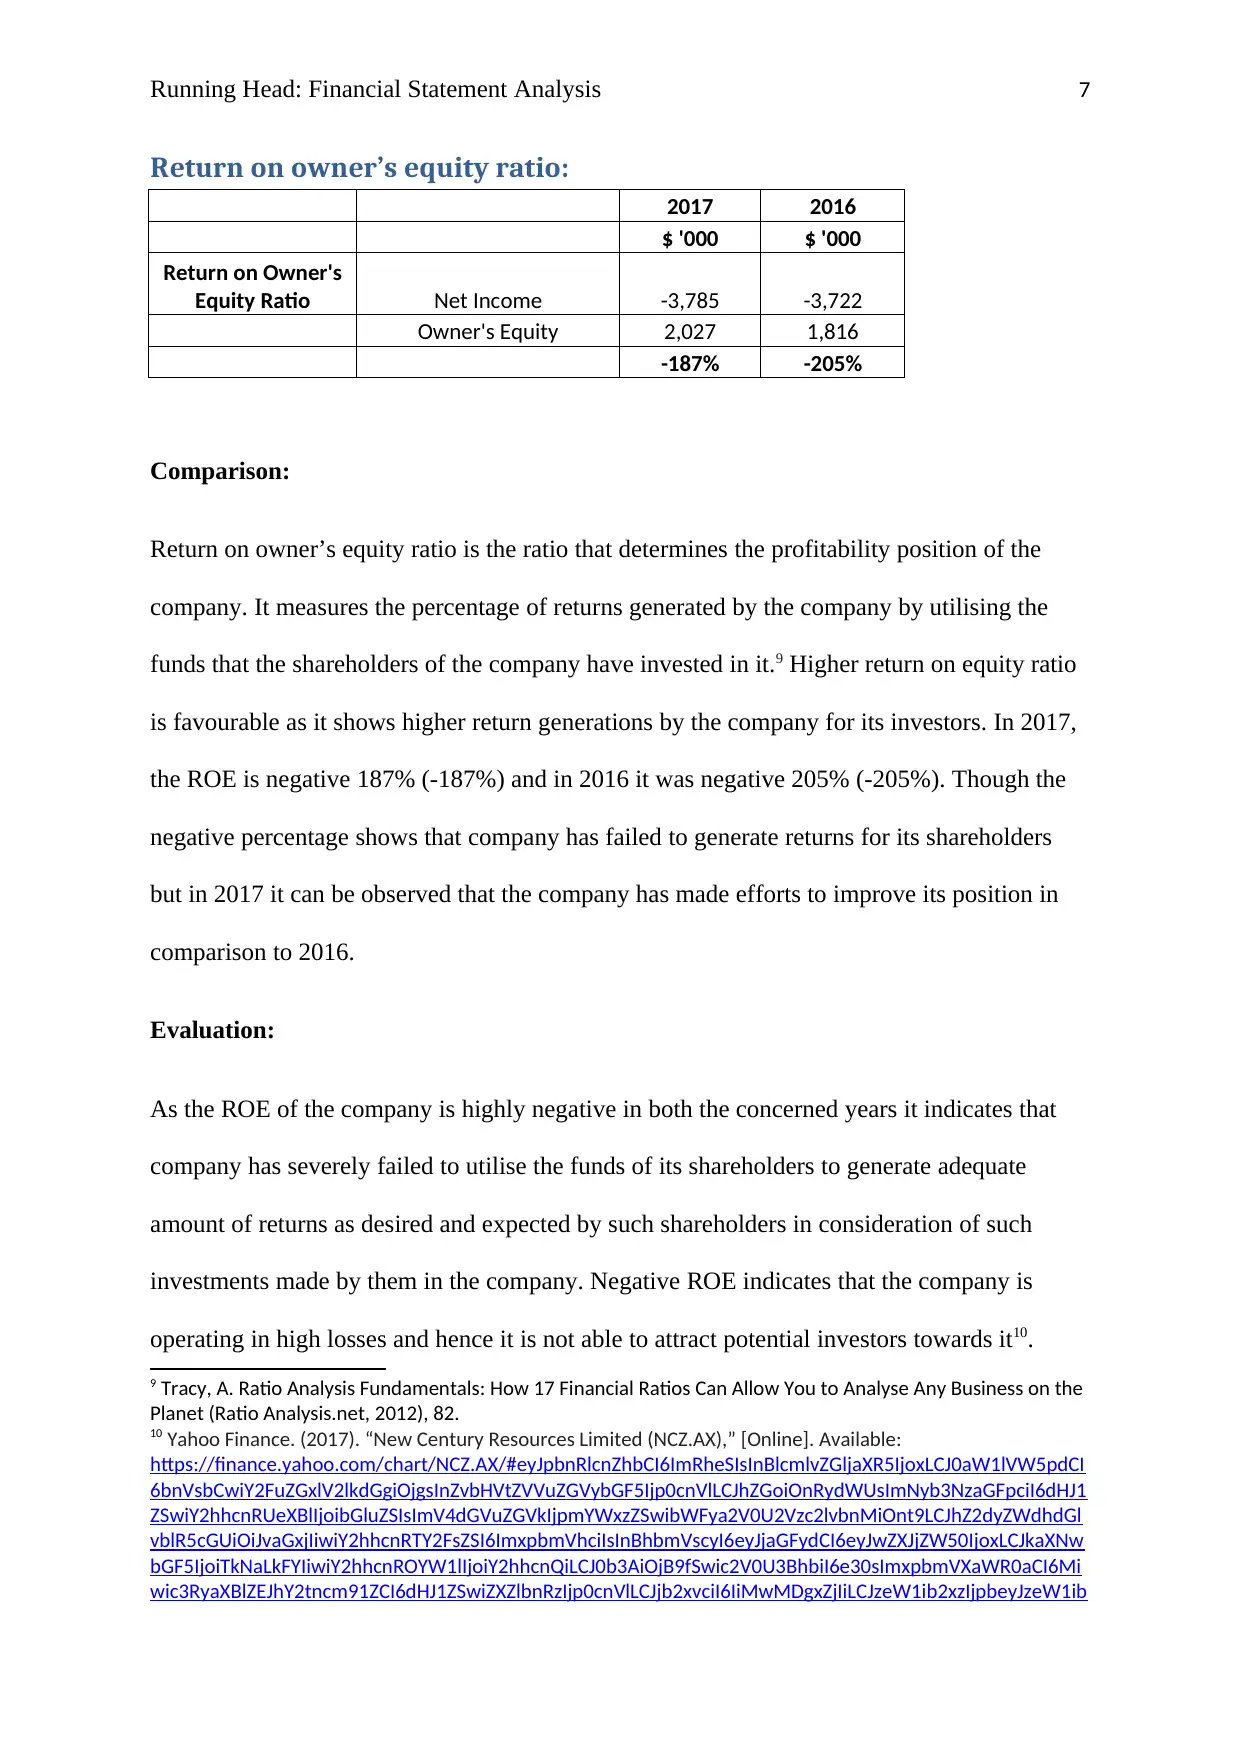
Net profit margin:
2017 2016
$ '000 $ '000
Net Profit Ratio Net Profit -3,785 -3,722
Sales - -
- -
Evaluation:
Net profit margin is also a profitability ratio that indicates the percentage of profits earned by
the company through its sales. No net profit margin is achieved by the company in both the
concerned years as there are no sales on the basis of which net profit margin is calculated.
Recommendations:
To achieve a positive net profit margin the company must make efforts to generate sales from
its operation or if there is no demand of the products developed by the company it must shut
down its business in soon time so as to avoid incurrence of heavy losses. Though finance
income is also an income for the company but it is not generated in the normal course of
business rather it is merely an interest income earned on the investment made in different
areas.
2wiOiJOQ1ouQVgiLCJzeW1ib2xPYmplY3QiOnsic3ltYm9sIjoiTkNaLkFYIn0sInBlcmlvZGljaXR5IjoxLCJpbnRlcnZhbCI
6ImRheSIsInRpbWVVbml0IjpudWxsLCJzZXRTcGFuIjp7fX1dLCJzdHVkaWVzIjp7InZvbCB1bmRyIjp7InR5cGUiOiJ2b
2wgdW5kciIsImlucHV0cyI6eyJpZCI6InZvbCB1bmRyIiwiZGlzcGxheSI6InZvbCB1bmRyIn0sIm91dHB1dHMiOnsiVX
AgVm9sdW1lIjoiIzAwYjA2MSIsIkRvd24gVm9sdW1lIjoiI0ZGMzMzQSJ9LCJwYW5lbCI6ImNoYXJ0IiwicGFyYW1ldG
VycyI6eyJ3aWR0aEZhY3RvciI6MC40NSwiY2hhcnROYW1lIjoiY2hhcnQifX19fQ%3D%3D
Recommendation:
To improve the ROE, company must operate only such in such areas from where it can
generate significant profits so as to provide adequate returns for its shareholders. Moreover, if
the operations that it is carrying out recently are not generating enough revenue then it must
terminate such operations.
Net profit margin:
2017 2016
$ '000 $ '000
Net Profit Ratio Net Profit -3,785 -3,722
Sales - -
- -
Evaluation:
Net profit margin is also a profitability ratio that indicates the percentage of profits earned by
the company through its sales. No net profit margin is achieved by the company in both the
concerned years as there are no sales on the basis of which net profit margin is calculated.
Recommendations:
To achieve a positive net profit margin the company must make efforts to generate sales from
its operation or if there is no demand of the products developed by the company it must shut
down its business in soon time so as to avoid incurrence of heavy losses. Though finance
income is also an income for the company but it is not generated in the normal course of
business rather it is merely an interest income earned on the investment made in different
areas.
2wiOiJOQ1ouQVgiLCJzeW1ib2xPYmplY3QiOnsic3ltYm9sIjoiTkNaLkFYIn0sInBlcmlvZGljaXR5IjoxLCJpbnRlcnZhbCI
6ImRheSIsInRpbWVVbml0IjpudWxsLCJzZXRTcGFuIjp7fX1dLCJzdHVkaWVzIjp7InZvbCB1bmRyIjp7InR5cGUiOiJ2b
2wgdW5kciIsImlucHV0cyI6eyJpZCI6InZvbCB1bmRyIiwiZGlzcGxheSI6InZvbCB1bmRyIn0sIm91dHB1dHMiOnsiVX
AgVm9sdW1lIjoiIzAwYjA2MSIsIkRvd24gVm9sdW1lIjoiI0ZGMzMzQSJ9LCJwYW5lbCI6ImNoYXJ0IiwicGFyYW1ldG
VycyI6eyJ3aWR0aEZhY3RvciI6MC40NSwiY2hhcnROYW1lIjoiY2hhcnQifX19fQ%3D%3D
⊘ This is a preview!⊘
Do you want full access?
Subscribe today to unlock all pages.
Trusted by 1+ million students worldwide
Running Head: Financial Statement Analysis 9
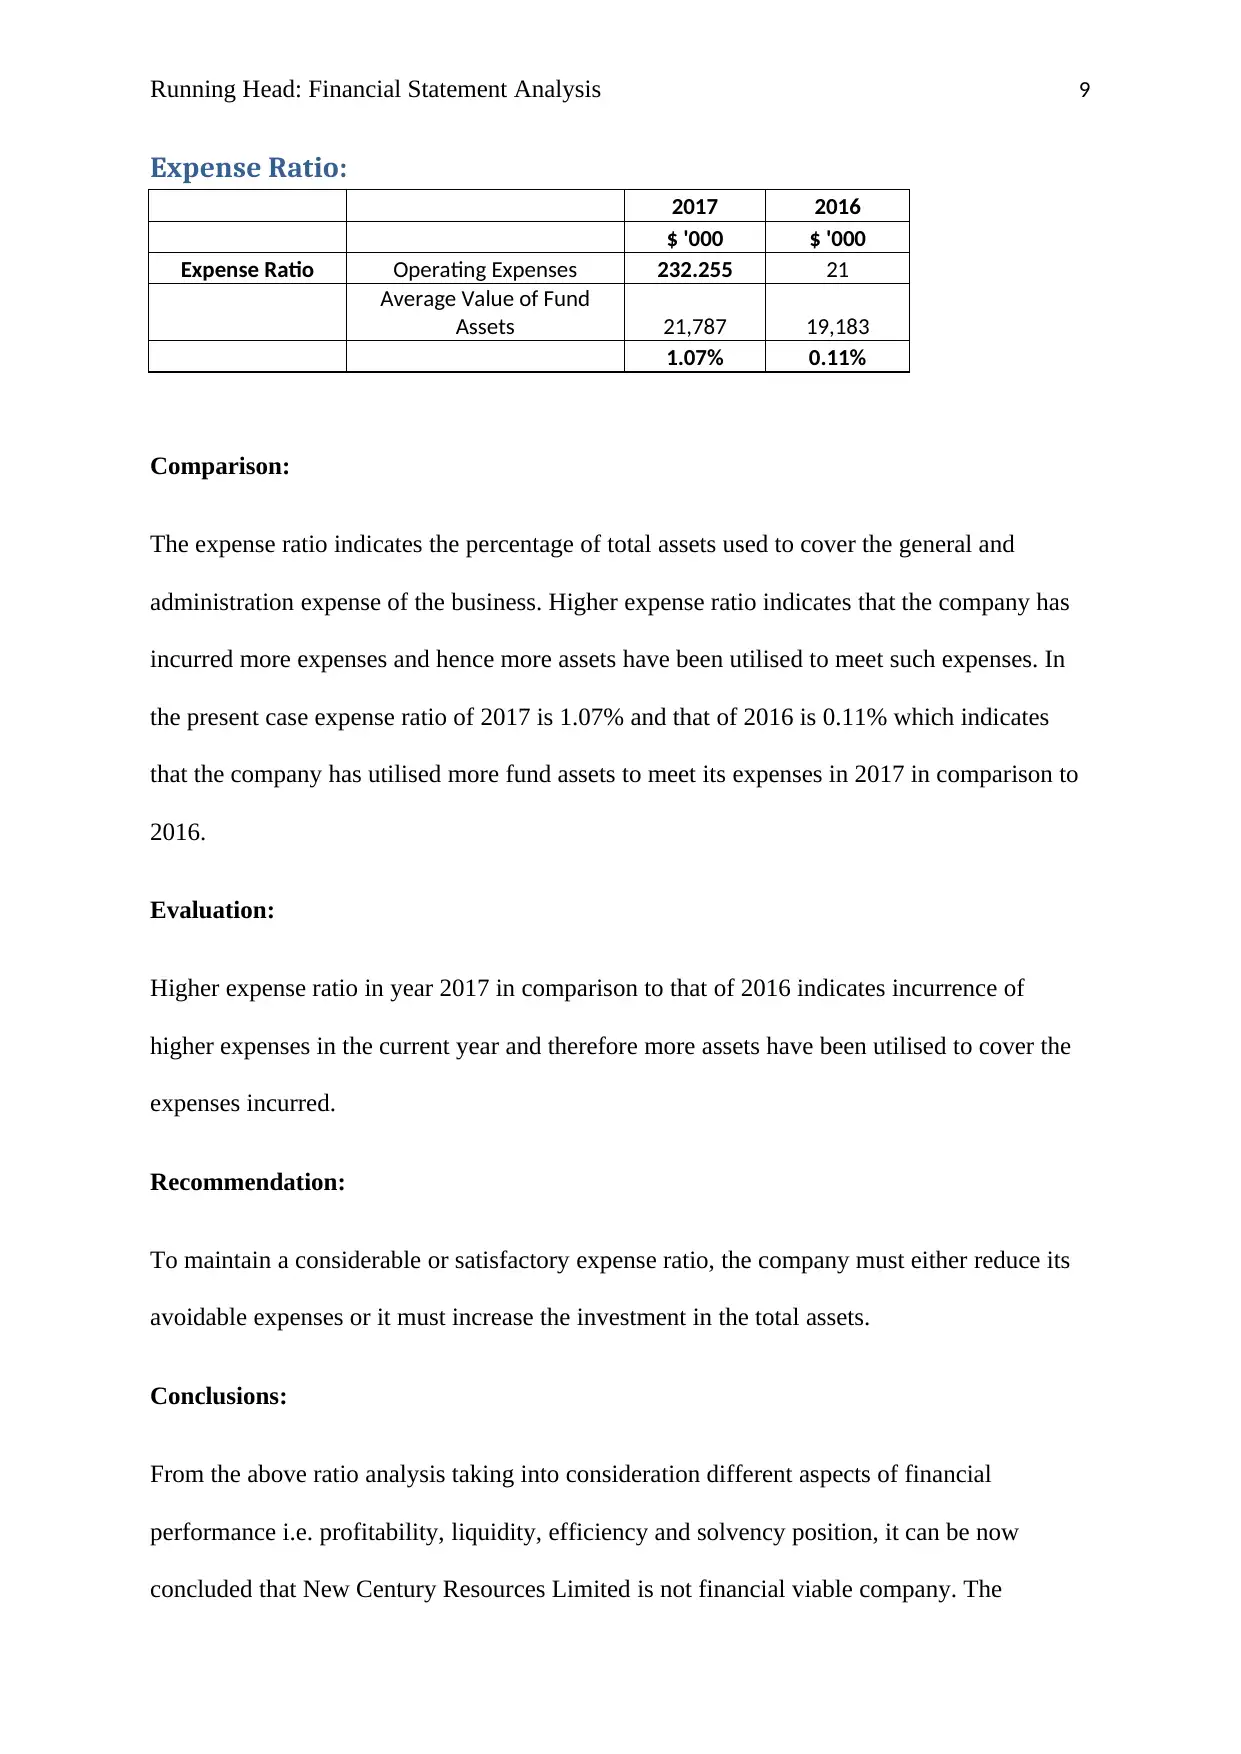
Expense Ratio:
2017 2016
$ '000 $ '000
Expense Ratio Operating Expenses 232.255 21
Average Value of Fund
Assets 21,787 19,183
1.07% 0.11%
Comparison:
The expense ratio indicates the percentage of total assets used to cover the general and
administration expense of the business. Higher expense ratio indicates that the company has
incurred more expenses and hence more assets have been utilised to meet such expenses. In
the present case expense ratio of 2017 is 1.07% and that of 2016 is 0.11% which indicates
that the company has utilised more fund assets to meet its expenses in 2017 in comparison to
2016.
Evaluation:
Higher expense ratio in year 2017 in comparison to that of 2016 indicates incurrence of
higher expenses in the current year and therefore more assets have been utilised to cover the
expenses incurred.
Recommendation:
To maintain a considerable or satisfactory expense ratio, the company must either reduce its
avoidable expenses or it must increase the investment in the total assets.
Conclusions:
From the above ratio analysis taking into consideration different aspects of financial
performance i.e. profitability, liquidity, efficiency and solvency position, it can be now
concluded that New Century Resources Limited is not financial viable company. The
Paraphrase This Document
Need a fresh take? Get an instant paraphrase of this document with our AI Paraphraser
Running Head: Financial Statement Analysis 10
financial performance of the company is not sustainable and hence it is not capable of
attracting the potential investors towards it. The ratio analysis has clearly proved that the
company is not holding a profitable and liquidity position in the market.
financial performance of the company is not sustainable and hence it is not capable of
attracting the potential investors towards it. The ratio analysis has clearly proved that the
company is not holding a profitable and liquidity position in the market.
Running Head: Financial Statement Analysis 11
Bibliography:
Pandey, I.M. Financial Management. India: Vikas Publishing House, 2015.
Cull, R. K., and Morduch, J. “Financial Performance and Outreach: A Global Analysis of
Leading Microbanks”. The Economic Journal, Vol. 117, No. 517, F107-F133.
Axel, T. Ratio Analysis Fundamentals: How 17 Financial Ratios Can Allow You to Analyse
Any Business on the Planet. Ratio Analysis.net, 2012.
Panagiotis, P. Investment Report - Fundamental Analysis/ Ratio Analysis: Comparative
Approach between two FTSE 100 corporations Vodafone plc and British Telecom Group.
Germany: GRIN Verlag , 2011.
Alice, C., Lee, J, C. Lee, Cheng, F., and Lee. Financial Analysis, Planning & Forecasting:
Theory and Application. Singapore: World Scientific, 2009.
Robert, M. Financial Management in Health Care Organizations. U.S: Cengage Learning,
2002.
Alexandra, H. Informed Traders as Liquidity Providers: Evidence from the German Equity
Market. Germany: Springer Science & Business Media, 2007.
Yahoo Finance. (2017). “New Century Resources Limited (NCZ.AX),” [Online].
https://finance.yahoo.com/chart/NCZ.AX/#eyJpbnRlcnZhbCI6ImRheSIsInBlcmlvZGljaXR5I
joxLCJ0aW1lVW5pdCI6bnVsbCwiY2FuZGxlV2lkdGgiOjgsInZvbHVtZVVuZGVybGF5Ijp
0cnVlLCJhZGoiOnRydWUsImNyb3NzaGFpciI6dHJ1ZSwiY2hhcnRUeXBlIjoibGluZSIsIm
V4dGVuZGVkIjpmYWxzZSwibWFya2V0U2Vzc2lvbnMiOnt9LCJhZ2dyZWdhdGlvblR5c
GUiOiJvaGxjIiwiY2hhcnRTY2FsZSI6ImxpbmVhciIsInBhbmVscyI6eyJjaGFydCI6eyJwZXJ
jZW50IjoxLCJkaXNwbGF5IjoiTkNaLkFYIiwiY2hhcnROYW1lIjoiY2hhcnQiLCJ0b3AiOjB
⊘ This is a preview!⊘
Do you want full access?
Subscribe today to unlock all pages.
Trusted by 1+ million students worldwide
1 out of 14
Related Documents


Your All-in-One AI-Powered Toolkit for Academic Success.
+13062052269
info@desklib.com
Available 24*7 on WhatsApp / Email
![[object Object]](/_next/static/media/star-bottom.7253800d.svg)
Unlock your academic potential
Copyright © 2020–2026 A2Z Services. All Rights Reserved. Developed and managed by ZUCOL.