New Zealand Economic Environment Analysis Report: MGMT.5920/5520
VerifiedAdded on 2023/03/21
|16
|2854
|20
Report
AI Summary
This report provides a comprehensive analysis of the economic environment of New Zealand, addressing key aspects such as supply and demand dynamics in the dairy industry, the impact of droughts and Chinese demand on milk prices, and the effects of reduced cow populations. The report further examines New Zealand's trade competitiveness by analyzing the Trade Weighted Index (TWI) and exchange rates, assessing the causes of current account deficits, and evaluating the impact of economic fluctuations in China. Additionally, the report explores the circular flow model in a multi-sector economy, identifying leakages and injections, and analyzes the Consumer Price Index (CPI) to calculate the inflation rate, providing a detailed overview of the economic factors influencing New Zealand's economy.
Running head: ECONOMIC ENVIRONMENT
Economic Environment
Name of the Student
Name of the University
Author Note
Economic Environment
Name of the Student
Name of the University
Author Note
Paraphrase This Document
Need a fresh take? Get an instant paraphrase of this document with our AI Paraphraser
1ECONOMIES OF NEW ZEALAND
Table of Contents
Part 1..........................................................................................................................................2
Answer to Question 1.............................................................................................................2
Answer to Question 2.............................................................................................................2
Answer 2.1.........................................................................................................................2
Answer 2.2.........................................................................................................................4
Answer to Question 3.............................................................................................................5
Answer 3.1.........................................................................................................................5
Answer 3.2.........................................................................................................................5
Answer to question 4..............................................................................................................6
Answer to 4.1.....................................................................................................................6
Answer to 4.2.....................................................................................................................7
Part 2..........................................................................................................................................7
Answer to Question 1.............................................................................................................7
Answer to a........................................................................................................................7
Answer to b........................................................................................................................7
Answer to c........................................................................................................................7
Answer to d........................................................................................................................8
Answer to question 2..............................................................................................................8
Answer to a........................................................................................................................8
Answer to b........................................................................................................................8
Answer to c........................................................................................................................9
Answer to question 3..............................................................................................................9
Answer to a........................................................................................................................9
Answer to b........................................................................................................................9
Answer to c........................................................................................................................9
Answer to d......................................................................................................................10
Answer to question 4............................................................................................................11
Answer to a......................................................................................................................11
Answer to b......................................................................................................................12
References................................................................................................................................13

2ECONOMIES OF NEW ZEALAND
⊘ This is a preview!⊘
Do you want full access?
Subscribe today to unlock all pages.
Trusted by 1+ million students worldwide
3ECONOMIES OF NEW ZEALAND
Part 1
Answer to Question 1
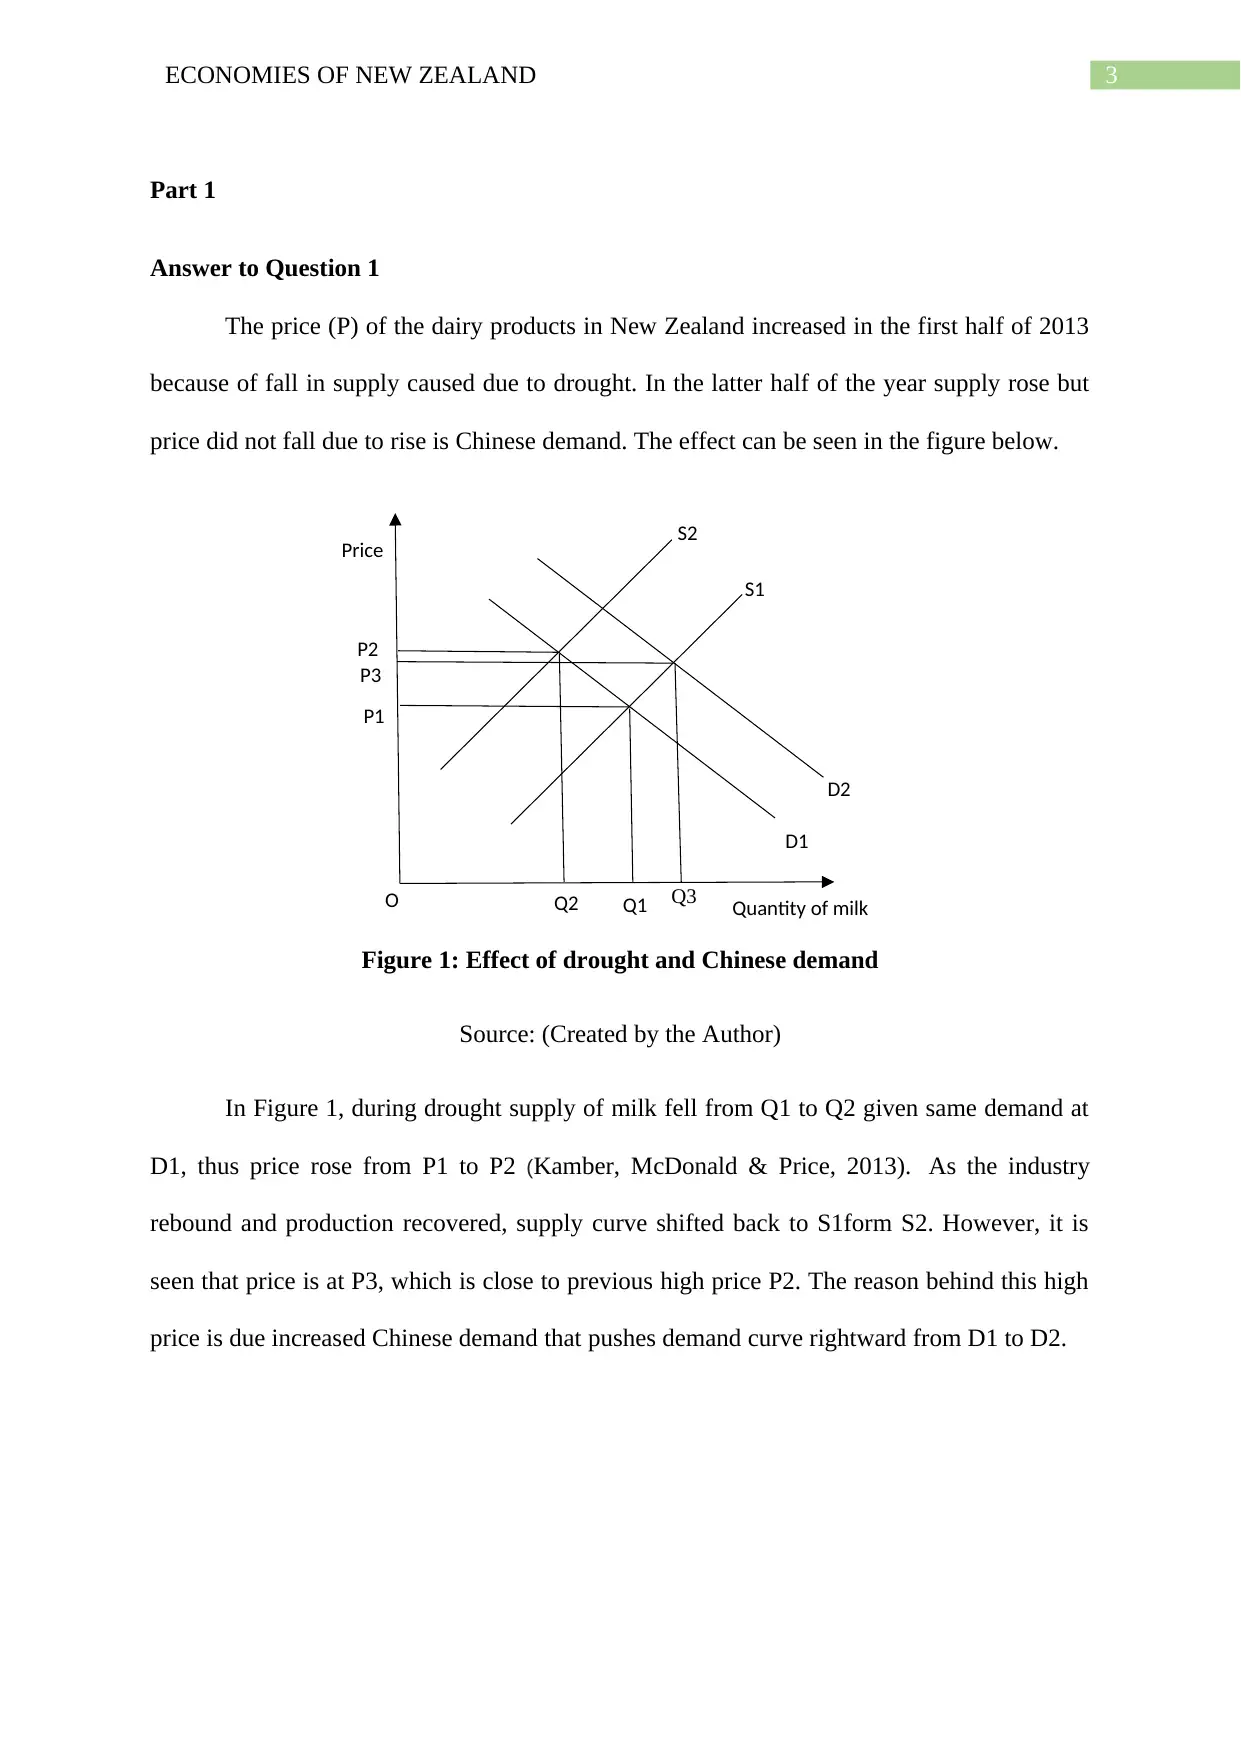
The price (P) of the dairy products in New Zealand increased in the first half of 2013
because of fall in supply caused due to drought. In the latter half of the year supply rose but
price did not fall due to rise is Chinese demand. The effect can be seen in the figure below.
Figure 1: Effect of drought and Chinese demand
Source: (Created by the Author)
In Figure 1, during drought supply of milk fell from Q1 to Q2 given same demand at
D1, thus price rose from P1 to P2 (Kamber, McDonald & Price, 2013). As the industry
rebound and production recovered, supply curve shifted back to S1form S2. However, it is
seen that price is at P3, which is close to previous high price P2. The reason behind this high
price is due increased Chinese demand that pushes demand curve rightward from D1 to D2.
Q3
P3
S2
S1
D1
D2
P2
Q2 Q1
P1
Price
Quantity of milkO
Part 1
Answer to Question 1
The price (P) of the dairy products in New Zealand increased in the first half of 2013
because of fall in supply caused due to drought. In the latter half of the year supply rose but
price did not fall due to rise is Chinese demand. The effect can be seen in the figure below.
Figure 1: Effect of drought and Chinese demand
Source: (Created by the Author)
In Figure 1, during drought supply of milk fell from Q1 to Q2 given same demand at
D1, thus price rose from P1 to P2 (Kamber, McDonald & Price, 2013). As the industry
rebound and production recovered, supply curve shifted back to S1form S2. However, it is
seen that price is at P3, which is close to previous high price P2. The reason behind this high
price is due increased Chinese demand that pushes demand curve rightward from D1 to D2.
Q3
P3
S2
S1
D1
D2
P2
Q2 Q1
P1
Price
Quantity of milkO
Paraphrase This Document
Need a fresh take? Get an instant paraphrase of this document with our AI Paraphraser
4ECONOMIES OF NEW ZEALAND
Answer to Question 2
Answer 2.1
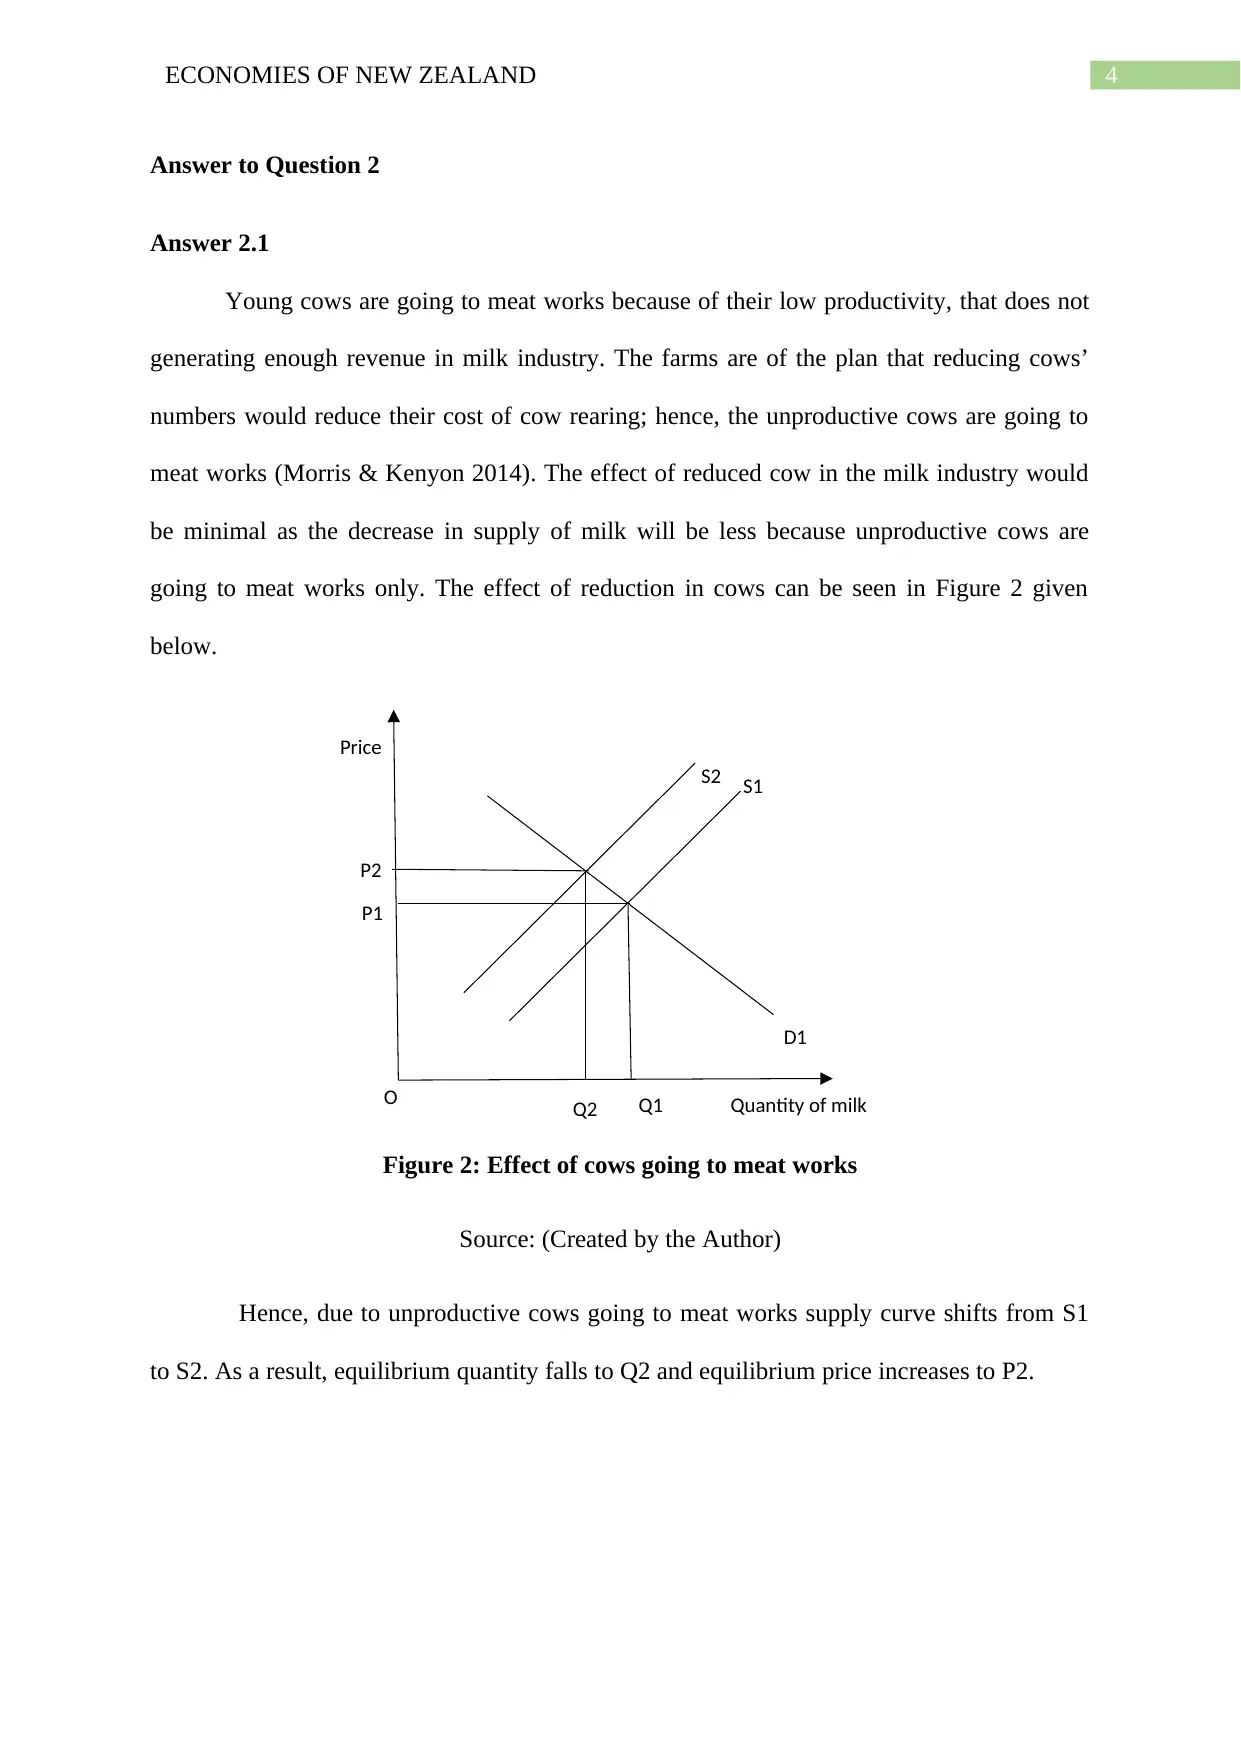
Young cows are going to meat works because of their low productivity, that does not
generating enough revenue in milk industry. The farms are of the plan that reducing cows’
numbers would reduce their cost of cow rearing; hence, the unproductive cows are going to
meat works (Morris & Kenyon 2014). The effect of reduced cow in the milk industry would
be minimal as the decrease in supply of milk will be less because unproductive cows are
going to meat works only. The effect of reduction in cows can be seen in Figure 2 given
below.
Figure 2: Effect of cows going to meat works
Source: (Created by the Author)
Hence, due to unproductive cows going to meat works supply curve shifts from S1
to S2. As a result, equilibrium quantity falls to Q2 and equilibrium price increases to P2.
S2 S1
D1
P2
P1
Q2 Q1
Price
Quantity of milkO
Answer to Question 2
Answer 2.1
Young cows are going to meat works because of their low productivity, that does not
generating enough revenue in milk industry. The farms are of the plan that reducing cows’
numbers would reduce their cost of cow rearing; hence, the unproductive cows are going to
meat works (Morris & Kenyon 2014). The effect of reduced cow in the milk industry would
be minimal as the decrease in supply of milk will be less because unproductive cows are
going to meat works only. The effect of reduction in cows can be seen in Figure 2 given
below.
Figure 2: Effect of cows going to meat works
Source: (Created by the Author)
Hence, due to unproductive cows going to meat works supply curve shifts from S1
to S2. As a result, equilibrium quantity falls to Q2 and equilibrium price increases to P2.
S2 S1
D1
P2
P1
Q2 Q1
Price
Quantity of milkO
5ECONOMIES OF NEW ZEALAND
Answer 2.2
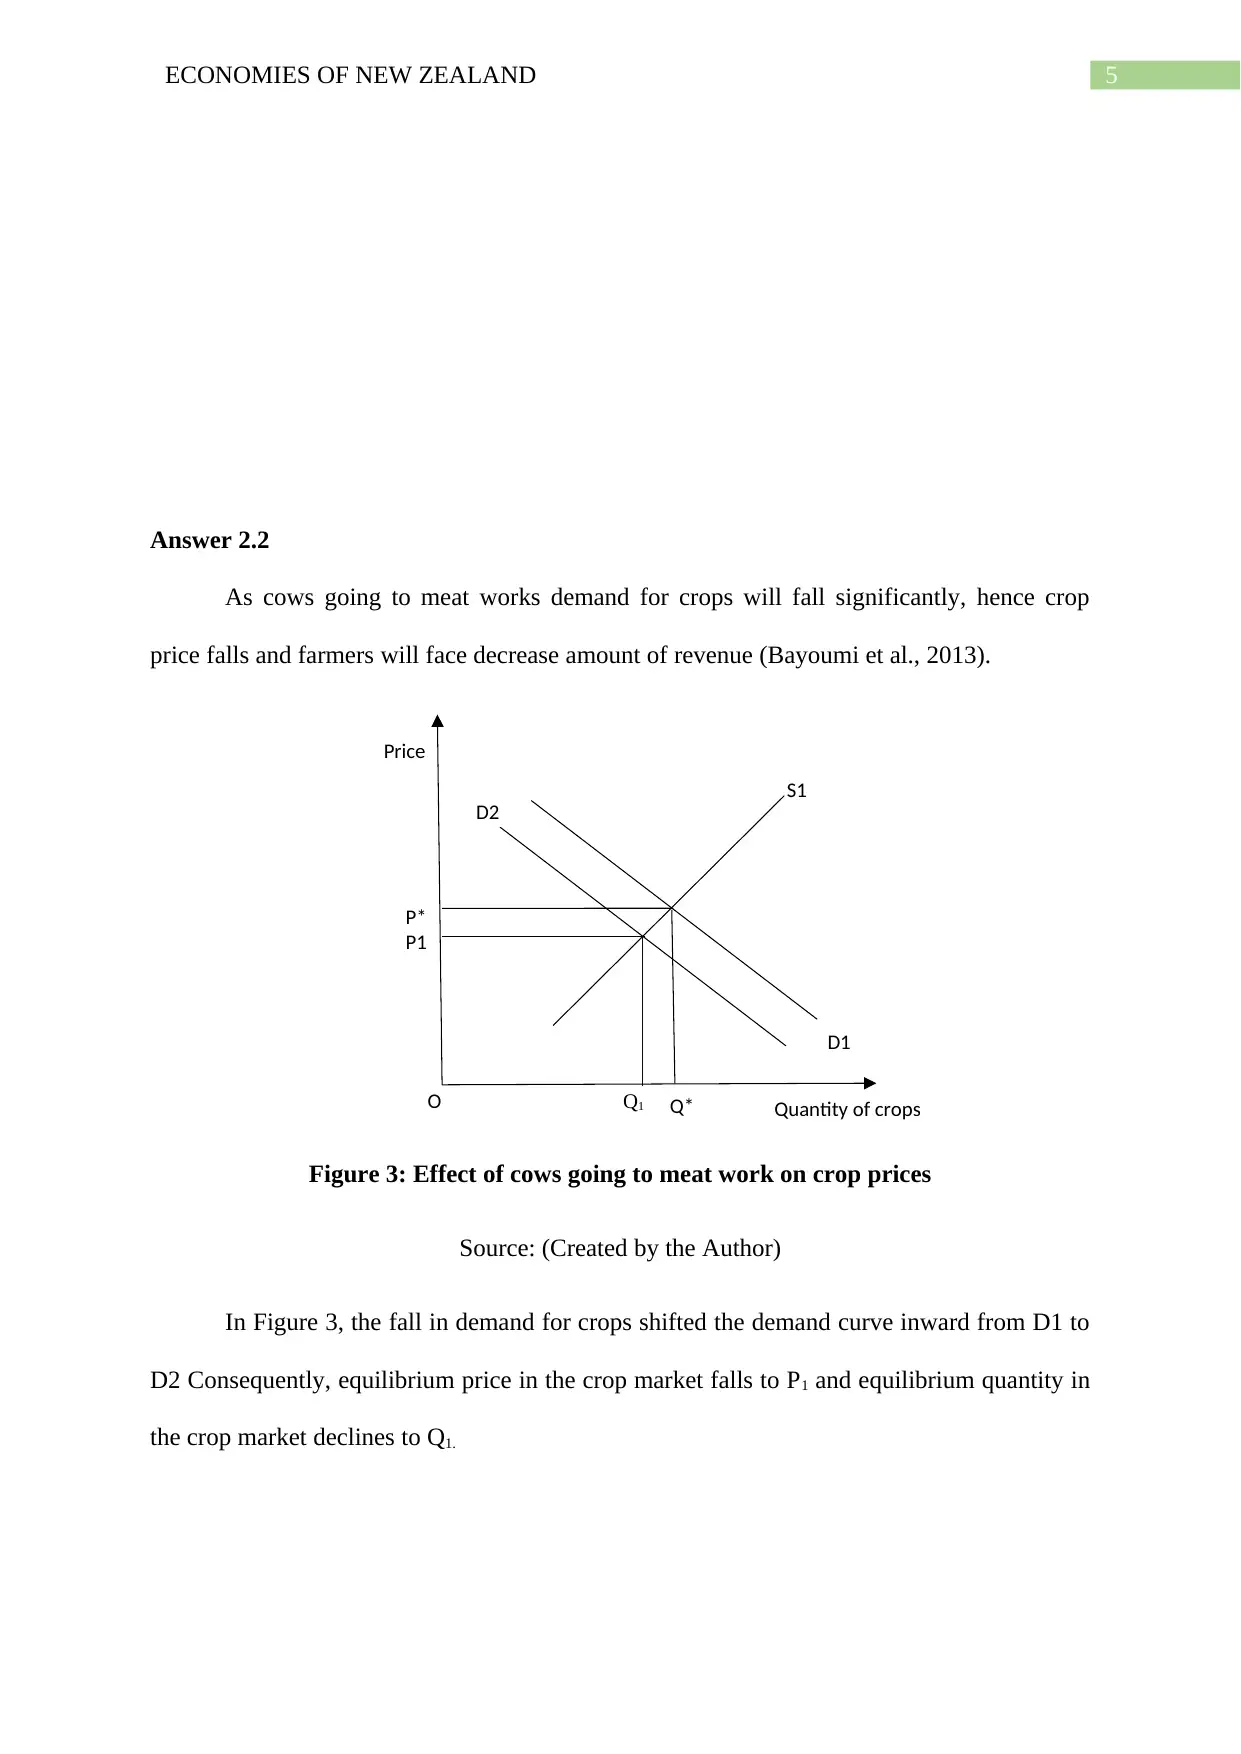
As cows going to meat works demand for crops will fall significantly, hence crop
price falls and farmers will face decrease amount of revenue (Bayoumi et al., 2013).
Figure 3: Effect of cows going to meat work on crop prices
Source: (Created by the Author)
In Figure 3, the fall in demand for crops shifted the demand curve inward from D1 to
D2 Consequently, equilibrium price in the crop market falls to P1 and equilibrium quantity in
the crop market declines to Q1.
S1
D1
P1
P*
Q*
Price
Quantity of cropsO
D2
Q1
Answer 2.2
As cows going to meat works demand for crops will fall significantly, hence crop
price falls and farmers will face decrease amount of revenue (Bayoumi et al., 2013).
Figure 3: Effect of cows going to meat work on crop prices
Source: (Created by the Author)
In Figure 3, the fall in demand for crops shifted the demand curve inward from D1 to
D2 Consequently, equilibrium price in the crop market falls to P1 and equilibrium quantity in
the crop market declines to Q1.
S1
D1
P1
P*
Q*
Price
Quantity of cropsO
D2
Q1
⊘ This is a preview!⊘
Do you want full access?
Subscribe today to unlock all pages.
Trusted by 1+ million students worldwide
6ECONOMIES OF NEW ZEALAND
Answer to Question 3
Answer 3.1
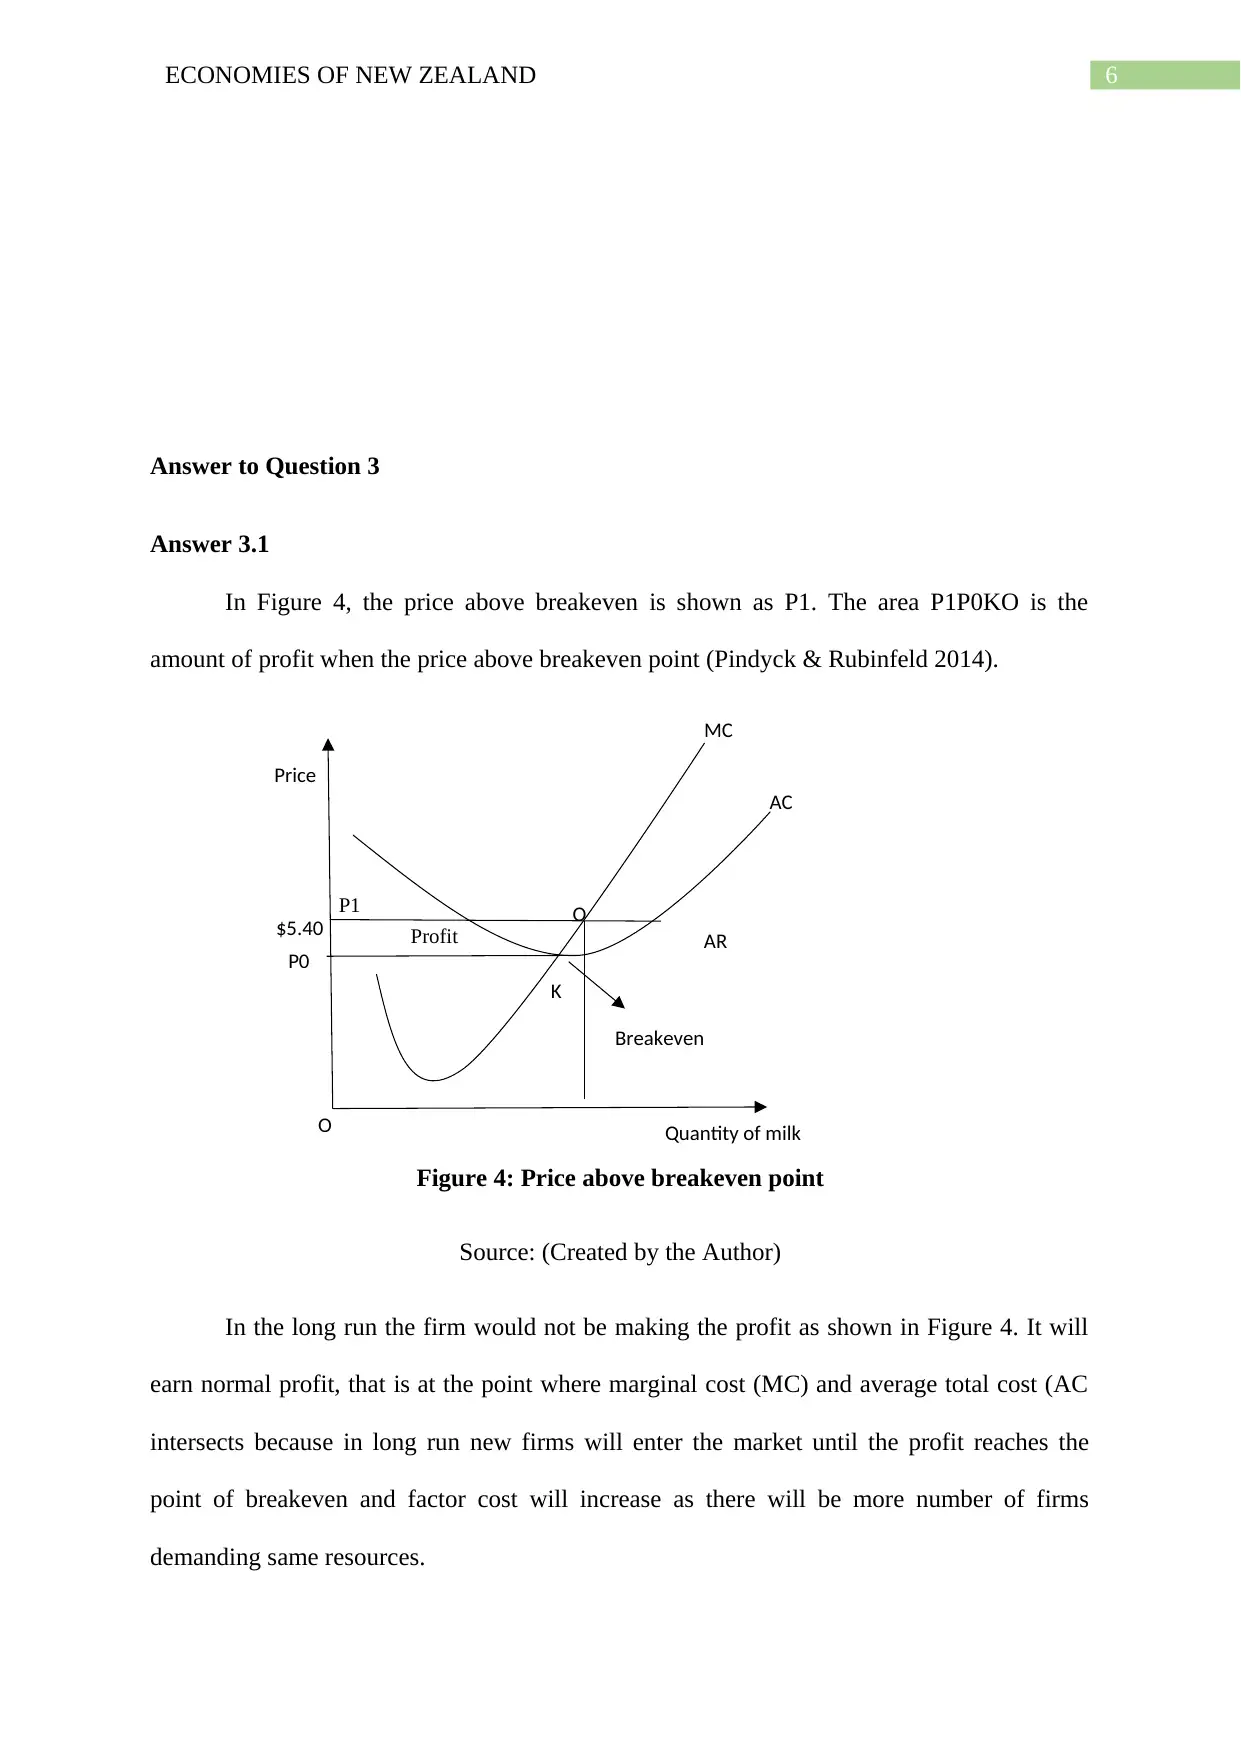
In Figure 4, the price above breakeven is shown as P1. The area P1P0KO is the
amount of profit when the price above breakeven point (Pindyck & Rubinfeld 2014).
Figure 4: Price above breakeven point
Source: (Created by the Author)
In the long run the firm would not be making the profit as shown in Figure 4. It will
earn normal profit, that is at the point where marginal cost (MC) and average total cost (AC
intersects because in long run new firms will enter the market until the profit reaches the
point of breakeven and factor cost will increase as there will be more number of firms
demanding same resources.
K
O
P0
MC
AC
$5.40
Price
Quantity of milkO
Breakeven
ARProfit
P1
Answer to Question 3
Answer 3.1
In Figure 4, the price above breakeven is shown as P1. The area P1P0KO is the
amount of profit when the price above breakeven point (Pindyck & Rubinfeld 2014).
Figure 4: Price above breakeven point
Source: (Created by the Author)
In the long run the firm would not be making the profit as shown in Figure 4. It will
earn normal profit, that is at the point where marginal cost (MC) and average total cost (AC
intersects because in long run new firms will enter the market until the profit reaches the
point of breakeven and factor cost will increase as there will be more number of firms
demanding same resources.
K
O
P0
MC
AC
$5.40
Price
Quantity of milkO
Breakeven
ARProfit
P1
Paraphrase This Document
Need a fresh take? Get an instant paraphrase of this document with our AI Paraphraser
7ECONOMIES OF NEW ZEALAND
Answer 3.2
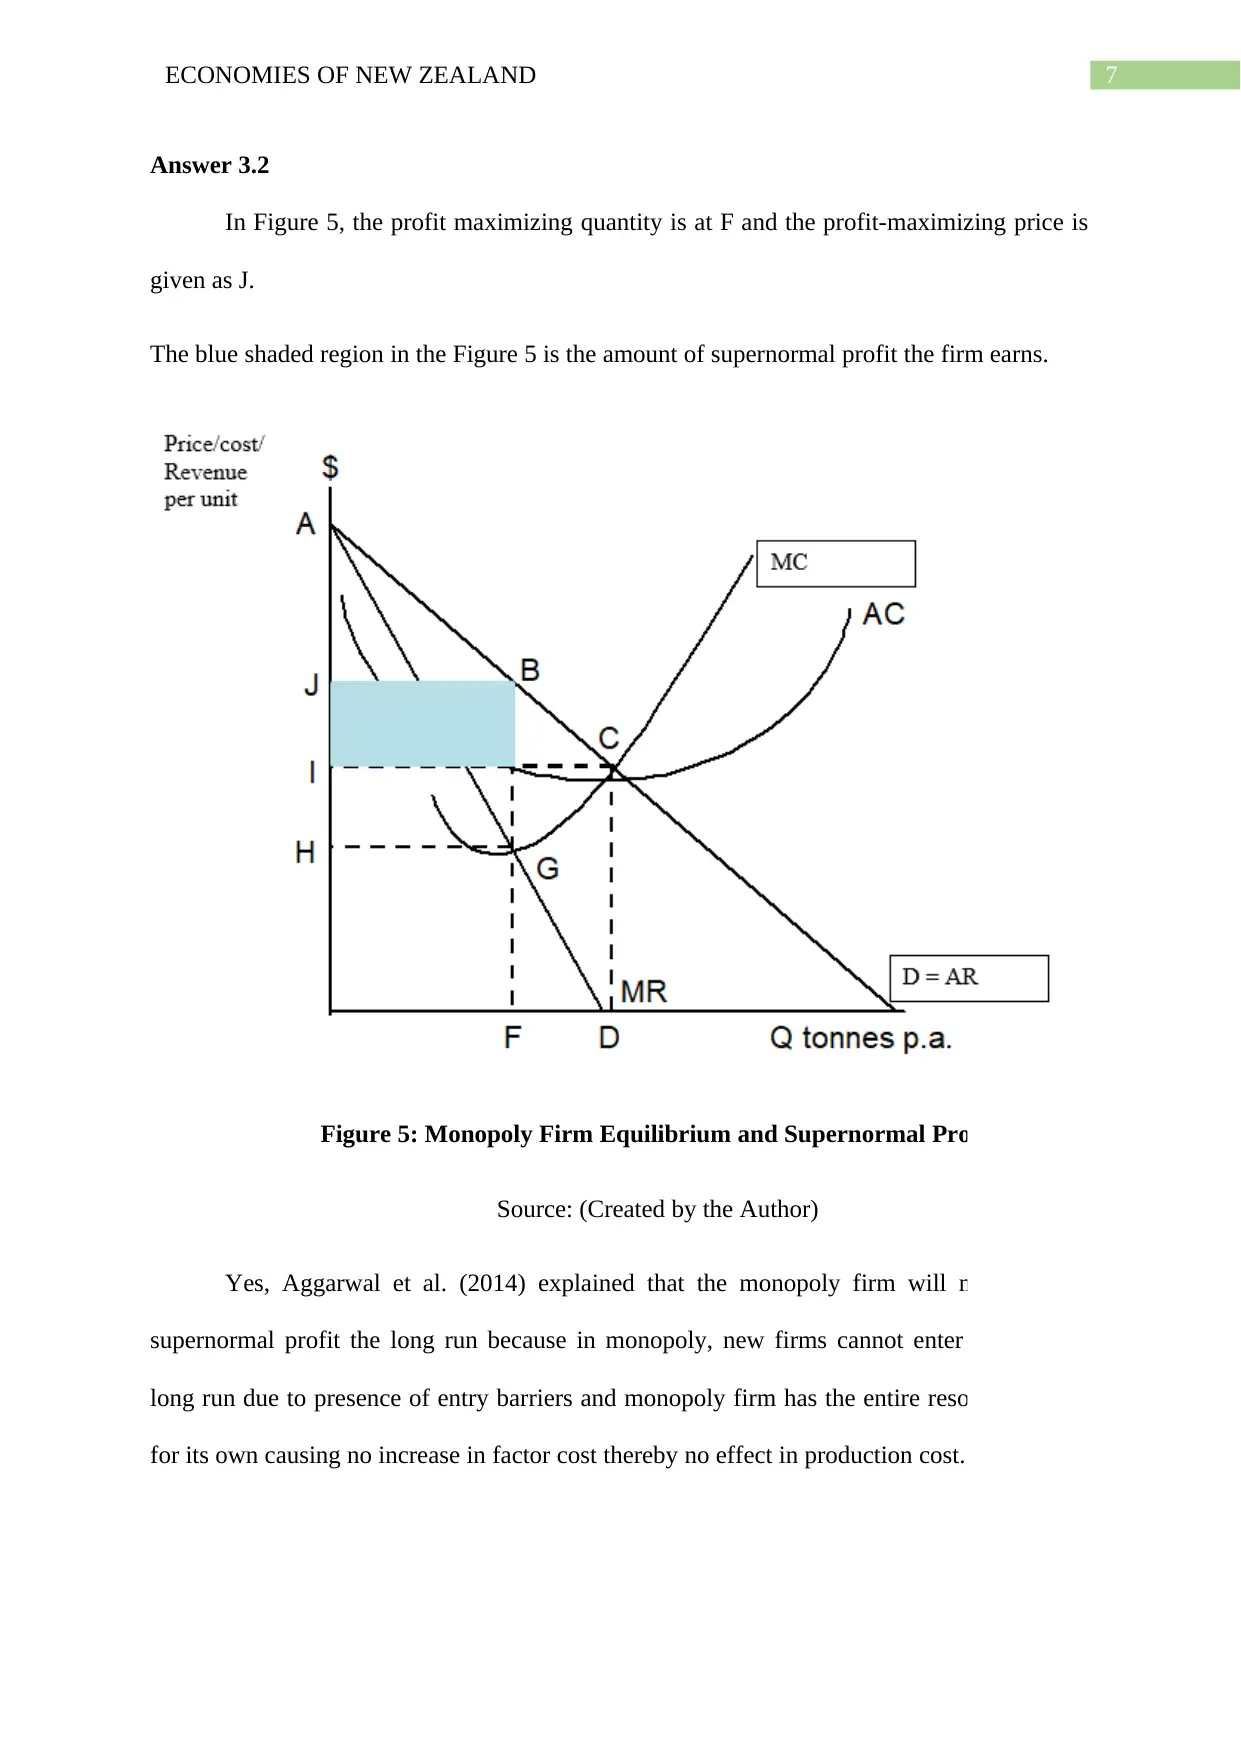
In Figure 5, the profit maximizing quantity is at F and the profit-maximizing price is
given as J.
The blue shaded region in the Figure 5 is the amount of supernormal profit the firm earns.
Figure 5: Monopoly Firm Equilibrium and Supernormal Profit
Source: (Created by the Author)
Yes, Aggarwal et al. (2014) explained that the monopoly firm will maintain the
supernormal profit the long run because in monopoly, new firms cannot enter even in the
long run due to presence of entry barriers and monopoly firm has the entire resource factors
for its own causing no increase in factor cost thereby no effect in production cost.
Answer 3.2
In Figure 5, the profit maximizing quantity is at F and the profit-maximizing price is
given as J.
The blue shaded region in the Figure 5 is the amount of supernormal profit the firm earns.
Figure 5: Monopoly Firm Equilibrium and Supernormal Profit
Source: (Created by the Author)
Yes, Aggarwal et al. (2014) explained that the monopoly firm will maintain the
supernormal profit the long run because in monopoly, new firms cannot enter even in the
long run due to presence of entry barriers and monopoly firm has the entire resource factors
for its own causing no increase in factor cost thereby no effect in production cost.
8ECONOMIES OF NEW ZEALAND
Answer to question 4
Answer to 4.1
The cost or benefit of any consumption or production incurred by an individual or a
group of people for which they are not responsible in anyway is considered as externalities to
them (Emas, 2015). There are two types of externalities one is positive and the other is
negative. The externalities associated with dairy farming are water pollution and degradation
of land quality. Both the externalities are negative externalities.
Answer to 4.2
Forestry absorbs carbon dioxide from the atmosphere and transforms them into wood
and soil. Therefore, improves the environment for all (Apsalyamova et al., 2015). Hence, the
externalities associated with forestry are positive one.
Part 2
Answer to Question 1
Answer to a
Trade Weighted Index (TWI) measures the effective exchange rate of a currency of a
country in comparison with one of the important trading partners. In other words, TWI
measures the strength of a country’s currency.
Answer to b
In 2014, NZD/USD exchange rate is high whereas TWI is low, that means, high value
of NZD is due to the weakness of USD. However, in 2015, TWI is more than the normal
exchange rate between NZD and USD; this indicates that though the exchange rate has fallen
the strength of NZD has increased (Jääskelä & Smith, 2013). In 2016, the gap between TWI
⊘ This is a preview!⊘
Do you want full access?
Subscribe today to unlock all pages.
Trusted by 1+ million students worldwide
9ECONOMIES OF NEW ZEALAND
and exchange rate has decreased in comparison to 2015, but it is still stronger for NZD. Thus,
the trend shows from 2014 to 2016 the trading position of New Zealand has improved.
Answer to c
In 2009, NZD/USD exchange rate was low and TWI was much lower that means
during this period trading competitiveness of New Zealand was poor. However, in 2014 the
NZD/USD exchange rate grew significantly, same is the case with TWI, and the gap between
NZD/USD exchange rate and TWI is much less in comparison to 2009. Hence, the trading
competitiveness has improved from 2009 to 2014.
Answer to d
Current account deficit can cause due to overvaluation of domestic currency that rises
the value of import than export and leads to current account deficit (Coudert, Couharde &
Mignon, 2013). On the other hand, current account deficit can also occur due to
uncompetitive export products that cause decline in total exports and thereby give rise to
current account deficit.
Answer to question 2
Answer to a
The fall in household income of China would reduce the consumption of people. As a
result, the demand for products will decrease including imported products. Hence, the exports
of dairy and meat to China will reduce resulting less export for New Zealand and thereby
current account balance will decrease.
Paraphrase This Document
Need a fresh take? Get an instant paraphrase of this document with our AI Paraphraser
10ECONOMIES OF NEW ZEALAND
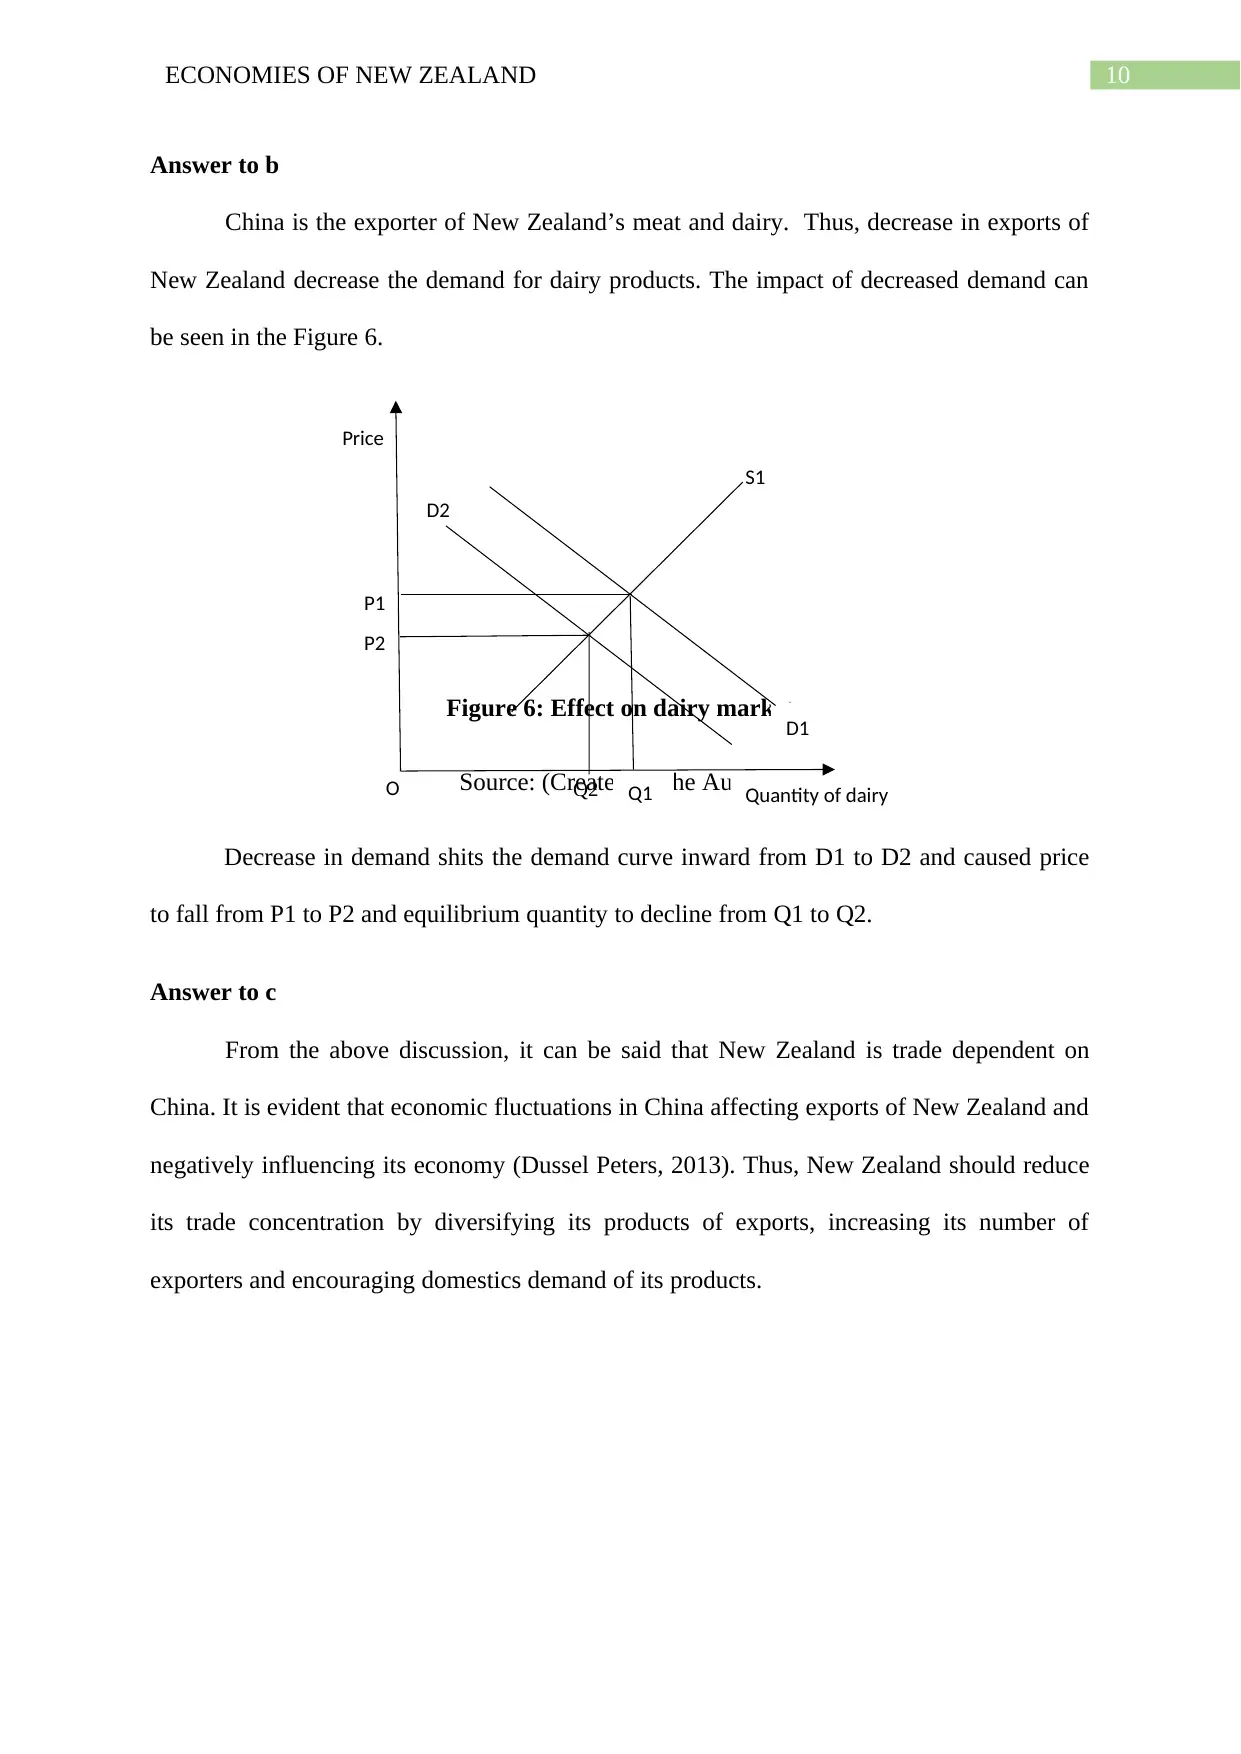
Answer to b
China is the exporter of New Zealand’s meat and dairy. Thus, decrease in exports of
New Zealand decrease the demand for dairy products. The impact of decreased demand can
be seen in the Figure 6.
Figure 6: Effect on dairy market
Source: (Created by the Author)
Decrease in demand shits the demand curve inward from D1 to D2 and caused price
to fall from P1 to P2 and equilibrium quantity to decline from Q1 to Q2.
Answer to c
From the above discussion, it can be said that New Zealand is trade dependent on
China. It is evident that economic fluctuations in China affecting exports of New Zealand and
negatively influencing its economy (Dussel Peters, 2013). Thus, New Zealand should reduce
its trade concentration by diversifying its products of exports, increasing its number of
exporters and encouraging domestics demand of its products.
S1
D1
P2
P1
Q1
Price
Quantity of dairyO
D2
Q2
11ECONOMIES OF NEW ZEALAND
Answer to question 3
Answer to a
The representation of goods and services in a flow chart in terms of money flow
between the economics agents of an economy is defined as the circular flow in a
macroeconomy.
Answer to b
https://www.stuff.co.nz/business/farming/95765613/rampant-dairy-growth-drawing-to-a-
close-rabobank
According to the article mentioned in the above link there will be an effect on the
economy’s circular flow due to the event reported in it.
Answer to c
According to the article, the government of New Zealand is limiting the dairy industry
from production because of its negative impact on the environment (Foot, Joy & Death,
2015). Hence, limiting the production of dairy industry will reduce the output of dairy
industry and as a result, the GDP of the country will have a negative impact because value of
GDP will decrease.
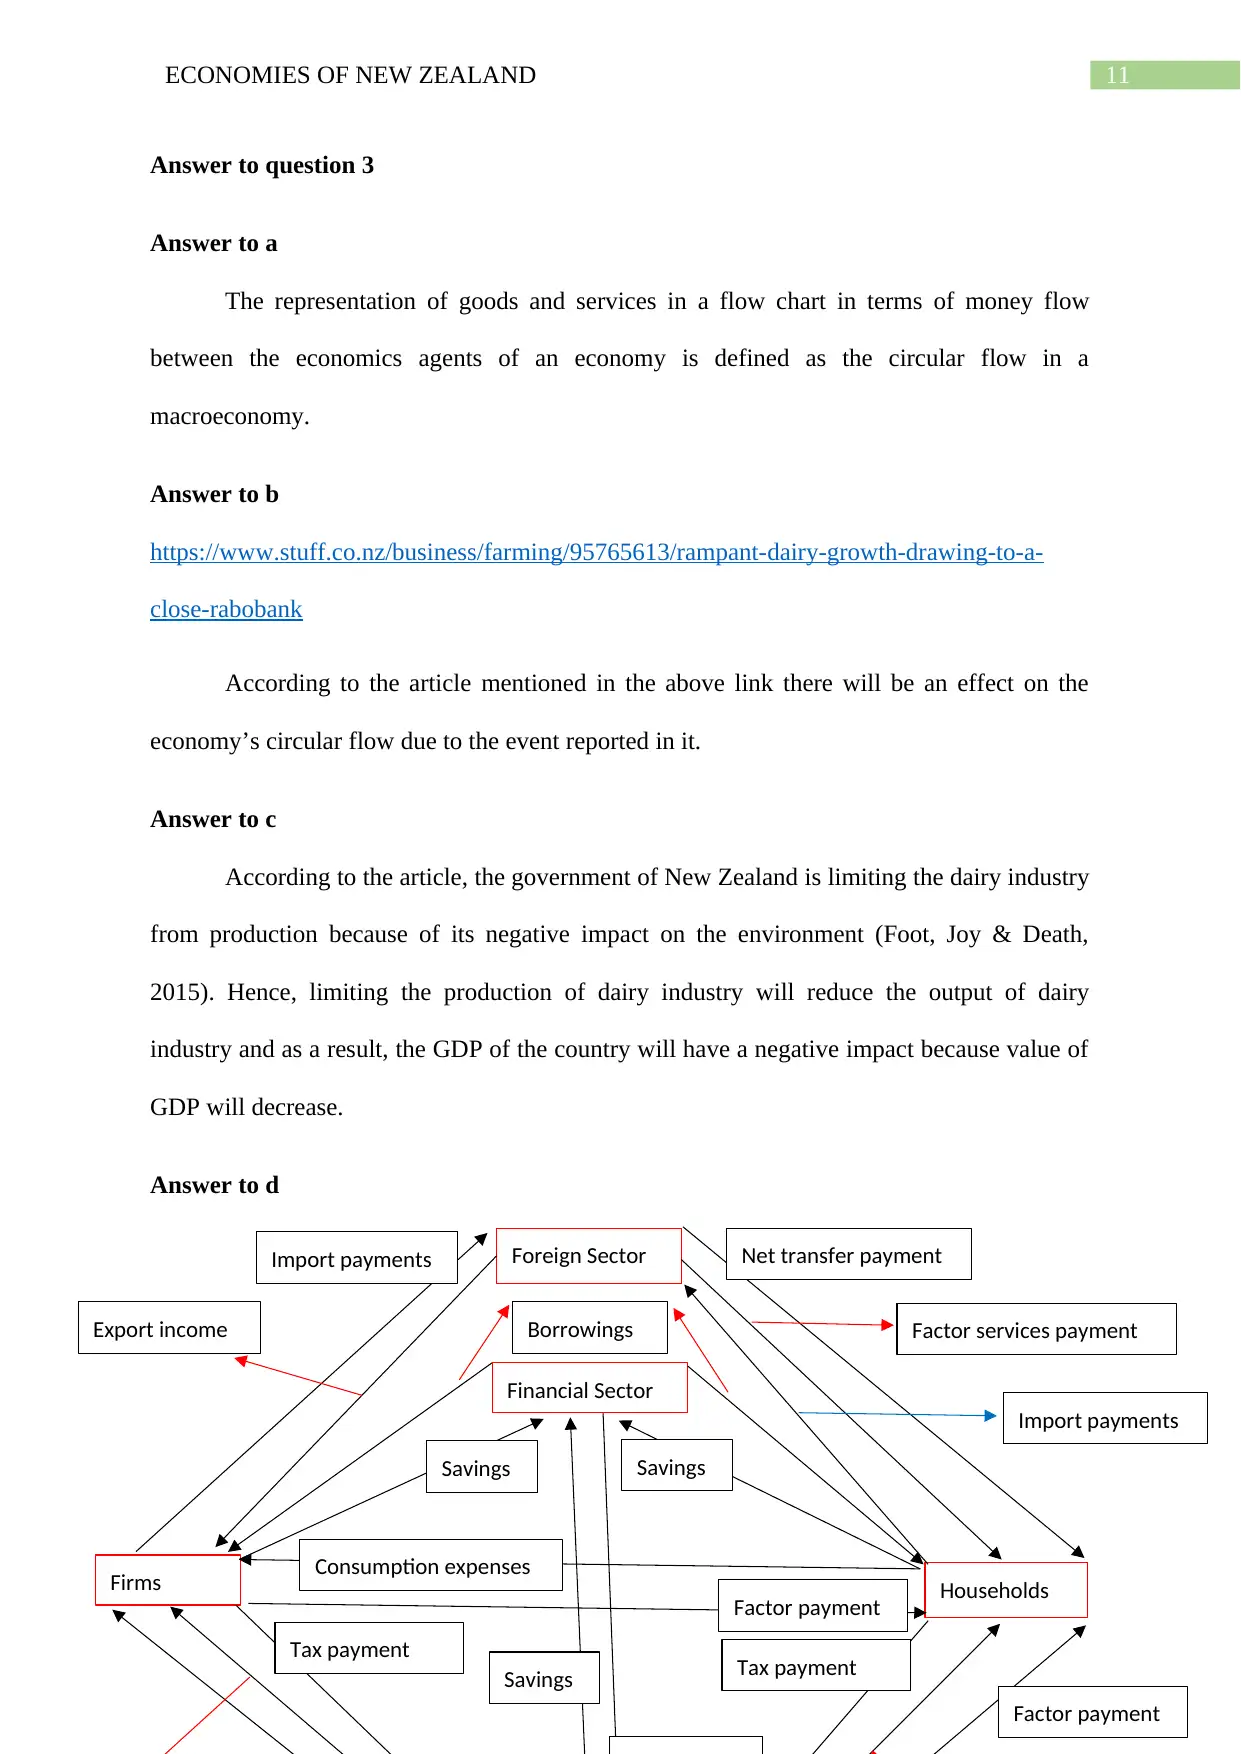
Answer to d
HouseholdsFirms
Foreign Sector
Financial Sector
Factor payment
Tax payment
Consumption expenses
Factor payment
Tax payment
Net transfer payment
Factor services payment
Import payments
Savings
Savings Savings
Import payments
Export income Borrowings
Answer to question 3
Answer to a
The representation of goods and services in a flow chart in terms of money flow
between the economics agents of an economy is defined as the circular flow in a
macroeconomy.
Answer to b
https://www.stuff.co.nz/business/farming/95765613/rampant-dairy-growth-drawing-to-a-
close-rabobank
According to the article mentioned in the above link there will be an effect on the
economy’s circular flow due to the event reported in it.
Answer to c
According to the article, the government of New Zealand is limiting the dairy industry
from production because of its negative impact on the environment (Foot, Joy & Death,
2015). Hence, limiting the production of dairy industry will reduce the output of dairy
industry and as a result, the GDP of the country will have a negative impact because value of
GDP will decrease.
Answer to d
HouseholdsFirms
Foreign Sector
Financial Sector
Factor payment
Tax payment
Consumption expenses
Factor payment
Tax payment
Net transfer payment
Factor services payment
Import payments
Savings
Savings Savings
Import payments
Export income Borrowings
⊘ This is a preview!⊘
Do you want full access?
Subscribe today to unlock all pages.
Trusted by 1+ million students worldwide
1 out of 16
Related Documents


Your All-in-One AI-Powered Toolkit for Academic Success.
+13062052269
info@desklib.com
Available 24*7 on WhatsApp / Email
![[object Object]](/_next/static/media/star-bottom.7253800d.svg)
Unlock your academic potential
Copyright © 2020–2026 A2Z Services. All Rights Reserved. Developed and managed by ZUCOL.