Effectiveness of Cybersecurity System for New Castle Bank Project
VerifiedAdded on 2020/12/09
|29
|4098
|461
Project
AI Summary
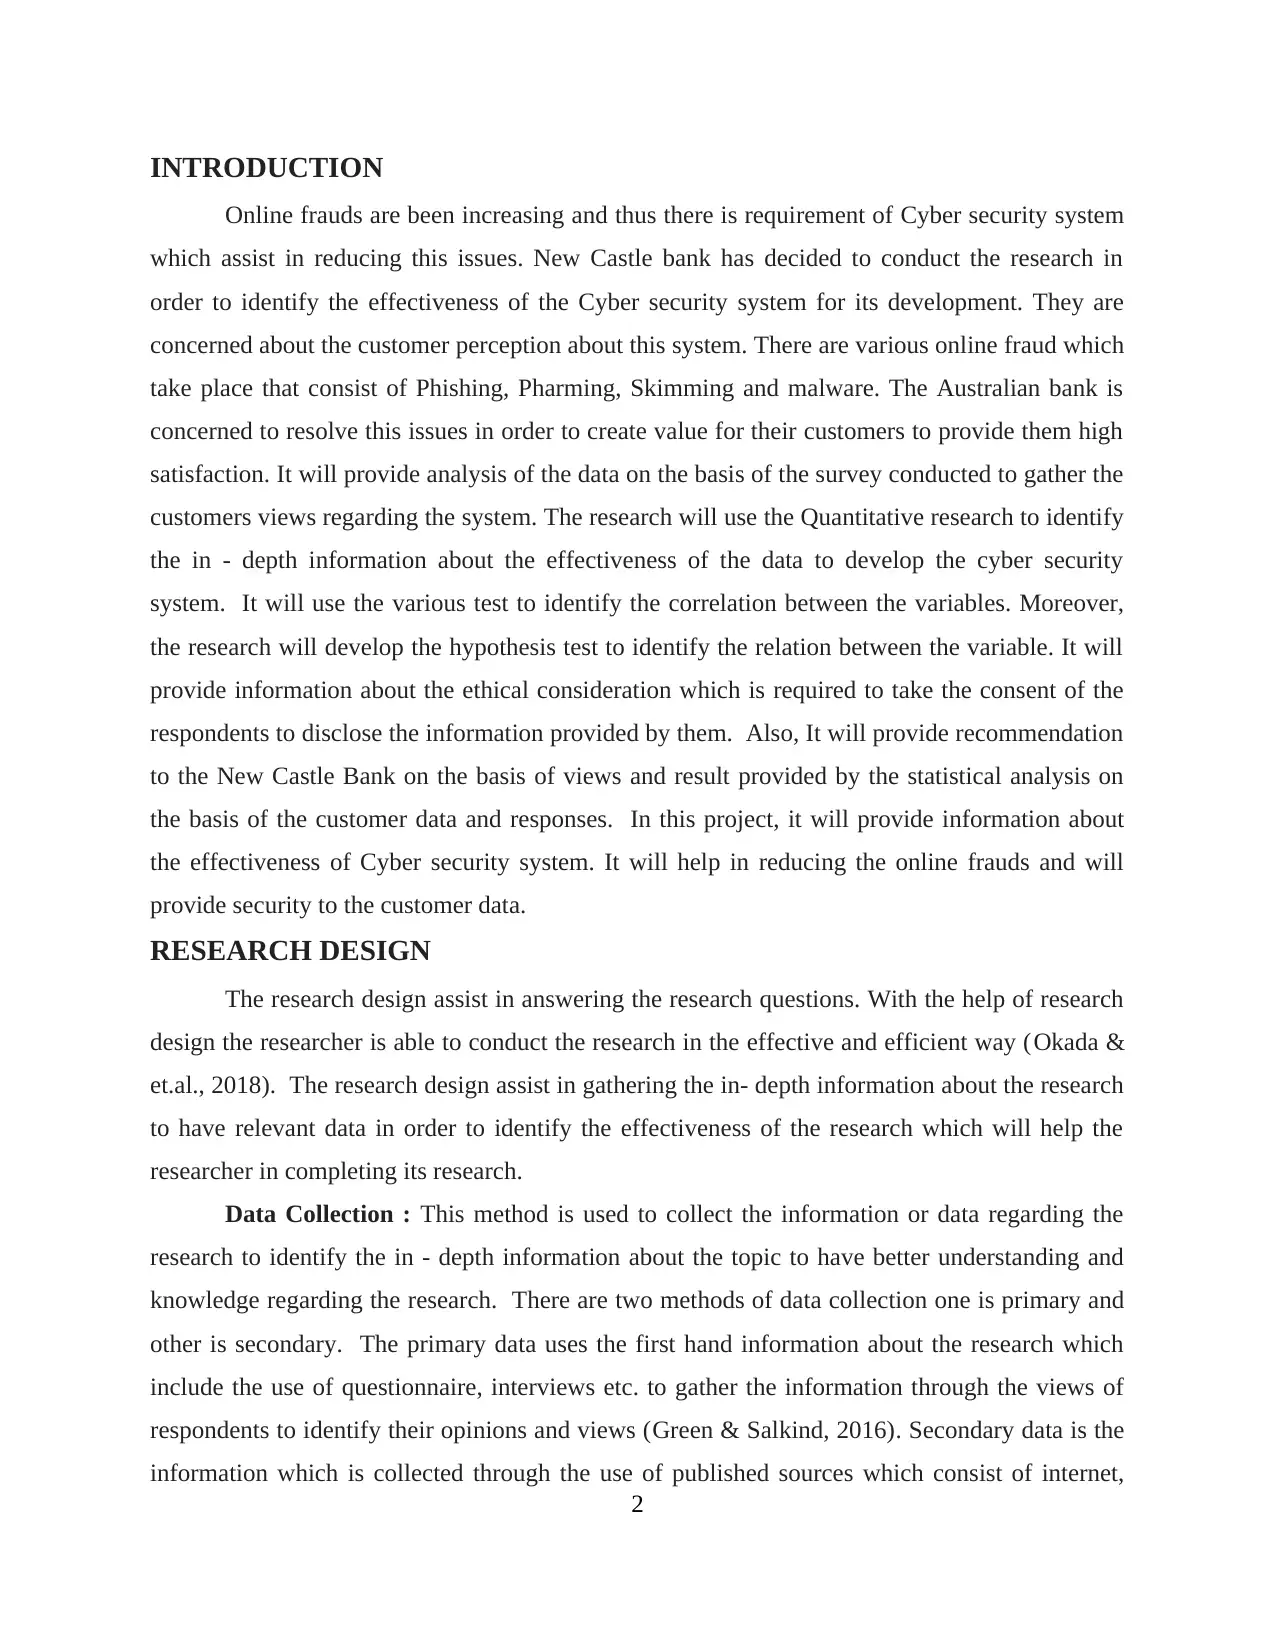
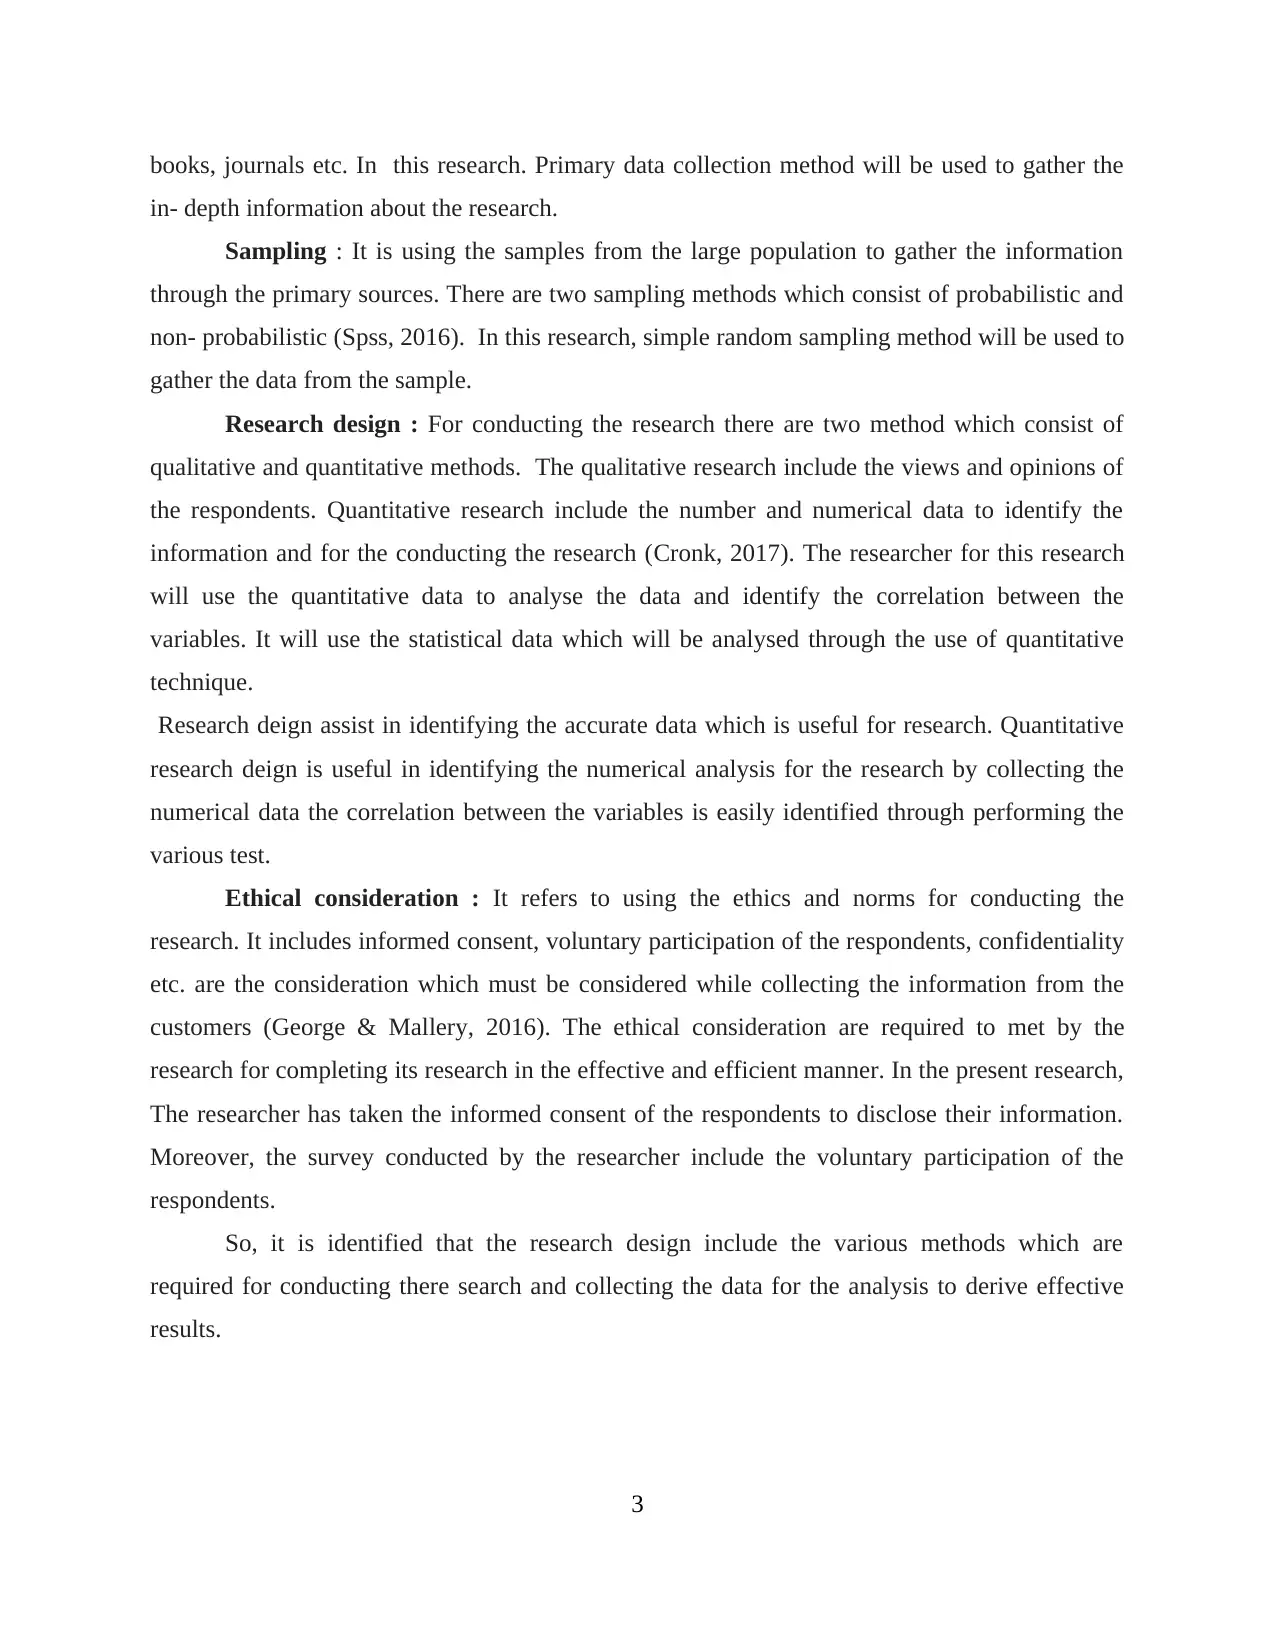
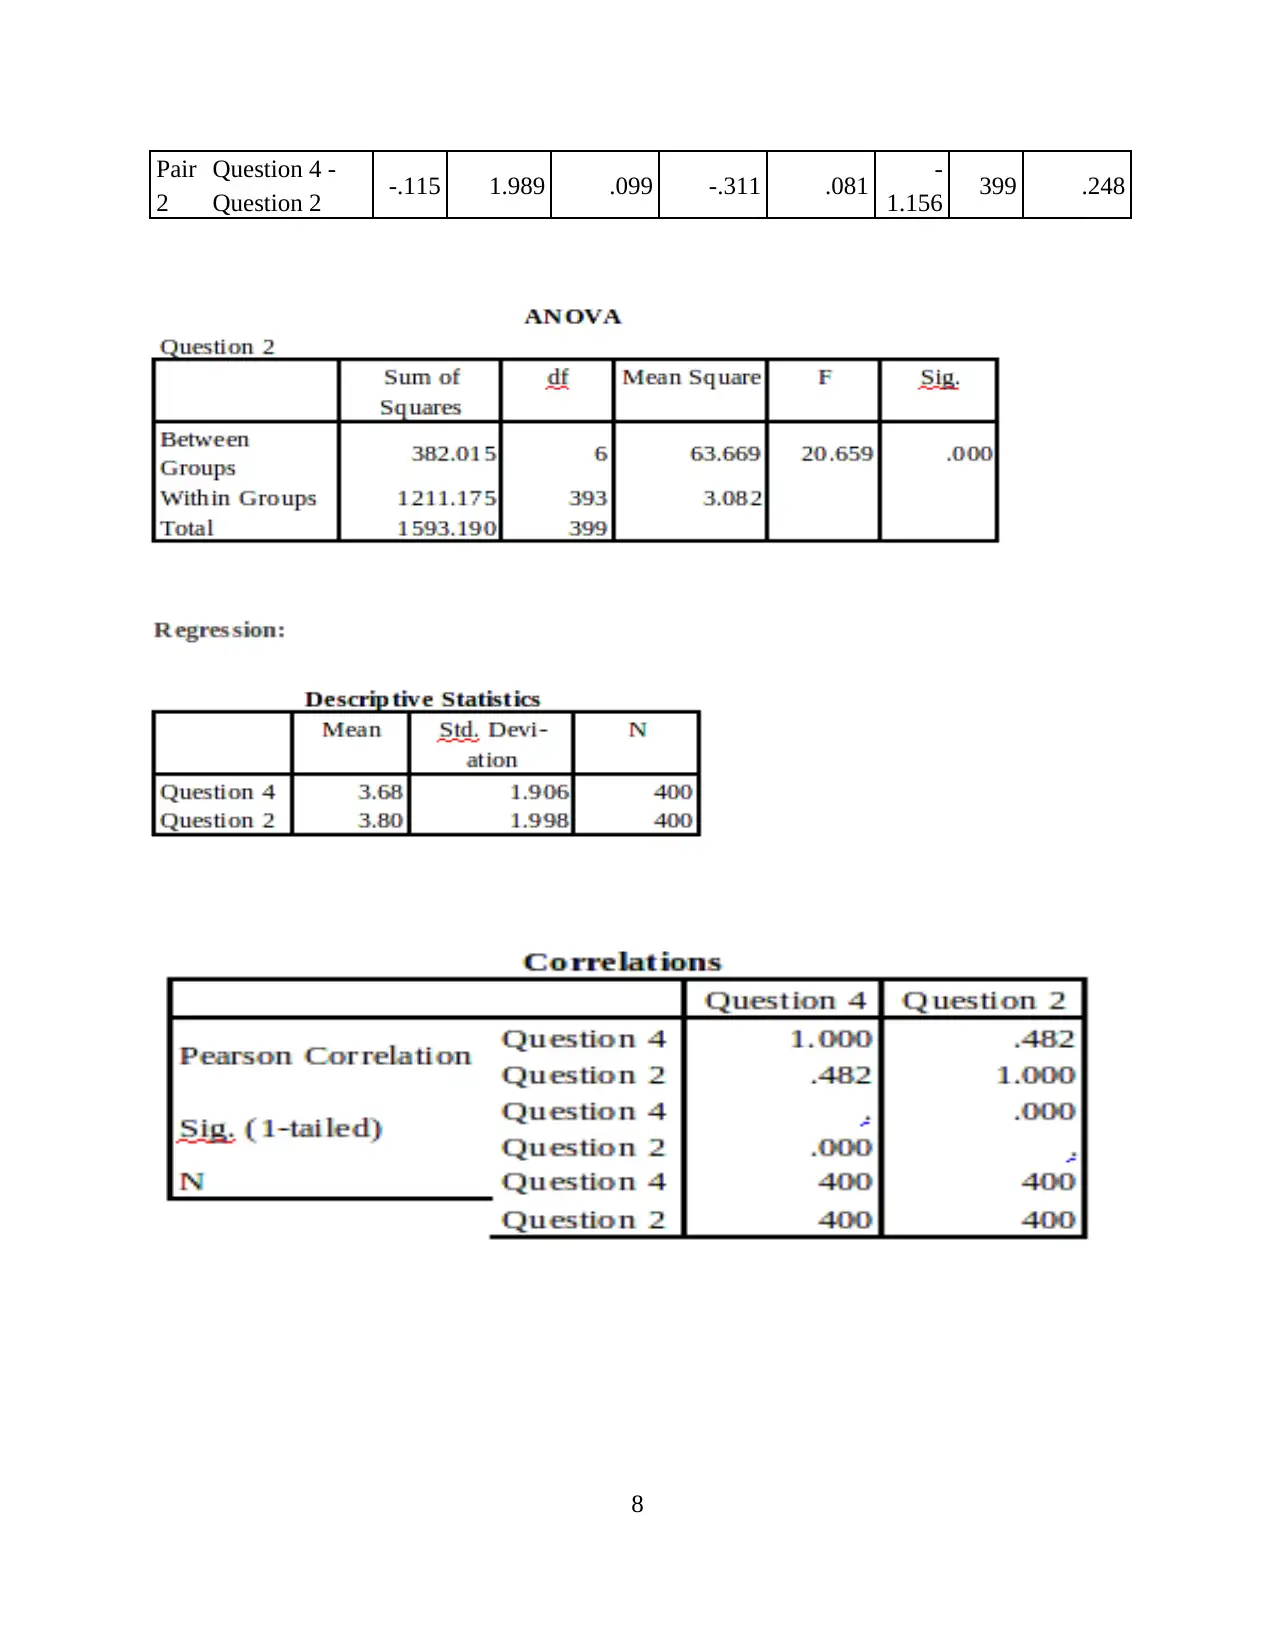
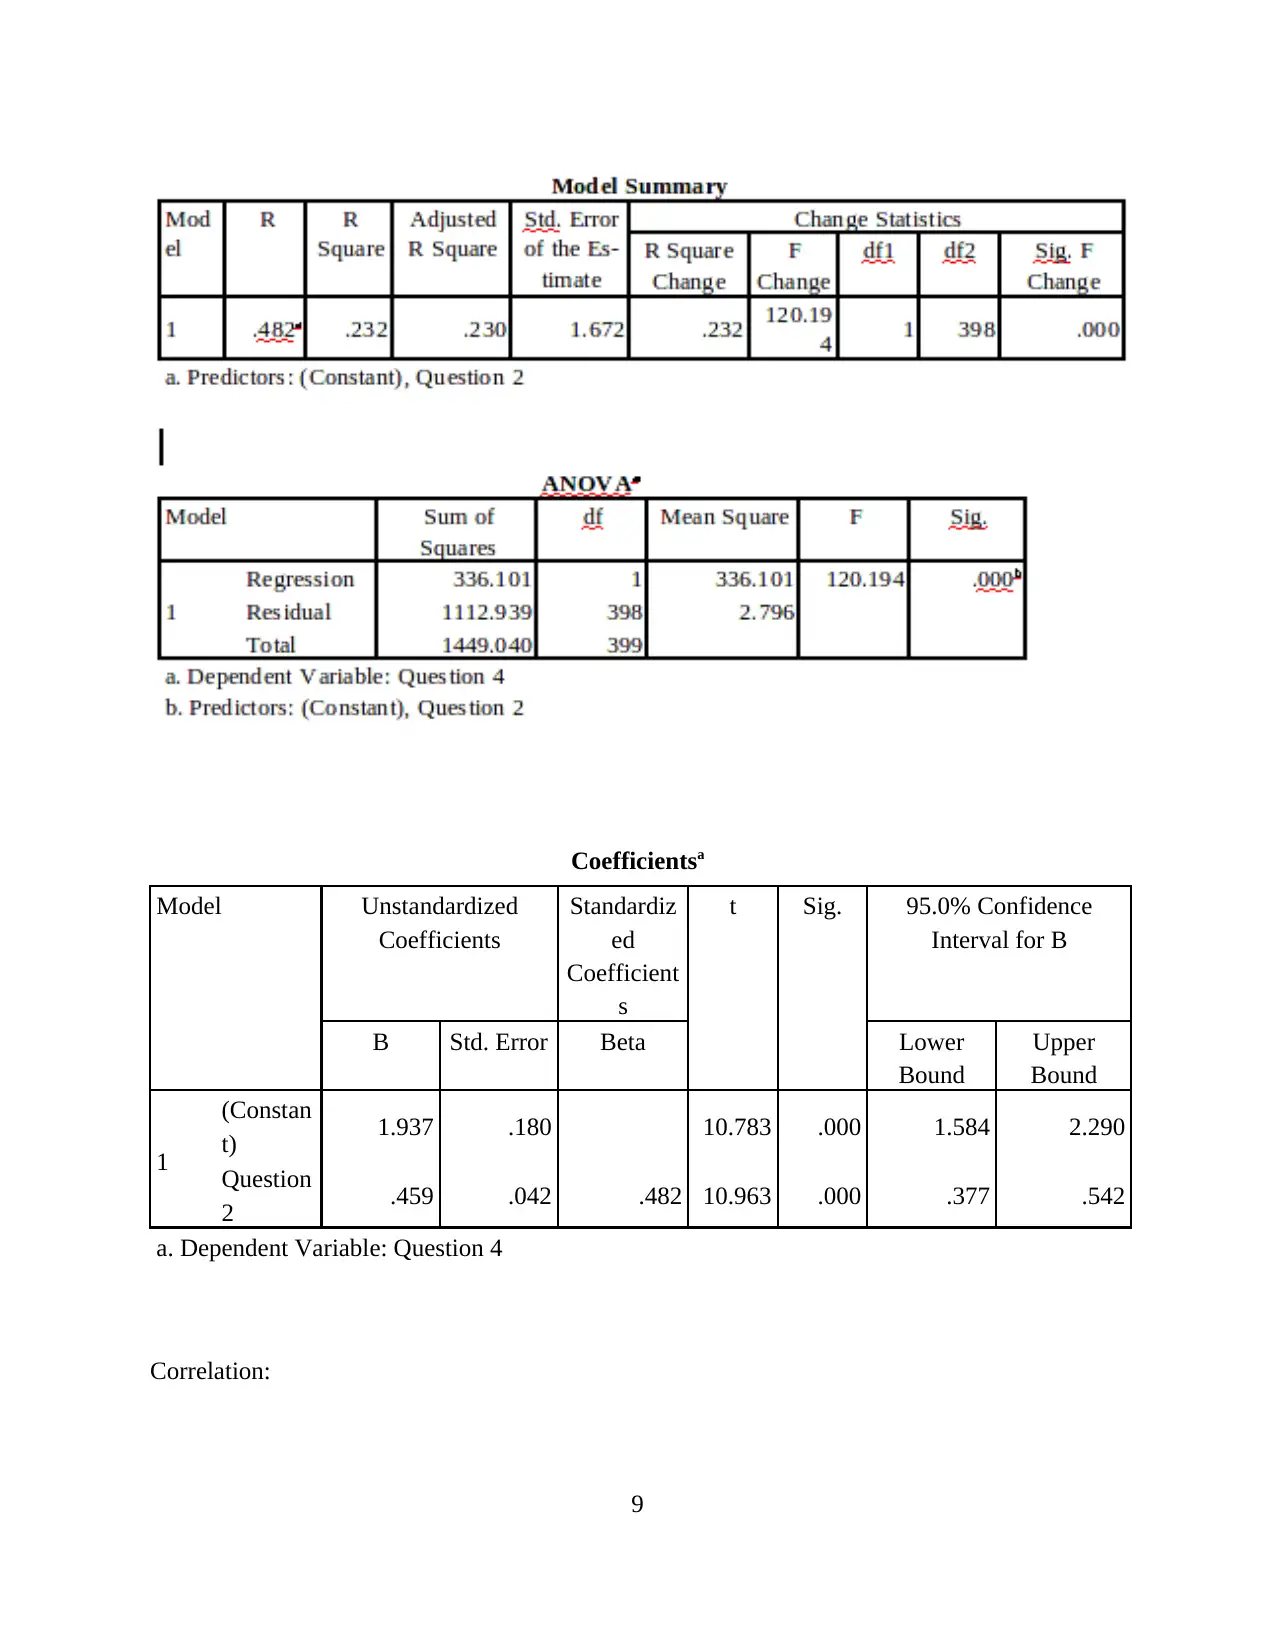
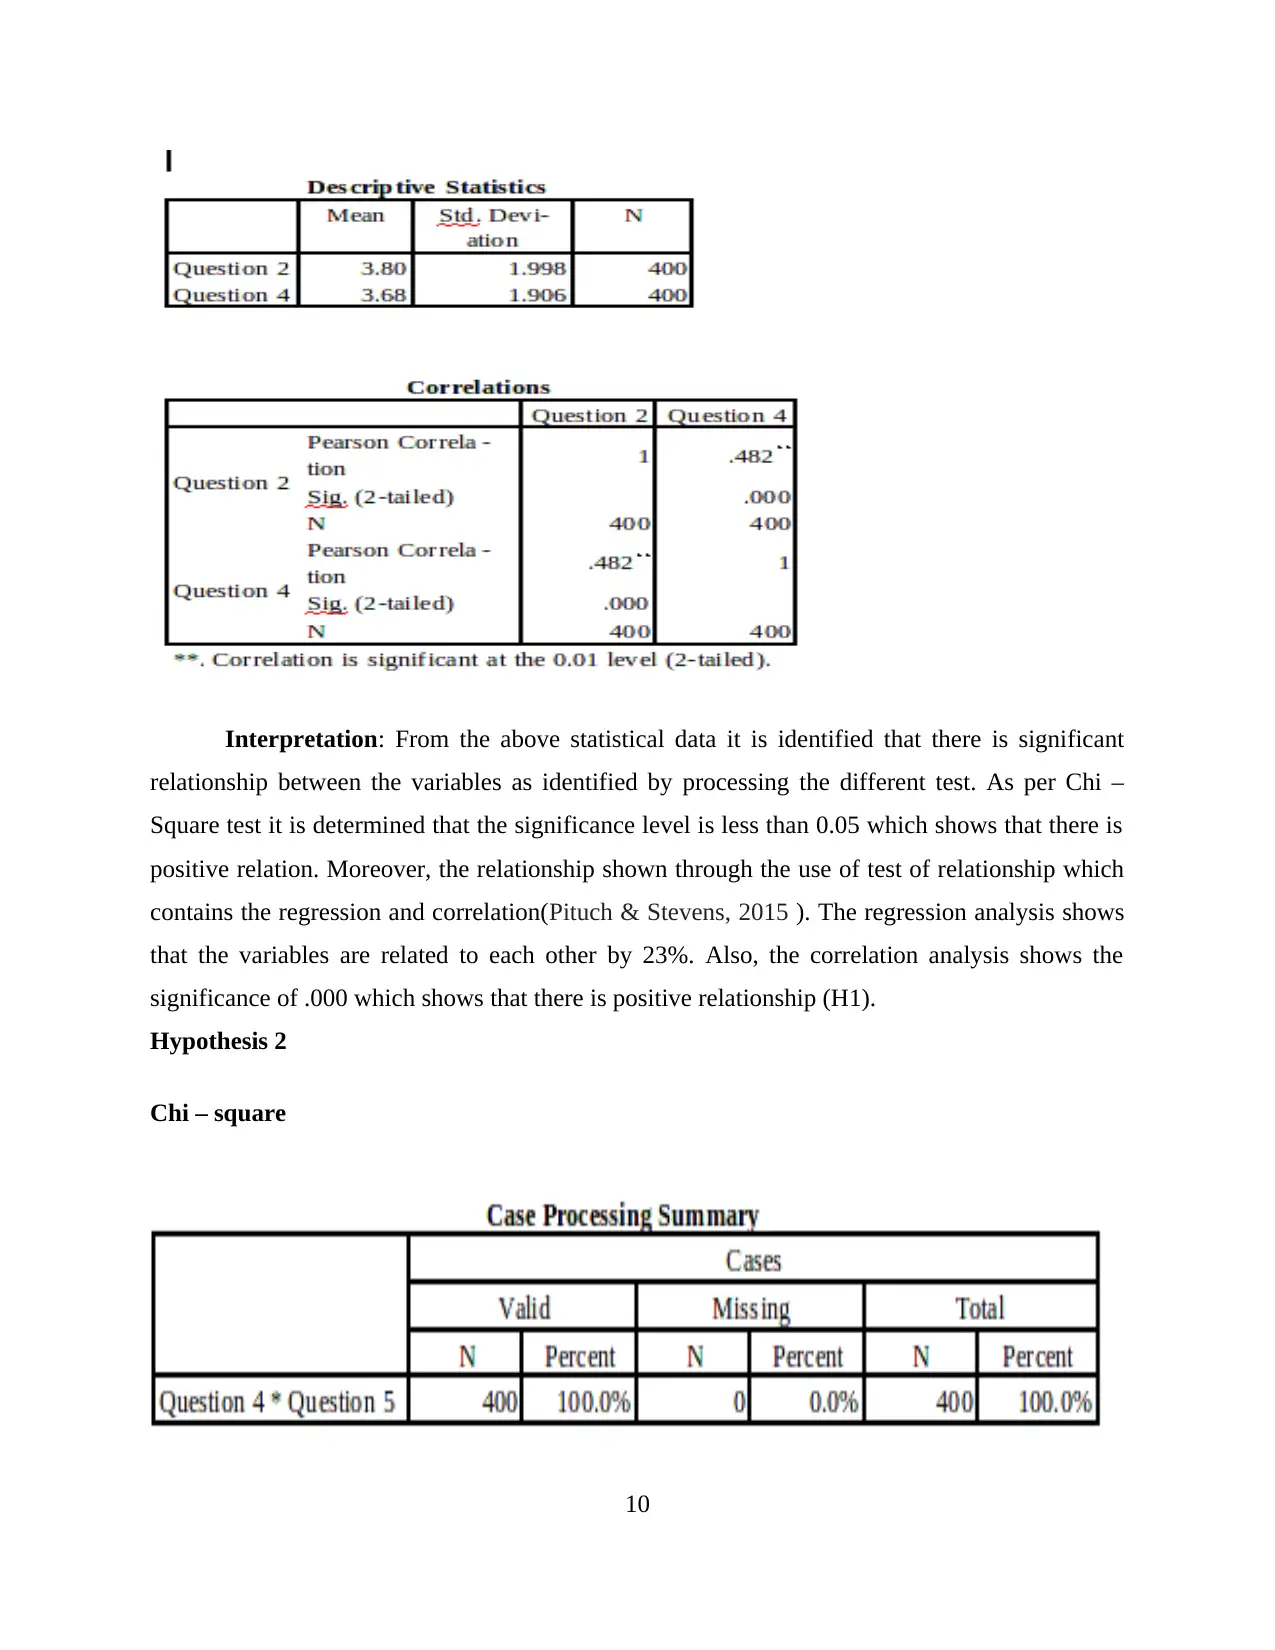
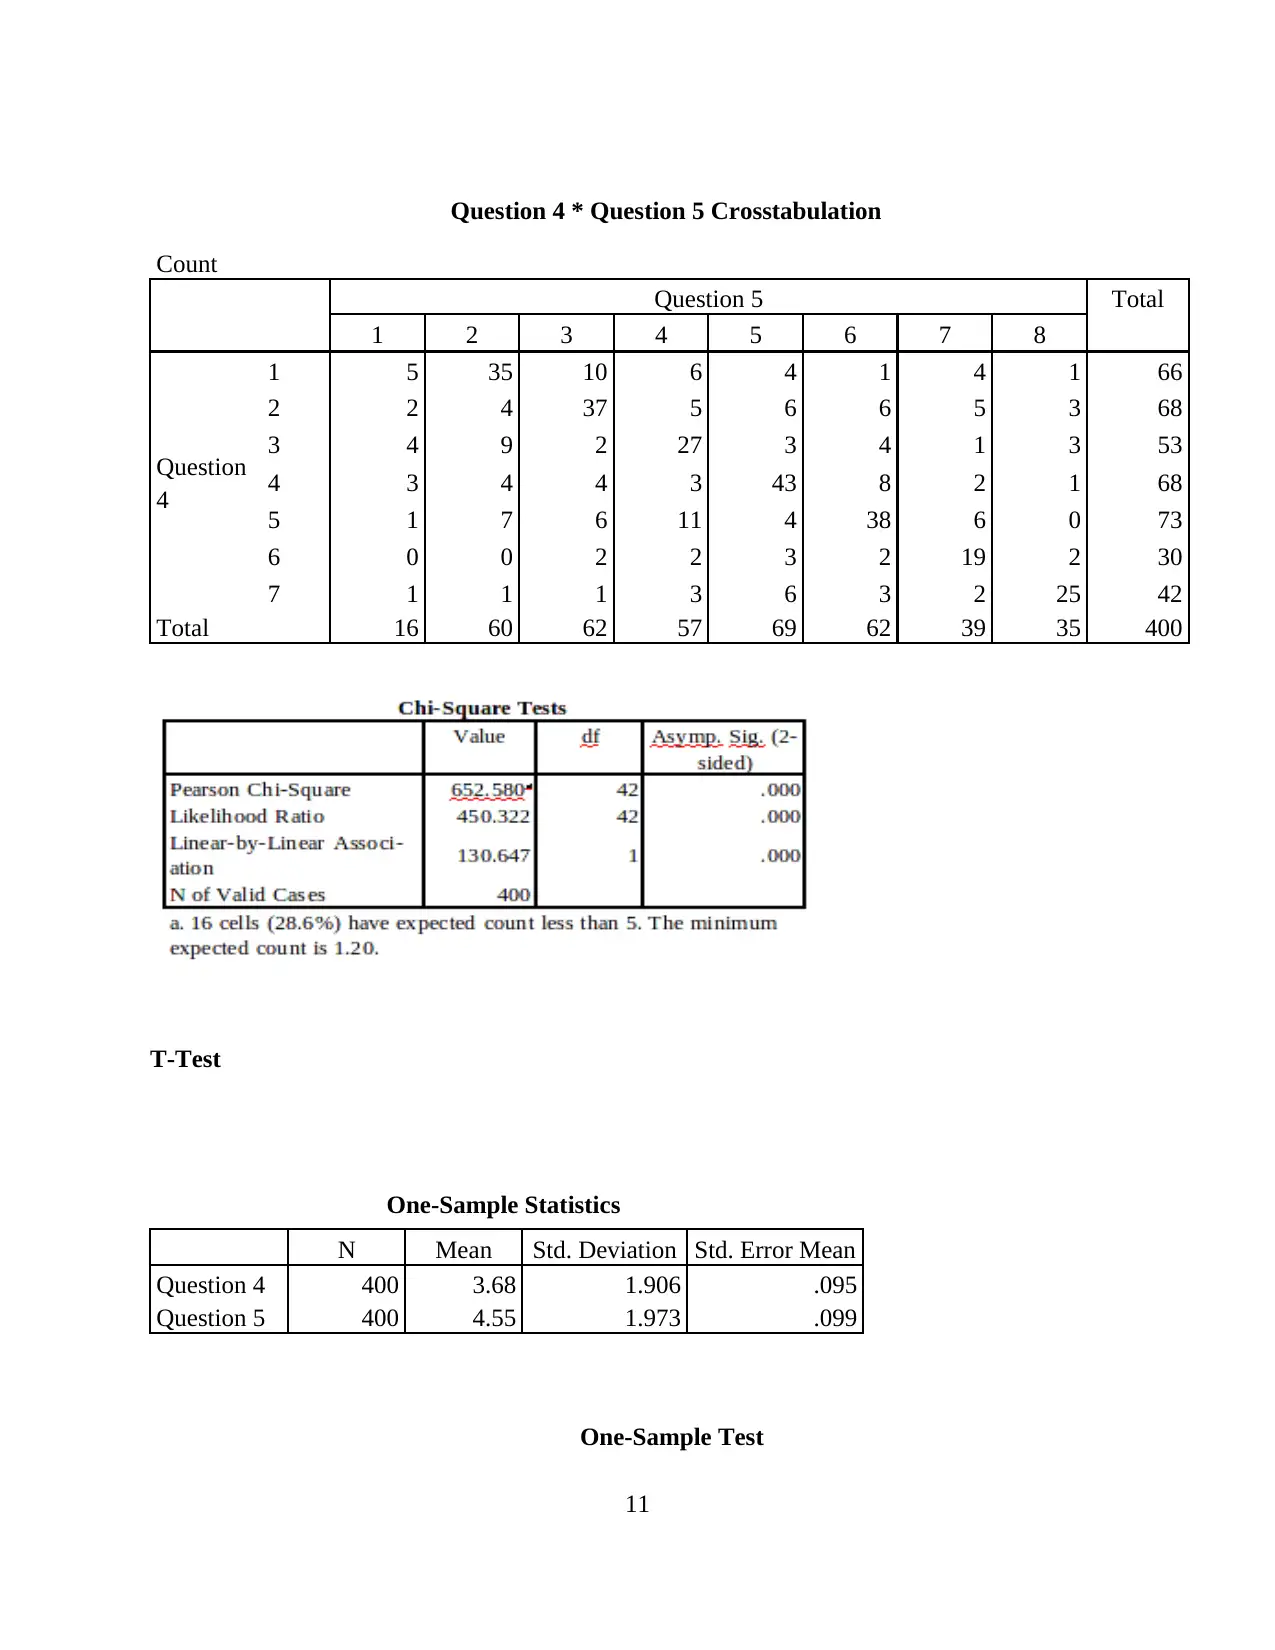
This project, conducted for New Castle Bank (GSBS6002), investigates the effectiveness of its cybersecurity system and customer perceptions of its security measures. The research addresses increasing online fraud, including phishing, pharming, skimming, and malware. Utilizing a quantitative research design, the project collects primary data through surveys to understand customer views. It employs simple random sampling and statistical techniques like Chi-square, t-tests, paired sample t-tests, ANOVA, regression, and correlation to analyze the relationship between variables. The study develops and tests hypotheses related to customer satisfaction with the system, the impact of online fraud experiences, and the effectiveness of assistance in fraud resolution. Ethical considerations, including informed consent and voluntary participation, are maintained throughout the research. The findings, presented through statistical and non-statistical interpretations, offer recommendations to New Castle Bank for enhancing its cybersecurity system and improving customer satisfaction. The project's results indicate significant relationships between the variables analyzed, providing insights into the effectiveness of the cybersecurity system.

GSBS6002 project 2
Paraphrase This Document
Need a fresh take? Get an instant paraphrase of this document with our AI Paraphraser

1

INTRODUCTION
Online frauds are been increasing and thus there is requirement of Cyber security system
which assist in reducing this issues. New Castle bank has decided to conduct the research in
order to identify the effectiveness of the Cyber security system for its development. They are
concerned about the customer perception about this system. There are various online fraud which
take place that consist of Phishing, Pharming, Skimming and malware. The Australian bank is
concerned to resolve this issues in order to create value for their customers to provide them high
satisfaction. It will provide analysis of the data on the basis of the survey conducted to gather the
customers views regarding the system. The research will use the Quantitative research to identify
the in - depth information about the effectiveness of the data to develop the cyber security
system. It will use the various test to identify the correlation between the variables. Moreover,
the research will develop the hypothesis test to identify the relation between the variable. It will
provide information about the ethical consideration which is required to take the consent of the
respondents to disclose the information provided by them. Also, It will provide recommendation
to the New Castle Bank on the basis of views and result provided by the statistical analysis on
the basis of the customer data and responses. In this project, it will provide information about
the effectiveness of Cyber security system. It will help in reducing the online frauds and will
provide security to the customer data.
RESEARCH DESIGN
The research design assist in answering the research questions. With the help of research
design the researcher is able to conduct the research in the effective and efficient way (Okada &
et.al., 2018). The research design assist in gathering the in- depth information about the research
to have relevant data in order to identify the effectiveness of the research which will help the
researcher in completing its research.
Data Collection : This method is used to collect the information or data regarding the
research to identify the in - depth information about the topic to have better understanding and
knowledge regarding the research. There are two methods of data collection one is primary and
other is secondary. The primary data uses the first hand information about the research which
include the use of questionnaire, interviews etc. to gather the information through the views of
respondents to identify their opinions and views (Green & Salkind, 2016). Secondary data is the
information which is collected through the use of published sources which consist of internet,
2
⊘ This is a preview!⊘
Do you want full access?
Subscribe today to unlock all pages.

Trusted by 1+ million students worldwide

books, journals etc. In this research. Primary data collection method will be used to gather the
in- depth information about the research.
Sampling : It is using the samples from the large population to gather the information
through the primary sources. There are two sampling methods which consist of probabilistic and
non- probabilistic (Spss, 2016). In this research, simple random sampling method will be used to
gather the data from the sample.
Research design : For conducting the research there are two method which consist of
qualitative and quantitative methods. The qualitative research include the views and opinions of
the respondents. Quantitative research include the number and numerical data to identify the
information and for the conducting the research (Cronk, 2017). The researcher for this research
will use the quantitative data to analyse the data and identify the correlation between the
variables. It will use the statistical data which will be analysed through the use of quantitative
technique.
Research deign assist in identifying the accurate data which is useful for research. Quantitative
research deign is useful in identifying the numerical analysis for the research by collecting the
numerical data the correlation between the variables is easily identified through performing the
various test.
Ethical consideration : It refers to using the ethics and norms for conducting the
research. It includes informed consent, voluntary participation of the respondents, confidentiality
etc. are the consideration which must be considered while collecting the information from the
customers (George & Mallery, 2016). The ethical consideration are required to met by the
research for completing its research in the effective and efficient manner. In the present research,
The researcher has taken the informed consent of the respondents to disclose their information.
Moreover, the survey conducted by the researcher include the voluntary participation of the
respondents.
So, it is identified that the research design include the various methods which are
required for conducting there search and collecting the data for the analysis to derive effective
results.
3
Paraphrase This Document
Need a fresh take? Get an instant paraphrase of this document with our AI Paraphraser

HYPOTHESIS DEVELOPMENT
It is related to developing a hypothesis for the variables to identify the significant relation
or not between the variables (George & Mallery, 2016). The Hypothesis test contains the null
and alternative hypothesis which provide information of there is any relation or not between the
various by processing the data.
The Hypothesis development will provide the relation ship between the variables. This
development will be made for the following :
Hypothesis 1 :
H0 = There is no mean significance difference between satisfaction with online security
system and times of experiencing online fraud
H1= There is a mean significance difference between satisfaction with online security
system and times of experiencing online fraud
Hypothesis 2 :
H0 = There is no mean significance difference between satisfaction with online security
system and level of advice received with regards to potential online fraud (Larson-Hall, 2015).
H1 = There is mean significance difference between satisfaction with online security
system and level of advice received with regards to potential online fraud.
Hypothesis 3 :
H0 = There is no mean significance difference between level of assistance and quick
response towards fraud complaints.
H1 = There is mean significance difference between level of assistance and quick
response towards fraud complaints.
Hypothesis 4 :
H0 = There is no mean significance difference between quick resolution and level of
metal and social support victims of fraud.
H1= There is mean significance difference between quick resolution and level of metal
and social support victims of fraud.
Statistical Technique and Justification
The hypothesis will be tested through t statistical techniques which are as follows :
Chi square test : It is the test used for determining the difference between the expected
frequencies with that of actual. It assists in identifying the relationship between the two variables
4

T - test : It is the term used in statistics to determine if there is significant relationship
between the mean of the group of variables( Yockey, 2017). It is used in Hypothesis test to
compare the means of two groups.
Paired sample T- test : It is also known as dependent sample T- test. It is used to
determine whether the mean difference between the observations is zero. The set of observation
is measured twice which leads to pair of observation (Miller, 2017). As per this sample T- test, if
the mean of two variables is from related samples than it is paired sample T- test.
Independent sample T - test : It is used to compare the means of two independent group
top identify the significant difference between them (Hayes, 2016). For comparing the mean of
two variables from unrelated sample the independent sample T- test is used.
ANOVA : It is analysis of the variance between two or more means. For identifying the
deviation in the means of the groups this test is performed which provide information about the
variance in the means of group (Brace, Snelgar & Kemp, 2016).
Regression : It is a statistical tool to identify the relationship between two or more
variables. It is used to examine the relationship between the variables where there is dependent
variable and independent variable. Also, the dependent variables is continuous variables (Hinton
& McMurray, 2017).
Correlation : In this technique the variables used are independent that means there is no
dependent variables in the group (Park, 2015). The variables used in the observation are
continuous. It assists in identifying the relationship between the independent variables.
Results, Statistical and Non statistical interpretation
Hypothesis 1
Chi- Square
5
⊘ This is a preview!⊘
Do you want full access?
Subscribe today to unlock all pages.

Trusted by 1+ million students worldwide

Question 2 * Question 4 Crosstabulation
Count
Question 4 Total
1 2 3 4 5 6 7
Question 2
1 12 8 7 8 7 4 6 52
2 24 19 7 7 6 2 4 69
3 19 22 14 6 7 3 4 75
4 7 12 18 16 9 2 5 69
5 4 4 6 24 14 1 3 56
6 0 1 1 7 18 1 1 29
7 0 2 0 0 12 12 5 31
8 0 0 0 0 0 5 10 15
9 0 0 0 0 0 0 4 4
Total 66 68 53 68 73 30 42 400
T-Test
One-Sample Statistics
N Mean Std. Deviation Std. Error Mean
Question 2 400 3.80 1.998 .100
Question 4 400 3.68 1.906 .095
6
Paraphrase This Document
Need a fresh take? Get an instant paraphrase of this document with our AI Paraphraser

Paired T-Test
Paired Samples Test
Paired Differences t df Sig. (2-
tailed)Mean Std.
Deviatio
n
Std.
Error
Mean
95% Confidence
Interval of the
Difference
Lower Upper
Pair
1
Question 2 -
Question 4 .115 1.989 .099 -.081 .311 1.156 399 .248
7
Paired Samples Test
Paired Differences t df Sig. (2-
tailed)Mean Std.
Deviatio
n
Std.
Error
Mean
95% Confidence
Interval of the
Difference
Lower Upper
Pair
1
Question 2 -
Question 4 .115 1.989 .099 -.081 .311 1.156 399 .248
7

Pair
2
Question 4 -
Question 2 -.115 1.989 .099 -.311 .081 -
1.156 399 .248
8
2
Question 4 -
Question 2 -.115 1.989 .099 -.311 .081 -
1.156 399 .248
8
⊘ This is a preview!⊘
Do you want full access?
Subscribe today to unlock all pages.

Trusted by 1+ million students worldwide

Coefficientsa
Model Unstandardized
Coefficients
Standardiz
ed
Coefficient
s
t Sig. 95.0% Confidence
Interval for B
B Std. Error Beta Lower
Bound
Upper
Bound
1
(Constan
t) 1.937 .180 10.783 .000 1.584 2.290
Question
2 .459 .042 .482 10.963 .000 .377 .542
a. Dependent Variable: Question 4
Correlation:
9
Model Unstandardized
Coefficients
Standardiz
ed
Coefficient
s
t Sig. 95.0% Confidence
Interval for B
B Std. Error Beta Lower
Bound
Upper
Bound
1
(Constan
t) 1.937 .180 10.783 .000 1.584 2.290
Question
2 .459 .042 .482 10.963 .000 .377 .542
a. Dependent Variable: Question 4
Correlation:
9
Paraphrase This Document
Need a fresh take? Get an instant paraphrase of this document with our AI Paraphraser

Interpretation: From the above statistical data it is identified that there is significant
relationship between the variables as identified by processing the different test. As per Chi –
Square test it is determined that the significance level is less than 0.05 which shows that there is
positive relation. Moreover, the relationship shown through the use of test of relationship which
contains the regression and correlation(Pituch & Stevens, 2015 ). The regression analysis shows
that the variables are related to each other by 23%. Also, the correlation analysis shows the
significance of .000 which shows that there is positive relationship (H1).
Hypothesis 2
Chi – square
10

Question 4 * Question 5 Crosstabulation
Count
Question 5 Total
1 2 3 4 5 6 7 8
Question
4
1 5 35 10 6 4 1 4 1 66
2 2 4 37 5 6 6 5 3 68
3 4 9 2 27 3 4 1 3 53
4 3 4 4 3 43 8 2 1 68
5 1 7 6 11 4 38 6 0 73
6 0 0 2 2 3 2 19 2 30
7 1 1 1 3 6 3 2 25 42
Total 16 60 62 57 69 62 39 35 400
T-Test
One-Sample Statistics
N Mean Std. Deviation Std. Error Mean
Question 4 400 3.68 1.906 .095
Question 5 400 4.55 1.973 .099
One-Sample Test
11
⊘ This is a preview!⊘
Do you want full access?
Subscribe today to unlock all pages.

Trusted by 1+ million students worldwide
1 out of 29
Related Documents

Your All-in-One AI-Powered Toolkit for Academic Success.
+13062052269
info@desklib.com
Available 24*7 on WhatsApp / Email
Unlock your academic potential
Copyright © 2020–2025 A2Z Services. All Rights Reserved. Developed and managed by ZUCOL.