Investment Analysis and Financial Health of Newcrest Mining Ltd
VerifiedAdded on 2023/06/11
|15
|2115
|434
Report
AI Summary
This report provides a financial analysis of Newcrest Mining, an ASX-listed gold mining company, to assess its investment potential. It examines the company's income statement, balance sheet, and key financial ratios, including liquidity, efficiency, profitability, and financing ratios. The analysis considers both financial and non-financial information, such as annual reports and news articles, to provide a comprehensive view of the company's performance. The report concludes that Newcrest Mining presents a promising investment opportunity due to its brand awareness, sound balance sheet, positive cash flows, and expected future profit growth, making it a potentially profitable investment for investors. Desklib offers a range of similar solved assignments and past papers for students.
MBA Assignment
Paraphrase This Document
Need a fresh take? Get an instant paraphrase of this document with our AI Paraphraser
Contents
Executive Summary.........................................................................................................................3
Introduction......................................................................................................................................4
Analysis...........................................................................................................................................4
Ratios...............................................................................................................................................7
Interpretation....................................................................................................................................8
Conclusion.....................................................................................................................................11
Bibliography..................................................................................................................................11
Appendix........................................................................................................................................13
Executive Summary
Newcrest is gold mining company which is listed on ASX. The company is having a known
brand name and is quite popular. The study focuses on the financial and non-financial
performance of the company and thereby determines that the company’s liquidity, financial and
profitability position is adequate for the investors who are looking forward to investing in the
company. Not only this the non-financial performance of the company reveals that company is
expecting good profits in coming time and is also planning to implement performance edge
improvement program for leveraging opportunities.
⊘ This is a preview!⊘
Do you want full access?
Subscribe today to unlock all pages.
Trusted by 1+ million students worldwide
Introduction
Newcrest company is a known gold mining company in the world. The company is known to
safely deliver the superior returns to their stakeholder from developing the gold and copper
mines. The vision of the company is to be the first choice for their customers, shareholders, and
suppliers. The primary actions of the company take place in Ridgeway Australia. In 2010
company successfully merged with Lihir Gold. The company is having string track record of
determining the deposits over the Gosowong. This report illustrates the financial and non-
financial performance of the company so as to help the investors in understanding whether they
should invest in the company or not (Newcrest, 2017).
Analysis
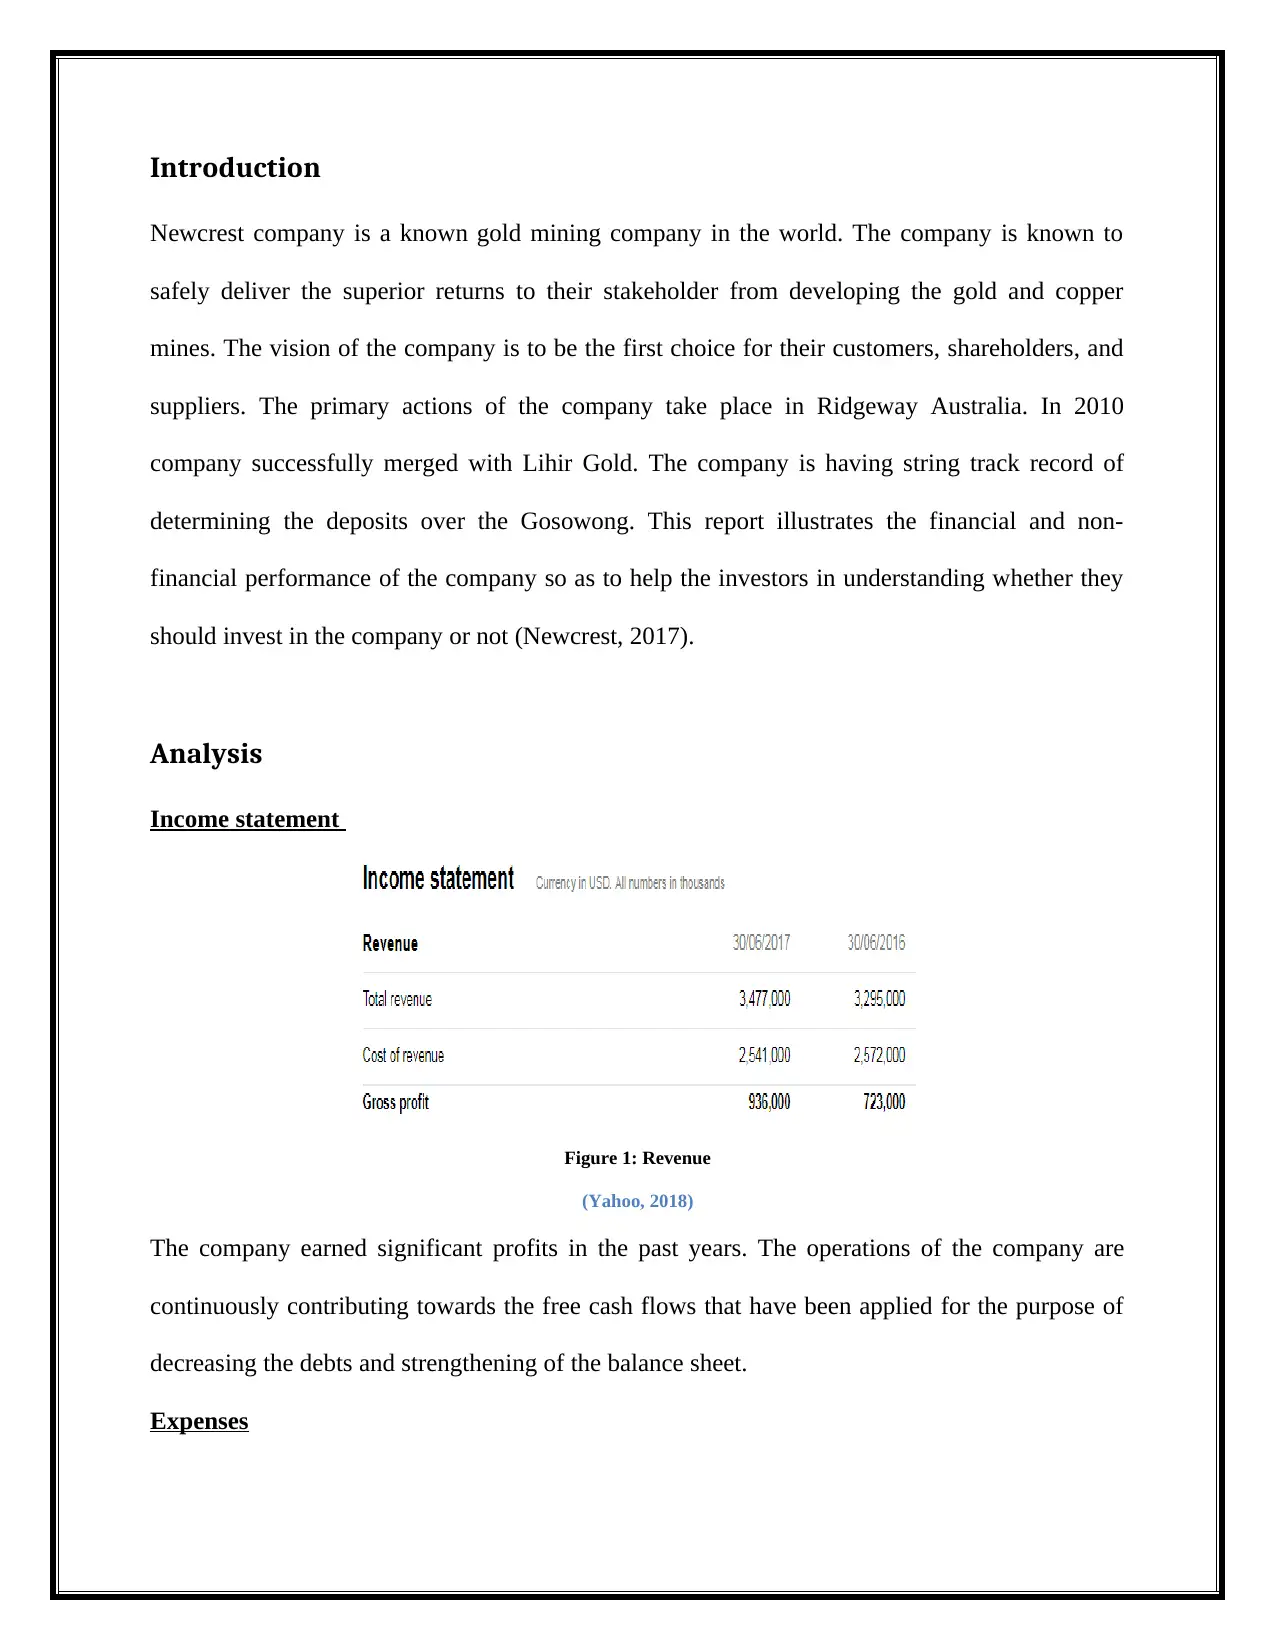
Income statement
Figure 1: Revenue
(Yahoo, 2018)
The company earned significant profits in the past years. The operations of the company are
continuously contributing towards the free cash flows that have been applied for the purpose of
decreasing the debts and strengthening of the balance sheet.
Expenses
Newcrest company is a known gold mining company in the world. The company is known to
safely deliver the superior returns to their stakeholder from developing the gold and copper
mines. The vision of the company is to be the first choice for their customers, shareholders, and
suppliers. The primary actions of the company take place in Ridgeway Australia. In 2010
company successfully merged with Lihir Gold. The company is having string track record of
determining the deposits over the Gosowong. This report illustrates the financial and non-
financial performance of the company so as to help the investors in understanding whether they
should invest in the company or not (Newcrest, 2017).
Analysis
Income statement
Figure 1: Revenue
(Yahoo, 2018)
The company earned significant profits in the past years. The operations of the company are
continuously contributing towards the free cash flows that have been applied for the purpose of
decreasing the debts and strengthening of the balance sheet.
Expenses
Paraphrase This Document
Need a fresh take? Get an instant paraphrase of this document with our AI Paraphraser
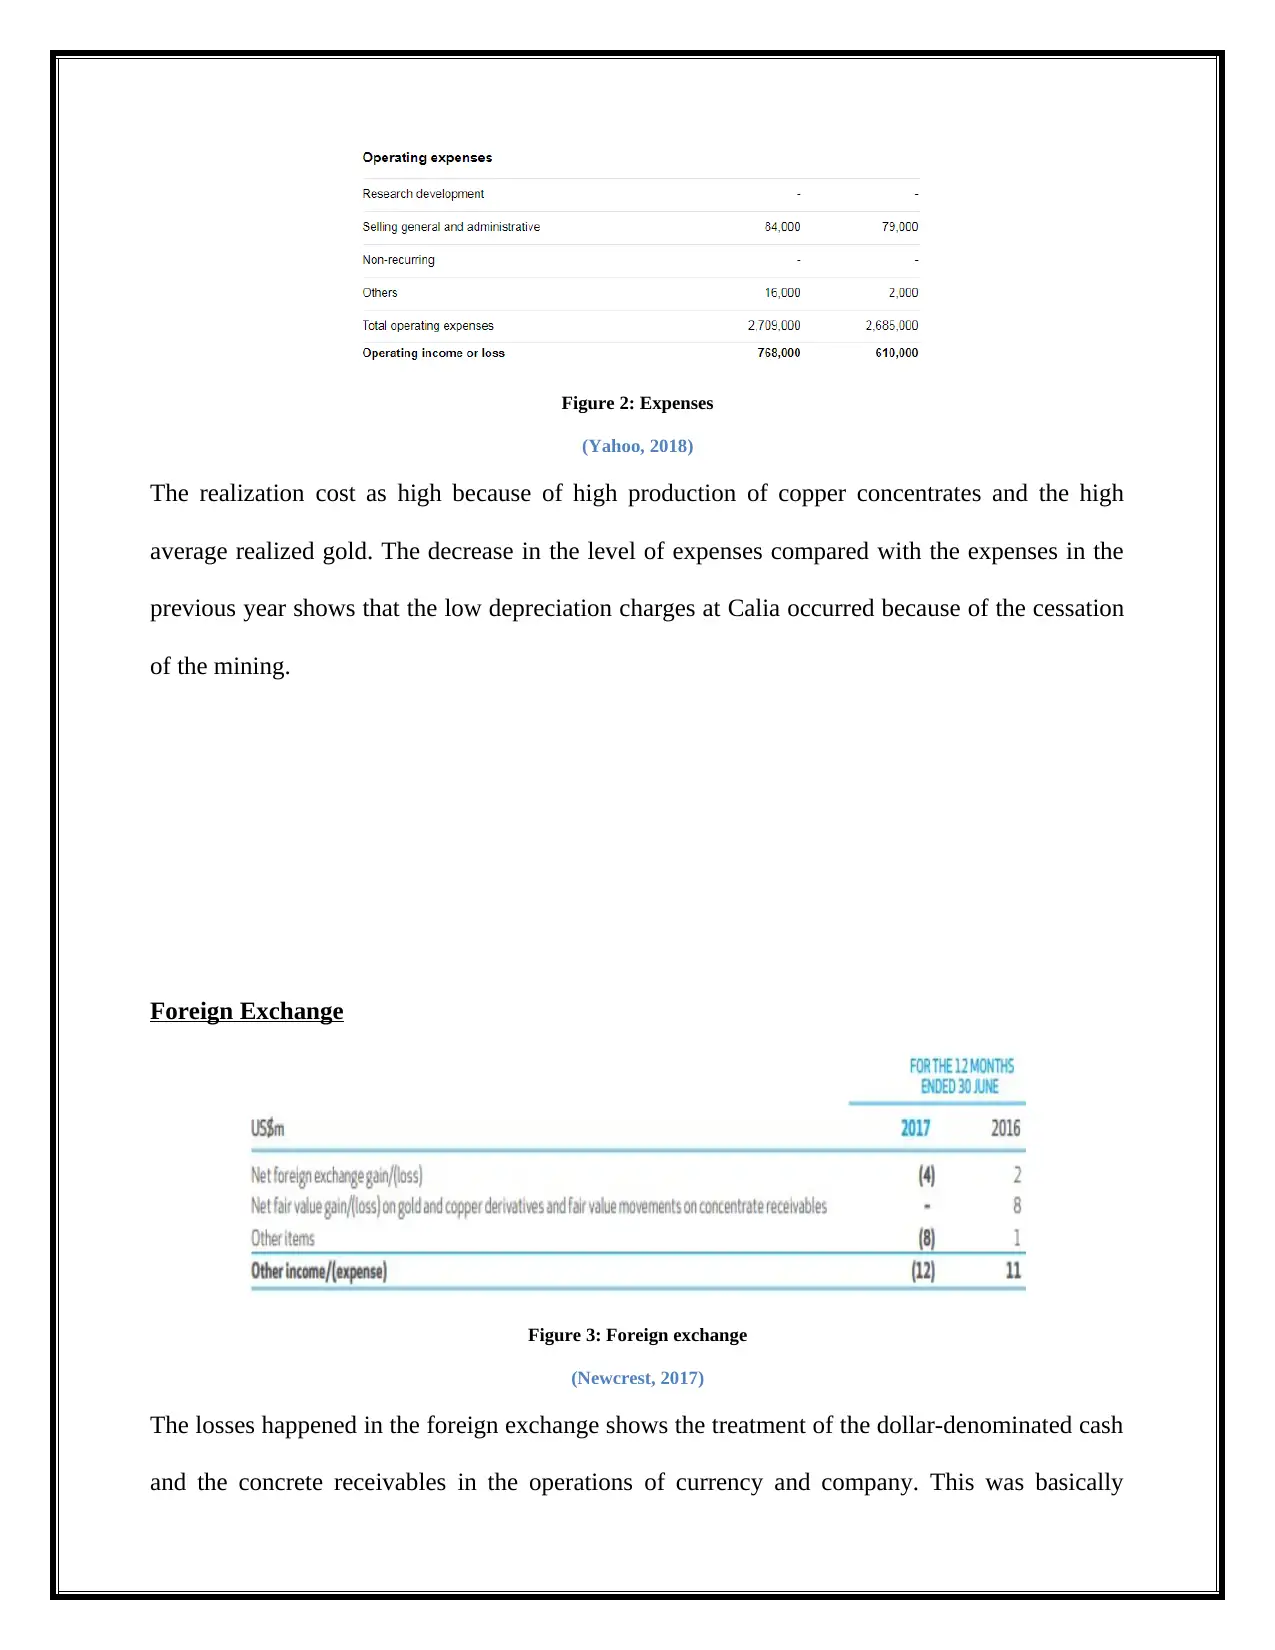
Figure 2: Expenses
(Yahoo, 2018)
The realization cost as high because of high production of copper concentrates and the high
average realized gold. The decrease in the level of expenses compared with the expenses in the
previous year shows that the low depreciation charges at Calia occurred because of the cessation
of the mining.
Foreign Exchange
Figure 3: Foreign exchange
(Newcrest, 2017)
The losses happened in the foreign exchange shows the treatment of the dollar-denominated cash
and the concrete receivables in the operations of currency and company. This was basically
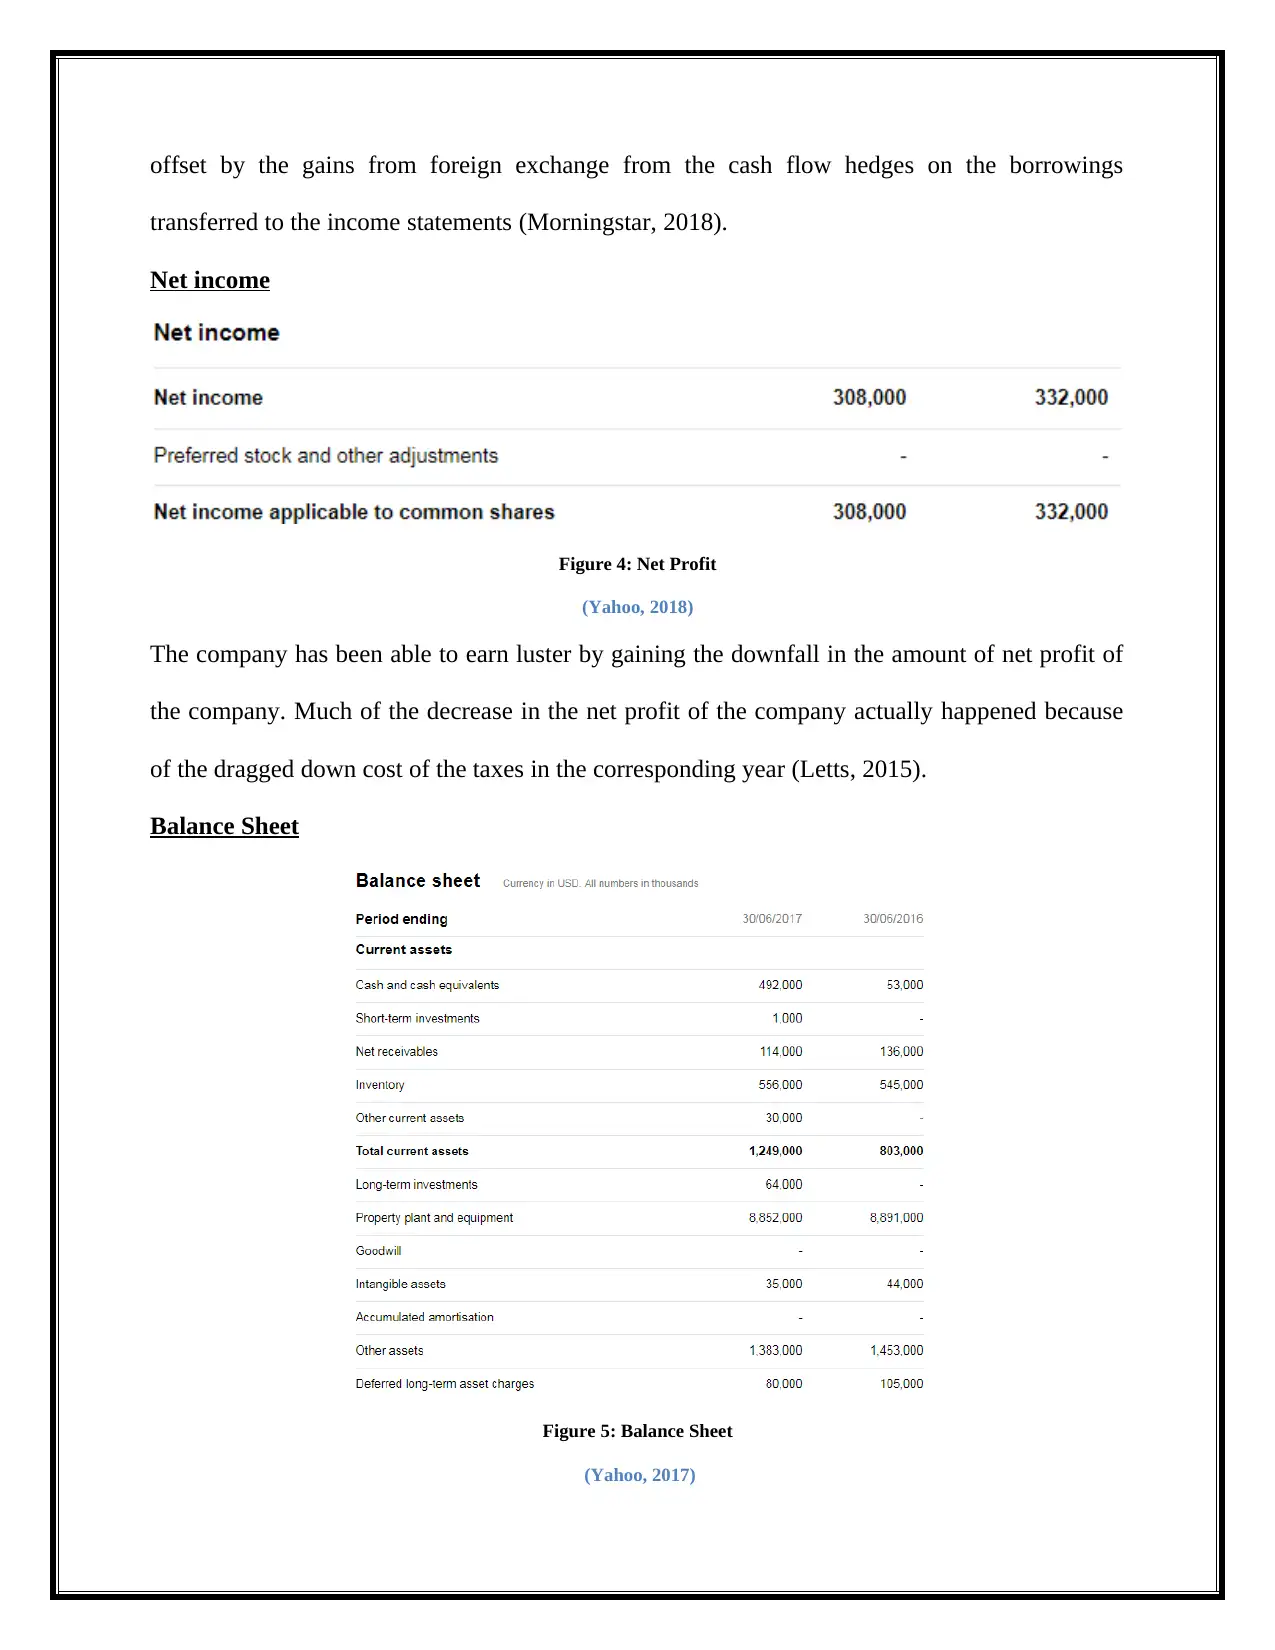
offset by the gains from foreign exchange from the cash flow hedges on the borrowings
transferred to the income statements (Morningstar, 2018).
Net income
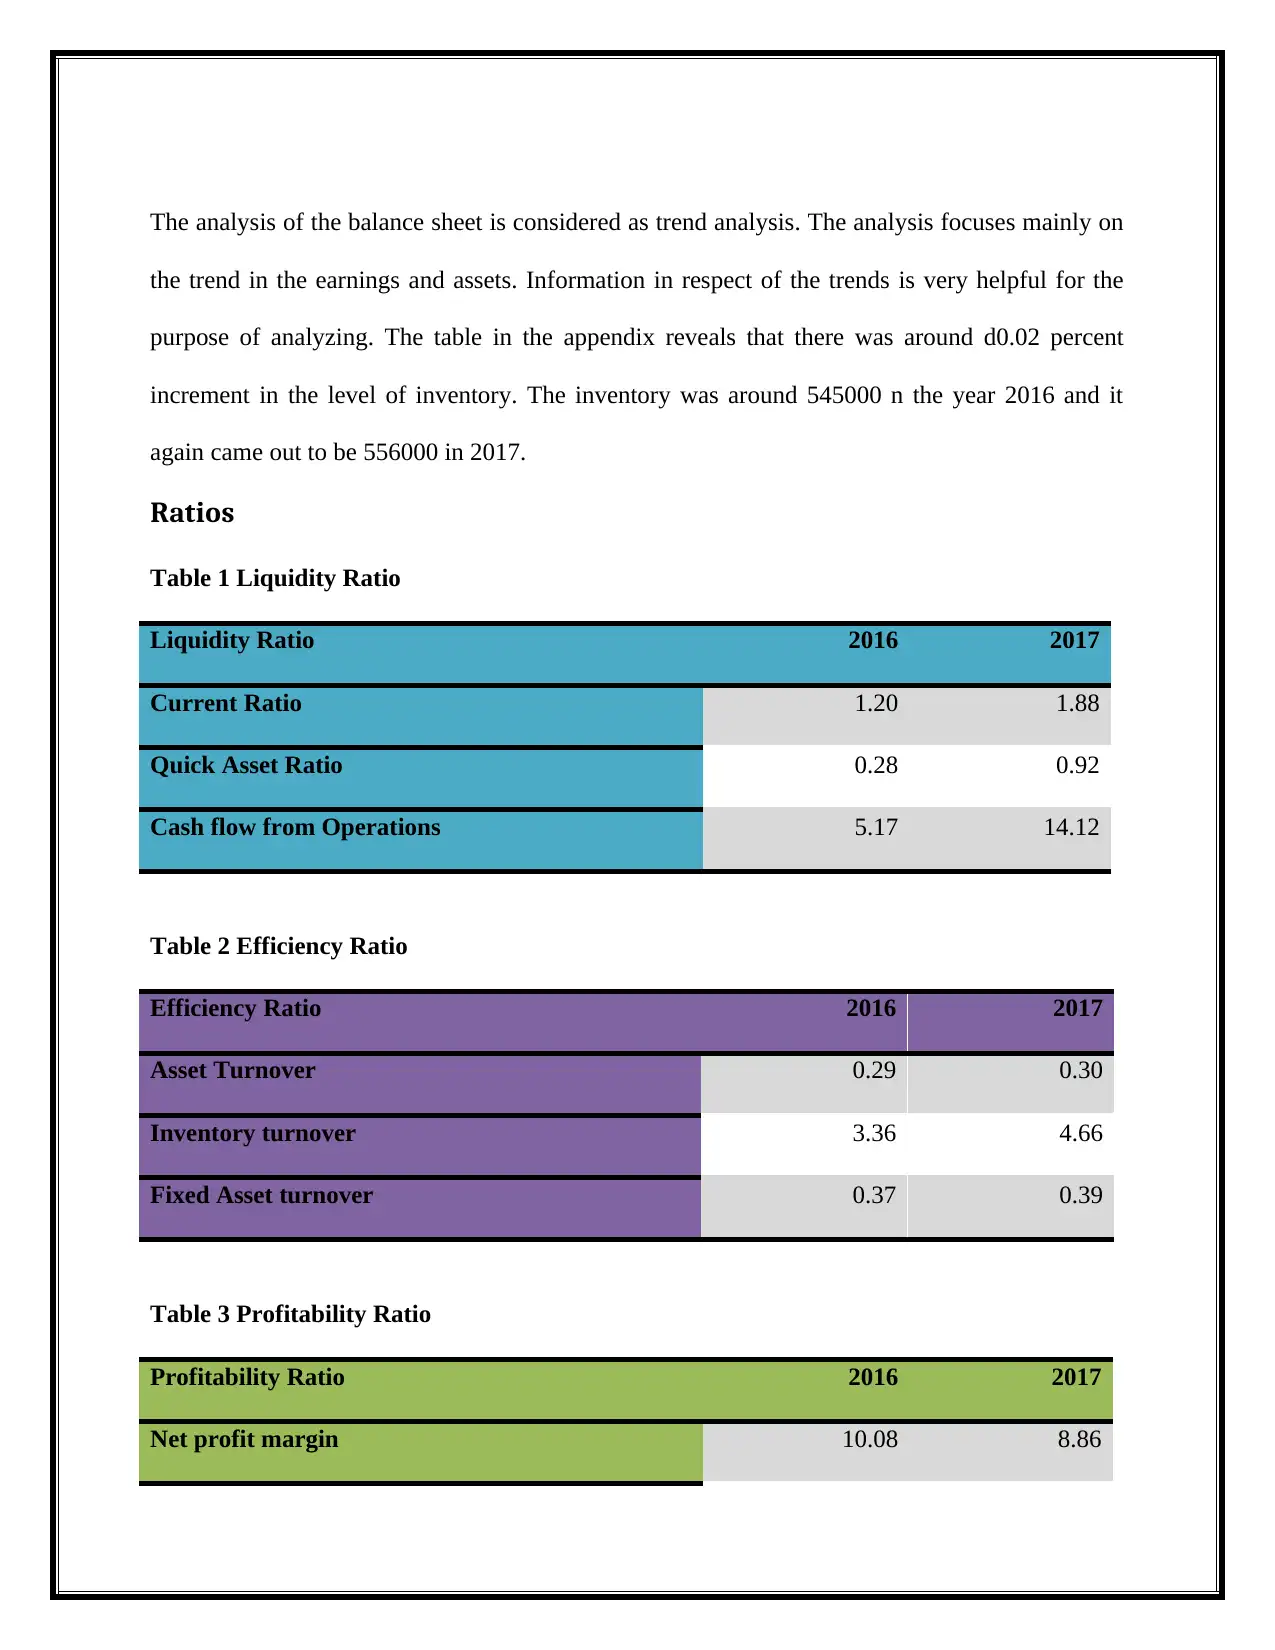
Figure 4: Net Profit
(Yahoo, 2018)
The company has been able to earn luster by gaining the downfall in the amount of net profit of
the company. Much of the decrease in the net profit of the company actually happened because
of the dragged down cost of the taxes in the corresponding year (Letts, 2015).
Balance Sheet
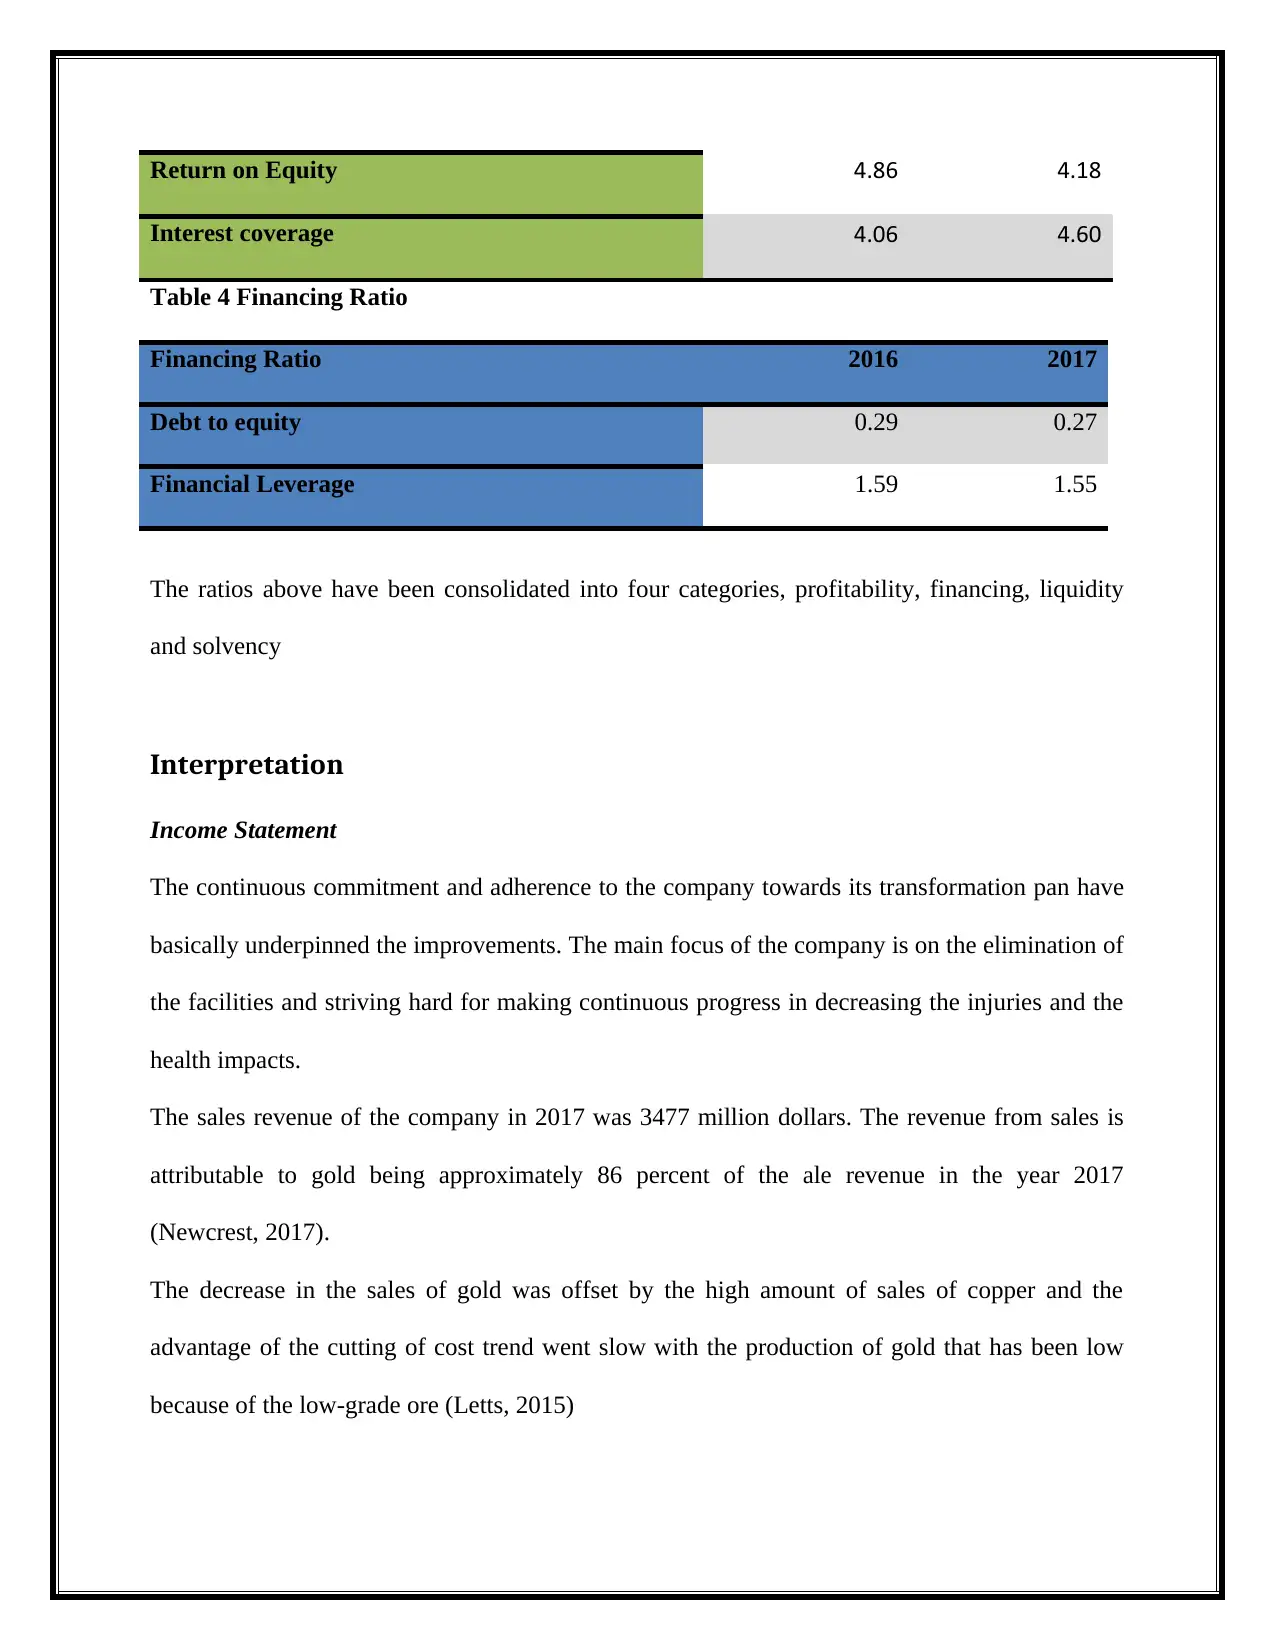
Figure 5: Balance Sheet
(Yahoo, 2017)
transferred to the income statements (Morningstar, 2018).
Net income
Figure 4: Net Profit
(Yahoo, 2018)
The company has been able to earn luster by gaining the downfall in the amount of net profit of
the company. Much of the decrease in the net profit of the company actually happened because
of the dragged down cost of the taxes in the corresponding year (Letts, 2015).
Balance Sheet
Figure 5: Balance Sheet
(Yahoo, 2017)
⊘ This is a preview!⊘
Do you want full access?
Subscribe today to unlock all pages.
Trusted by 1+ million students worldwide
The analysis of the balance sheet is considered as trend analysis. The analysis focuses mainly on
the trend in the earnings and assets. Information in respect of the trends is very helpful for the
purpose of analyzing. The table in the appendix reveals that there was around d0.02 percent
increment in the level of inventory. The inventory was around 545000 n the year 2016 and it
again came out to be 556000 in 2017.
Ratios
Table 1 Liquidity Ratio
Liquidity Ratio 2016 2017
Current Ratio 1.20 1.88
Quick Asset Ratio 0.28 0.92
Cash flow from Operations 5.17 14.12
Table 2 Efficiency Ratio
Efficiency Ratio 2016 2017
Asset Turnover 0.29 0.30
Inventory turnover 3.36 4.66
Fixed Asset turnover 0.37 0.39
Table 3 Profitability Ratio
Profitability Ratio 2016 2017
Net profit margin 10.08 8.86
Paraphrase This Document
Need a fresh take? Get an instant paraphrase of this document with our AI Paraphraser
Return on Equity 4.86 4.18
Interest coverage 4.06 4.60
Table 4 Financing Ratio
Financing Ratio 2016 2017
Debt to equity 0.29 0.27
Financial Leverage 1.59 1.55
The ratios above have been consolidated into four categories, profitability, financing, liquidity
and solvency
Interpretation
Income Statement
The continuous commitment and adherence to the company towards its transformation pan have
basically underpinned the improvements. The main focus of the company is on the elimination of
the facilities and striving hard for making continuous progress in decreasing the injuries and the
health impacts.
The sales revenue of the company in 2017 was 3477 million dollars. The revenue from sales is
attributable to gold being approximately 86 percent of the ale revenue in the year 2017
(Newcrest, 2017).
The decrease in the sales of gold was offset by the high amount of sales of copper and the
advantage of the cutting of cost trend went slow with the production of gold that has been low
because of the low-grade ore (Letts, 2015)
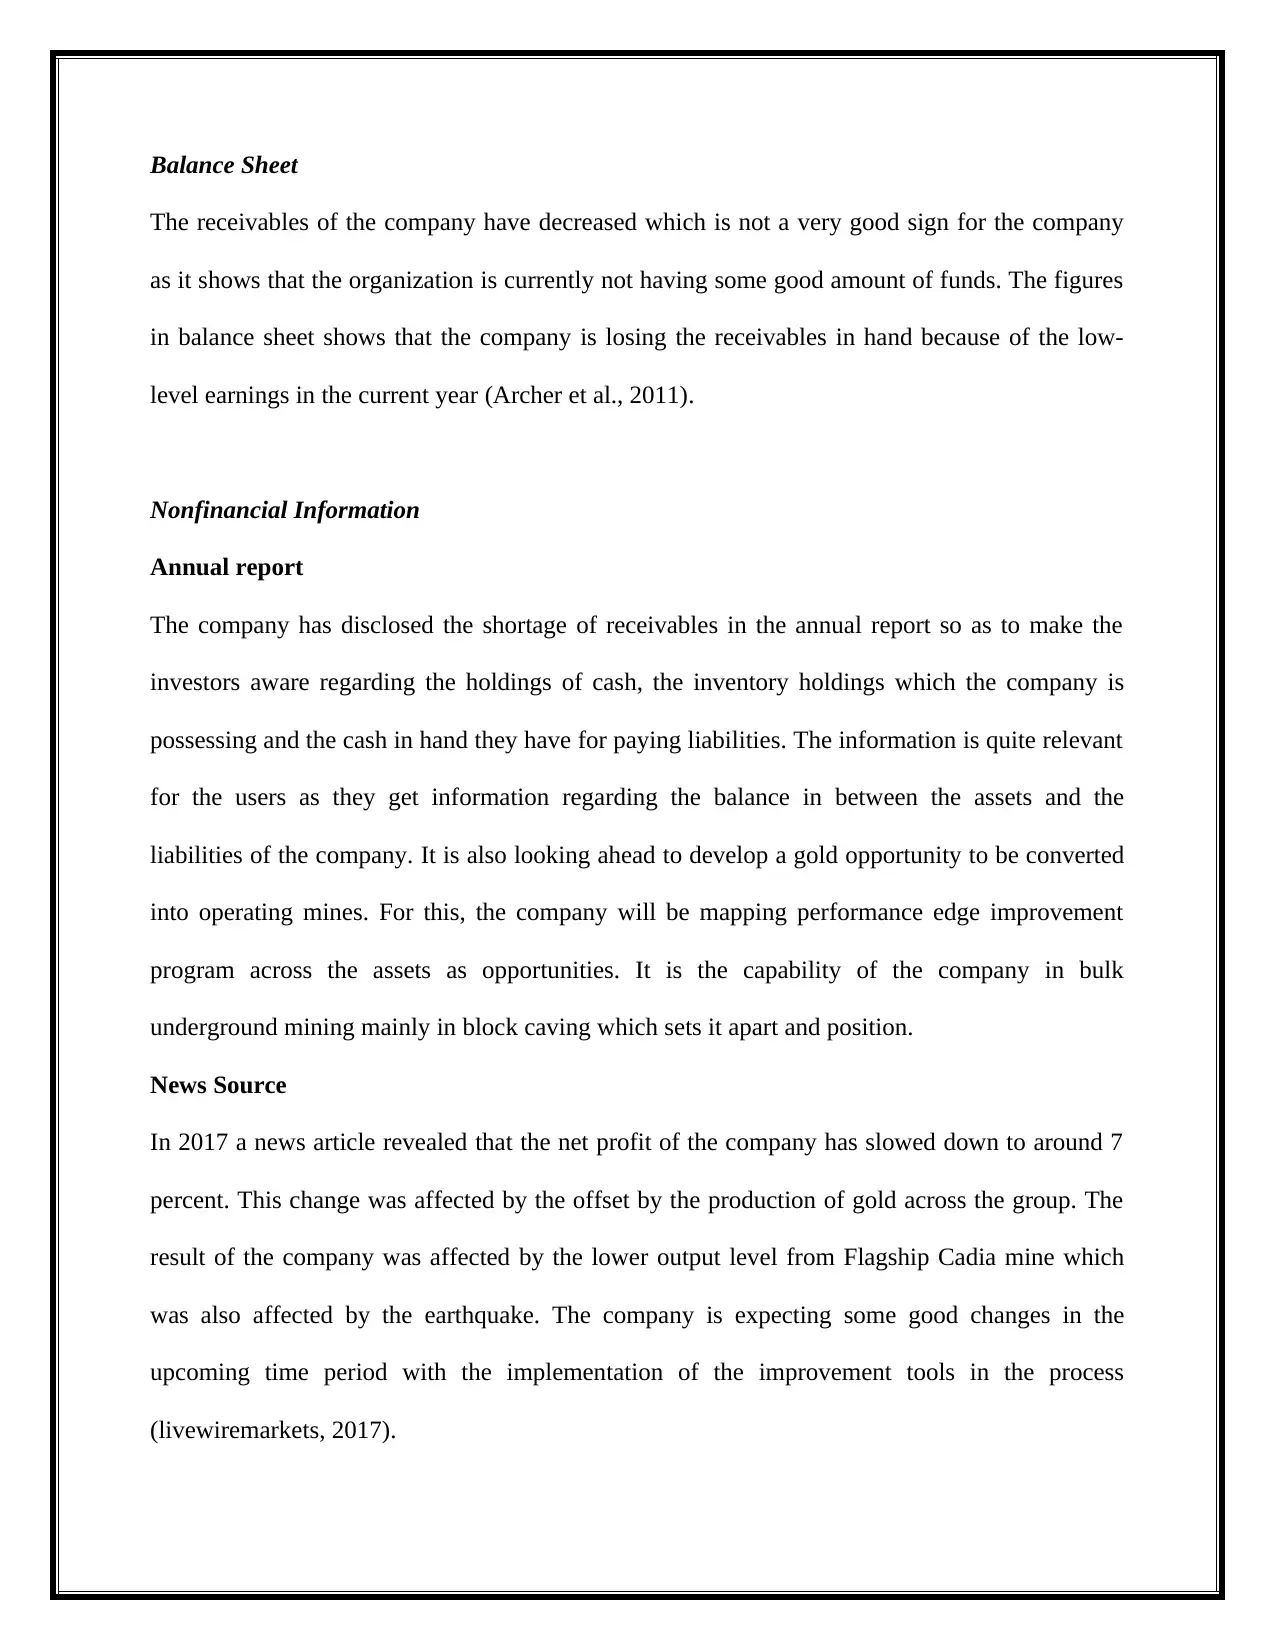
Balance Sheet
The receivables of the company have decreased which is not a very good sign for the company
as it shows that the organization is currently not having some good amount of funds. The figures
in balance sheet shows that the company is losing the receivables in hand because of the low-
level earnings in the current year (Archer et al., 2011).
Nonfinancial Information
Annual report
The company has disclosed the shortage of receivables in the annual report so as to make the
investors aware regarding the holdings of cash, the inventory holdings which the company is
possessing and the cash in hand they have for paying liabilities. The information is quite relevant
for the users as they get information regarding the balance in between the assets and the
liabilities of the company. It is also looking ahead to develop a gold opportunity to be converted
into operating mines. For this, the company will be mapping performance edge improvement
program across the assets as opportunities. It is the capability of the company in bulk
underground mining mainly in block caving which sets it apart and position.
News Source
In 2017 a news article revealed that the net profit of the company has slowed down to around 7
percent. This change was affected by the offset by the production of gold across the group. The
result of the company was affected by the lower output level from Flagship Cadia mine which
was also affected by the earthquake. The company is expecting some good changes in the
upcoming time period with the implementation of the improvement tools in the process
(livewiremarkets, 2017).
⊘ This is a preview!⊘
Do you want full access?
Subscribe today to unlock all pages.
Trusted by 1+ million students worldwide
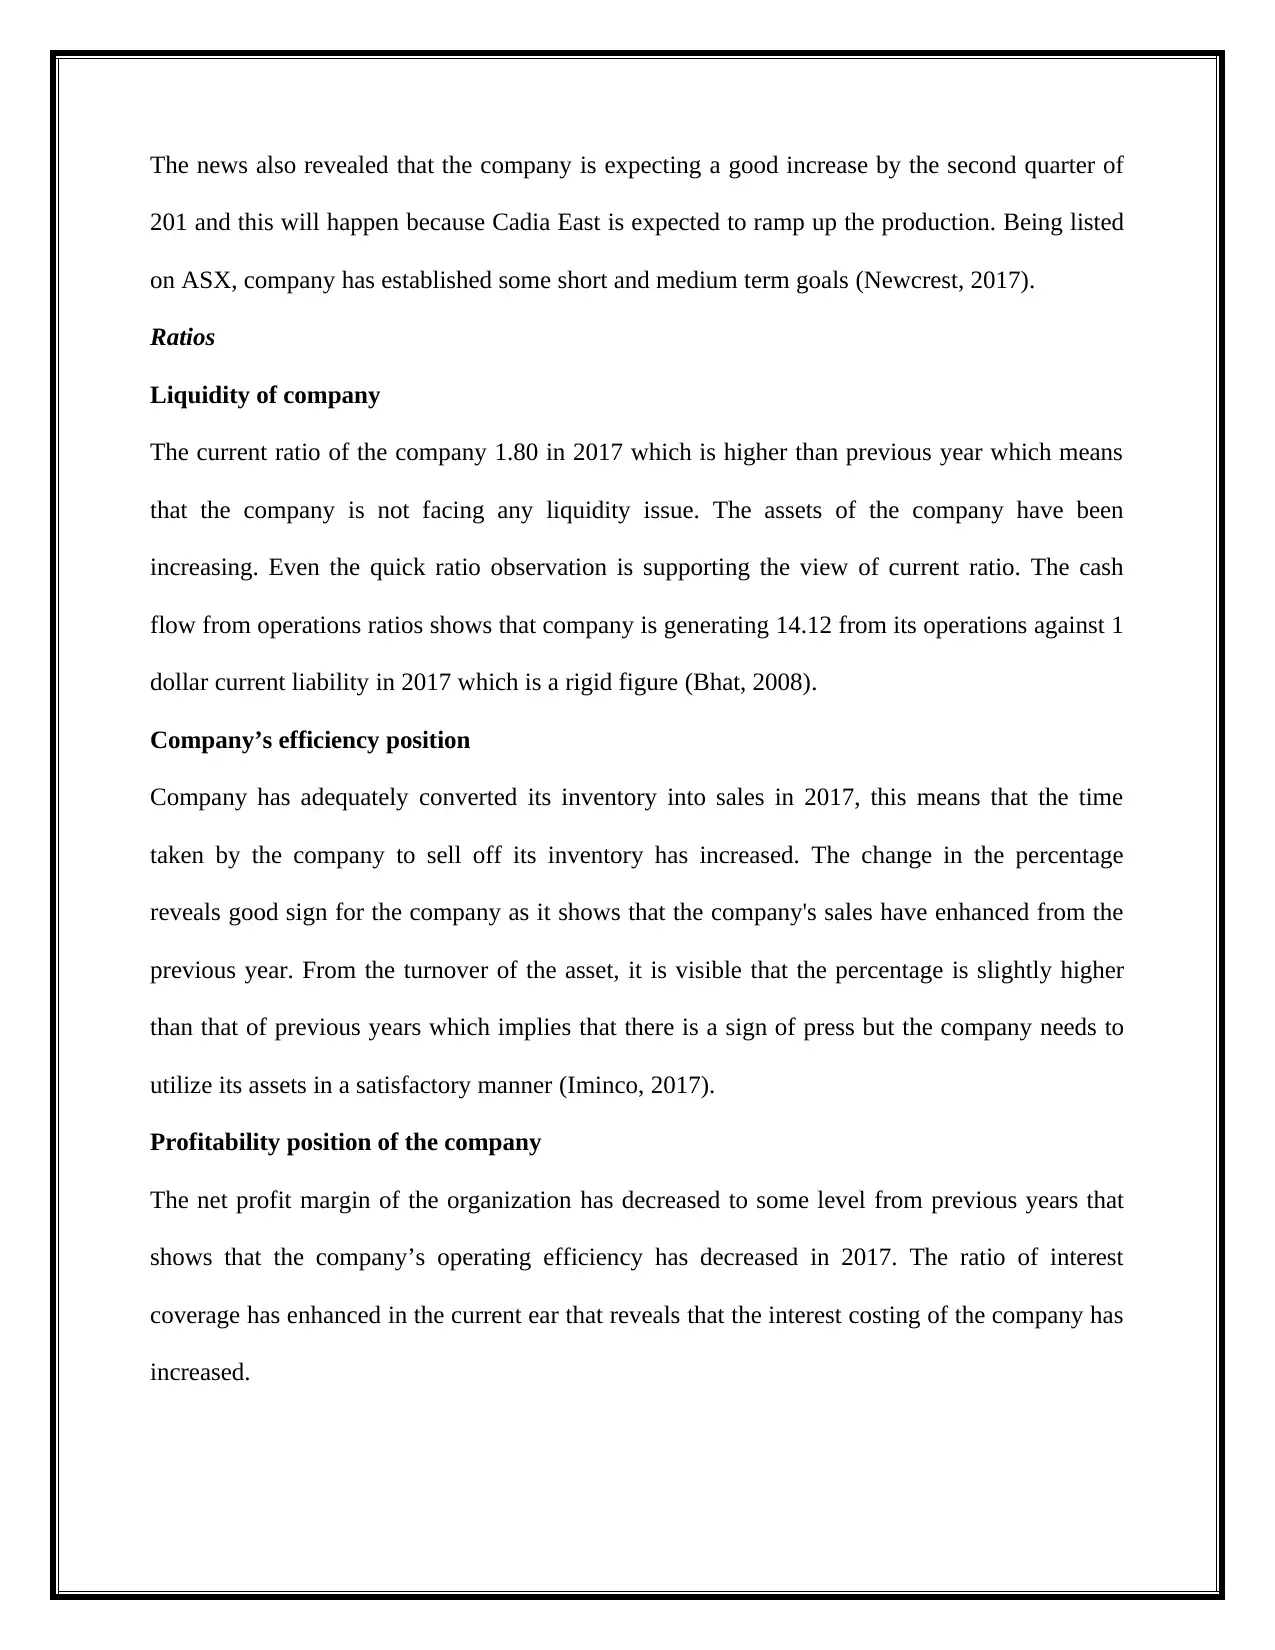
The news also revealed that the company is expecting a good increase by the second quarter of
201 and this will happen because Cadia East is expected to ramp up the production. Being listed
on ASX, company has established some short and medium term goals (Newcrest, 2017).
Ratios
Liquidity of company
The current ratio of the company 1.80 in 2017 which is higher than previous year which means
that the company is not facing any liquidity issue. The assets of the company have been
increasing. Even the quick ratio observation is supporting the view of current ratio. The cash
flow from operations ratios shows that company is generating 14.12 from its operations against 1
dollar current liability in 2017 which is a rigid figure (Bhat, 2008).
Company’s efficiency position
Company has adequately converted its inventory into sales in 2017, this means that the time
taken by the company to sell off its inventory has increased. The change in the percentage
reveals good sign for the company as it shows that the company's sales have enhanced from the
previous year. From the turnover of the asset, it is visible that the percentage is slightly higher
than that of previous years which implies that there is a sign of press but the company needs to
utilize its assets in a satisfactory manner (Iminco, 2017).
Profitability position of the company
The net profit margin of the organization has decreased to some level from previous years that
shows that the company’s operating efficiency has decreased in 2017. The ratio of interest
coverage has enhanced in the current ear that reveals that the interest costing of the company has
increased.
Paraphrase This Document
Need a fresh take? Get an instant paraphrase of this document with our AI Paraphraser
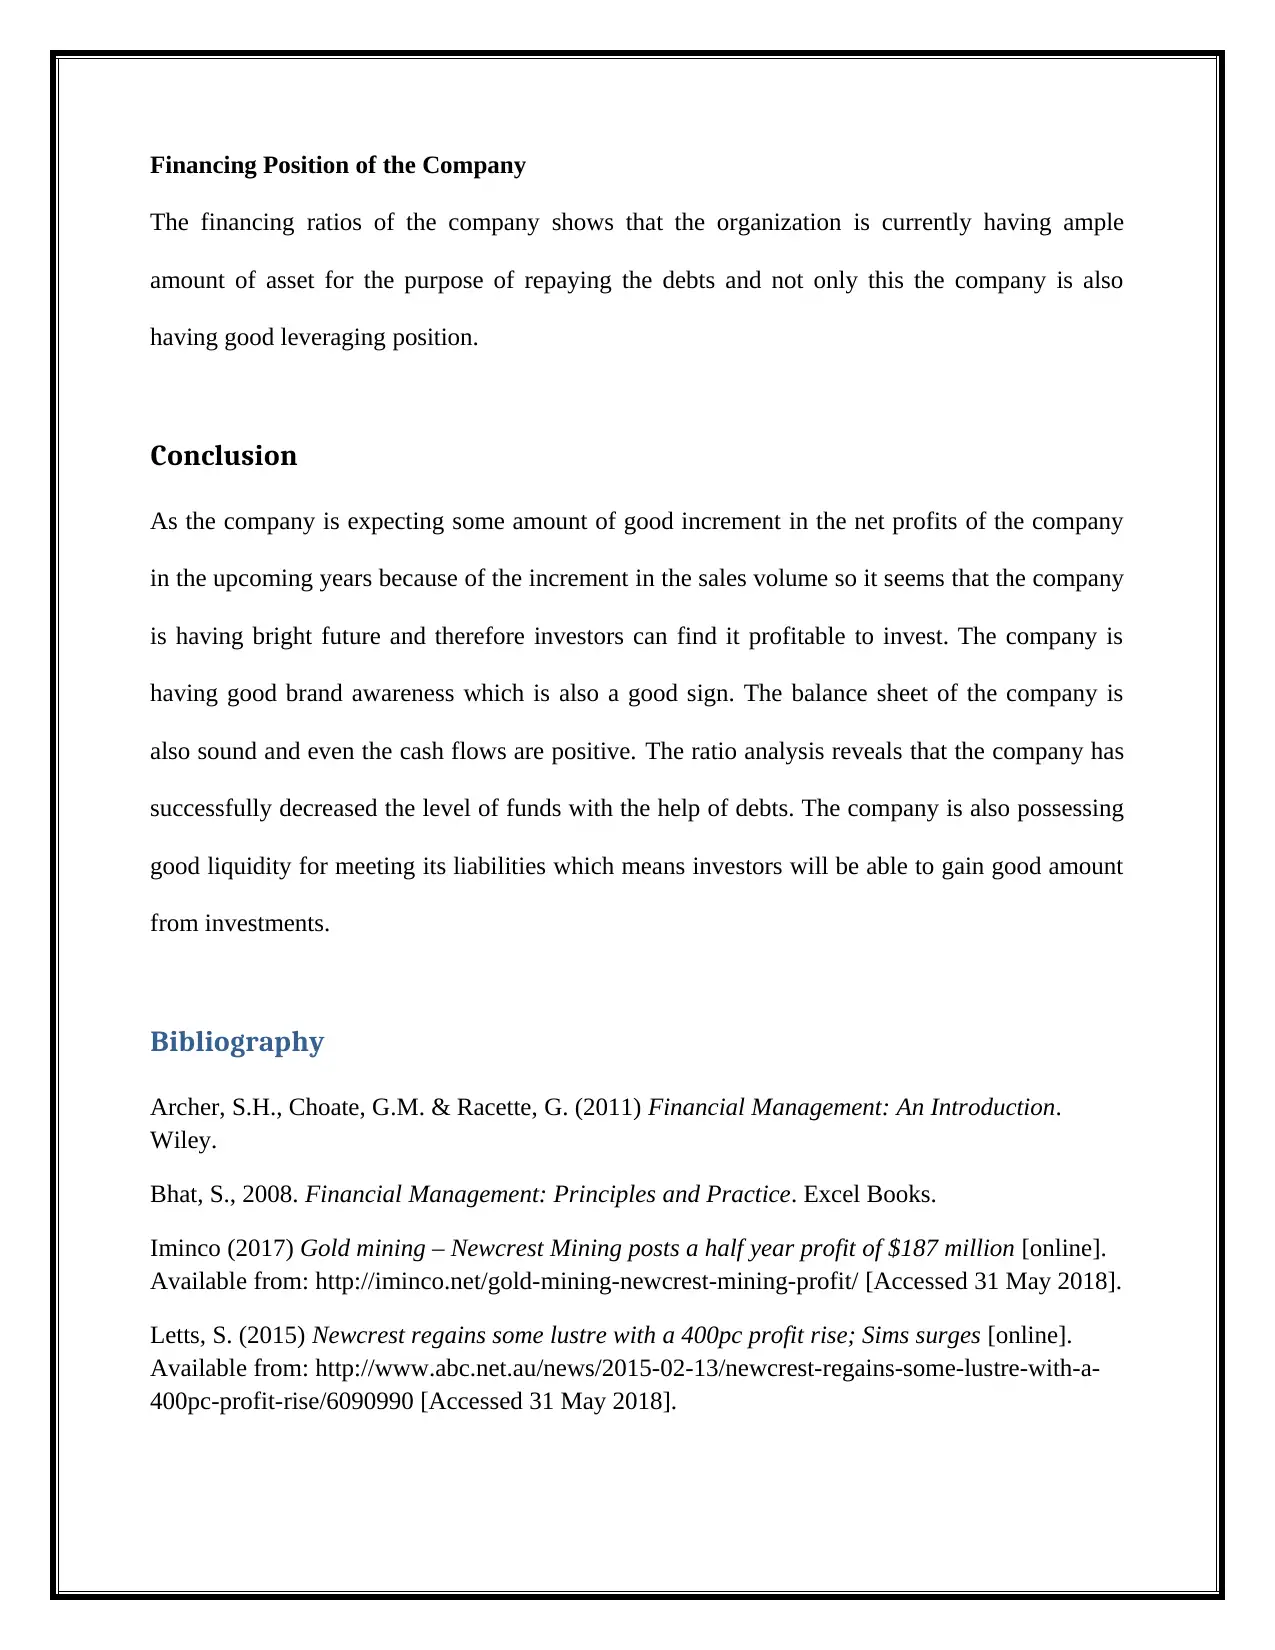
Financing Position of the Company
The financing ratios of the company shows that the organization is currently having ample
amount of asset for the purpose of repaying the debts and not only this the company is also
having good leveraging position.
Conclusion
As the company is expecting some amount of good increment in the net profits of the company
in the upcoming years because of the increment in the sales volume so it seems that the company
is having bright future and therefore investors can find it profitable to invest. The company is
having good brand awareness which is also a good sign. The balance sheet of the company is
also sound and even the cash flows are positive. The ratio analysis reveals that the company has
successfully decreased the level of funds with the help of debts. The company is also possessing
good liquidity for meeting its liabilities which means investors will be able to gain good amount
from investments.
Bibliography
Archer, S.H., Choate, G.M. & Racette, G. (2011) Financial Management: An Introduction.
Wiley.
Bhat, S., 2008. Financial Management: Principles and Practice. Excel Books.
Iminco (2017) Gold mining – Newcrest Mining posts a half year profit of $187 million [online].
Available from: http://iminco.net/gold-mining-newcrest-mining-profit/ [Accessed 31 May 2018].
Letts, S. (2015) Newcrest regains some lustre with a 400pc profit rise; Sims surges [online].
Available from: http://www.abc.net.au/news/2015-02-13/newcrest-regains-some-lustre-with-a-
400pc-profit-rise/6090990 [Accessed 31 May 2018].
livewiremarkets (2017) Newcrest Mining Full Year Result: NCM underlying profit misses
expectations [online]. Available from: https://www.livewiremarkets.com/wires/newcrest-mining-
full-year-result-ncm-underlying-profit-misses-expectations.
Morningstar (2018) Newcrest Mining Ltd [online]. Available from:
http://financials.morningstar.com/income-statement/is.html?
t=NCMGF®ion=usa&culture=en-US [Accessed 31 May 2018].
Newcrest (2017) Annual Report [online]. Available from:
http://www.newcrest.com.au/media/annual_reports/Newcrest_Annual_Report_2017.pdf
[Accessed 30 May 2018].
newcrest (2018) Company summary [online]. Available from:
http://www.newcrest.com.au/investors/company-summary.
newcrest (2018) Profile [online]. Available from: http://www.newcrest.com.au/.
Yahoo (2017) Balance Sheet [online]. Available from:
https://au.finance.yahoo.com/quote/NCM.AX/balance-sheet?p=NCM.AX.
Yahoo (2018) Income statement [online]. Available from:
https://au.finance.yahoo.com/quote/NCM.AX/financials/ [Accessed 30 May 2018].
⊘ This is a preview!⊘
Do you want full access?
Subscribe today to unlock all pages.
Trusted by 1+ million students worldwide
1 out of 15
Related Documents


Your All-in-One AI-Powered Toolkit for Academic Success.
+13062052269
info@desklib.com
Available 24*7 on WhatsApp / Email
![[object Object]](/_next/static/media/star-bottom.7253800d.svg)
Unlock your academic potential
Copyright © 2020–2026 A2Z Services. All Rights Reserved. Developed and managed by ZUCOL.