Financial Accounting Report on Next Plc: Ratio Analysis and ESG
VerifiedAdded on 2023/06/16
|12
|2822
|137
Report
AI Summary
This report provides a financial analysis of Next Plc, a UK-based apparel and home products company, using ratio analysis and an examination of ESG (Environmental, Social, and Governance) factors. The analysis includes profitability ratios (gross profit ratio, operating profit margin), liquidity ratios (current ratio, quick ratio), efficiency ratios (debtor turnover ratio, asset turnover ratio), and long-term financial stability ratios (debt to equity ratio, interest coverage ratio) calculated from the company's financial statements over the past five years. The report interprets these ratios to assess Next Plc's financial health, operational efficiency, and ability to manage debt. Furthermore, it discusses the impact of economic, social, and governmental ESG factors on the company's performance, including considerations of unemployment rates, exchange rates, demographic shifts, and regulatory compliance. The report concludes with recommendations for Next Plc to leverage economic trends, navigate political hindrances, capitalize on market trends, and maintain financial stability to enhance its brand image and market growth. The conclusion emphasizes the crucial role of financial accounting and ratio analysis in determining an organization's financial position.

Financial Accounting
1
1
Paraphrase This Document
Need a fresh take? Get an instant paraphrase of this document with our AI Paraphraser
Table of Contents
Introduction......................................................................................................................................3
Description and Purpose of ratios....................................................................................................3
ESG factors of Next Plc...................................................................................................................4
Recommendations............................................................................................................................6
Conclusion.......................................................................................................................................6
References........................................................................................................................................7
Appendix..........................................................................................................................................8
2
Introduction
Financial Accounting is referred as a branch of accounting that comprises of a process of
recording, analysing and summarising the reports. These transactions are a result of the business
operations that take place over a period of time (Lee, 2020).
Next plc is a UK based organisation that deals in apparels, footwear and home products.
The headquarters of Next Plc is situated at Enderby, England. The brand has nearly 700 stores
across the globe. The report revolves around the financial accounting of Next plc. The given
report will explore financial analysis of the given company through preparation of various
financial aspects of the company. Further, in the said report document several understandings are
being made in respect to analysing of each ration with ESG factors.
Description and Purpose of ratios
Ratio analysis is basically a comparison between the several line item data from the
organisation that is derived from the financial statements of the organisation. The ratio tends to
reveal the insight in context of profitability, liquidity, operational efficiency and solvency. The
concept revolves around the quantitative interpretation of the financial performance of the
organisation. The profitability and liquidity ratios have been calculated based upon the last five
years' financial statements.
Profitability ratio
The profitability ratios are the classification on the basis of the financial metrics that are helpful
in assessing the ability of the business in order to generate earnings of the organisation in context
to revenue, operating costs, balance sheets etc. The several profitability ratios have been
discussed below.
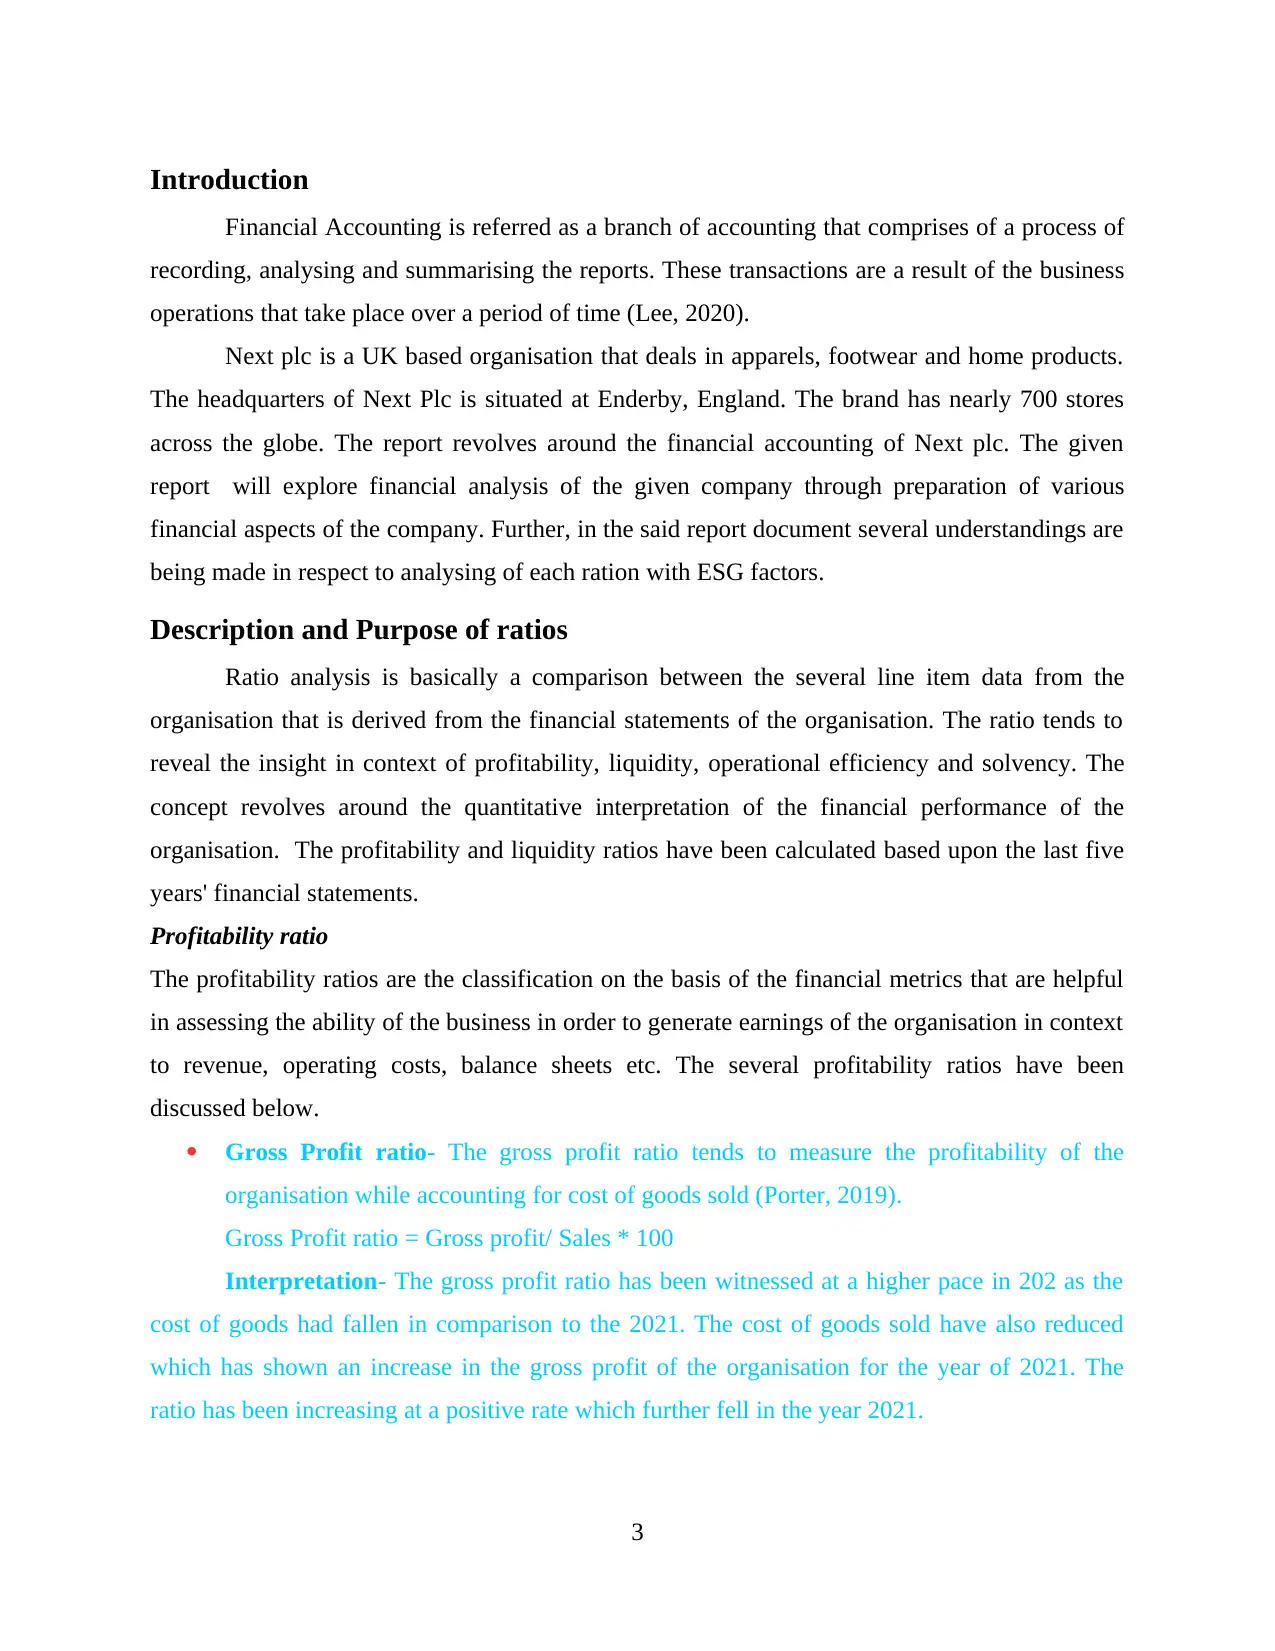
Gross Profit ratio- The gross profit ratio tends to measure the profitability of the
organisation while accounting for cost of goods sold (Porter, 2019).
Gross Profit ratio = Gross profit/ Sales * 100
Interpretation- The gross profit ratio has been witnessed at a higher pace in 202 as the
cost of goods had fallen in comparison to the 2021. The cost of goods sold have also reduced
which has shown an increase in the gross profit of the organisation for the year of 2021. The
ratio has been increasing at a positive rate which further fell in the year 2021.
3
Financial Accounting is referred as a branch of accounting that comprises of a process of
recording, analysing and summarising the reports. These transactions are a result of the business
operations that take place over a period of time (Lee, 2020).
Next plc is a UK based organisation that deals in apparels, footwear and home products.
The headquarters of Next Plc is situated at Enderby, England. The brand has nearly 700 stores
across the globe. The report revolves around the financial accounting of Next plc. The given
report will explore financial analysis of the given company through preparation of various
financial aspects of the company. Further, in the said report document several understandings are
being made in respect to analysing of each ration with ESG factors.
Description and Purpose of ratios
Ratio analysis is basically a comparison between the several line item data from the
organisation that is derived from the financial statements of the organisation. The ratio tends to
reveal the insight in context of profitability, liquidity, operational efficiency and solvency. The
concept revolves around the quantitative interpretation of the financial performance of the
organisation. The profitability and liquidity ratios have been calculated based upon the last five
years' financial statements.
Profitability ratio
The profitability ratios are the classification on the basis of the financial metrics that are helpful
in assessing the ability of the business in order to generate earnings of the organisation in context
to revenue, operating costs, balance sheets etc. The several profitability ratios have been
discussed below.
Gross Profit ratio- The gross profit ratio tends to measure the profitability of the
organisation while accounting for cost of goods sold (Porter, 2019).
Gross Profit ratio = Gross profit/ Sales * 100
Interpretation- The gross profit ratio has been witnessed at a higher pace in 202 as the
cost of goods had fallen in comparison to the 2021. The cost of goods sold have also reduced
which has shown an increase in the gross profit of the organisation for the year of 2021. The
ratio has been increasing at a positive rate which further fell in the year 2021.
3
⊘ This is a preview!⊘
Do you want full access?
Subscribe today to unlock all pages.
Trusted by 1+ million students worldwide
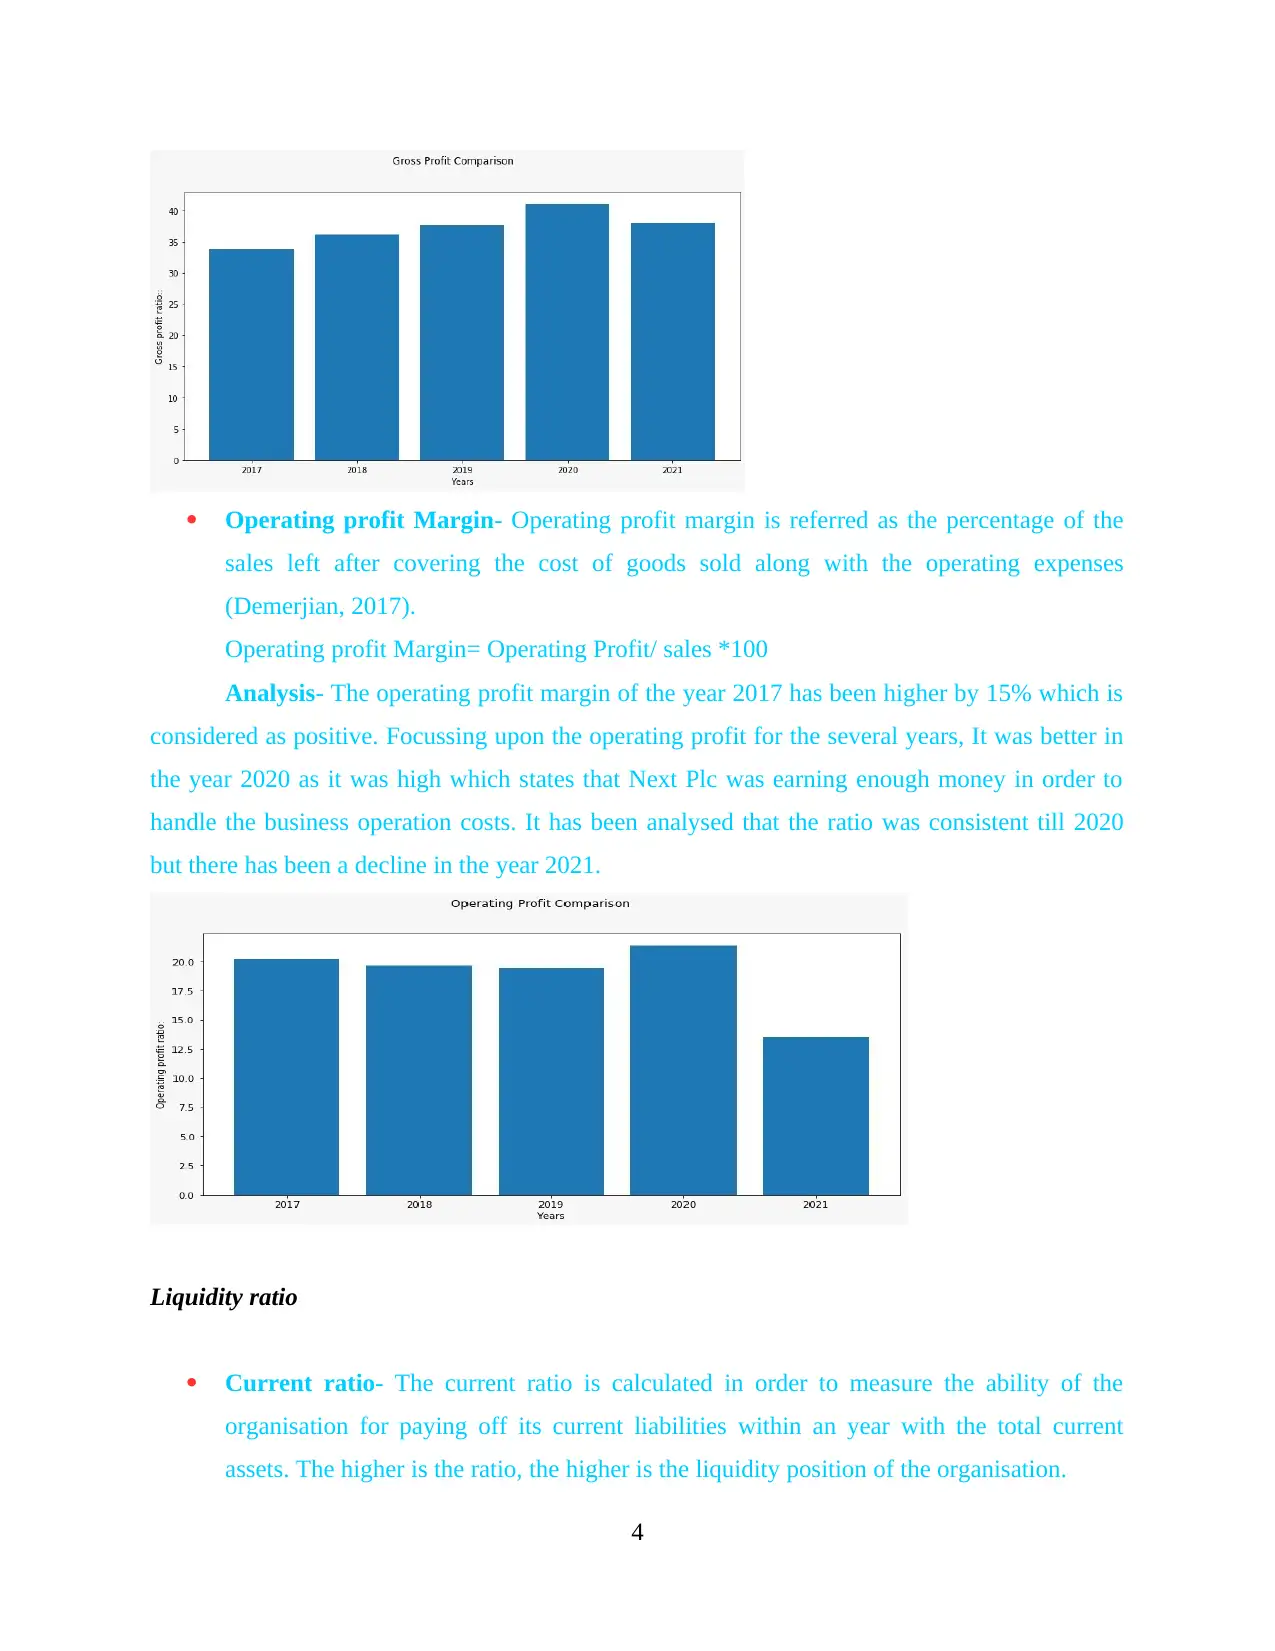
Operating profit Margin- Operating profit margin is referred as the percentage of the
sales left after covering the cost of goods sold along with the operating expenses
(Demerjian, 2017).
Operating profit Margin= Operating Profit/ sales *100
Analysis- The operating profit margin of the year 2017 has been higher by 15% which is
considered as positive. Focussing upon the operating profit for the several years, It was better in
the year 2020 as it was high which states that Next Plc was earning enough money in order to
handle the business operation costs. It has been analysed that the ratio was consistent till 2020
but there has been a decline in the year 2021.
Liquidity ratio
Current ratio- The current ratio is calculated in order to measure the ability of the
organisation for paying off its current liabilities within an year with the total current
assets. The higher is the ratio, the higher is the liquidity position of the organisation.
4
Paraphrase This Document
Need a fresh take? Get an instant paraphrase of this document with our AI Paraphraser
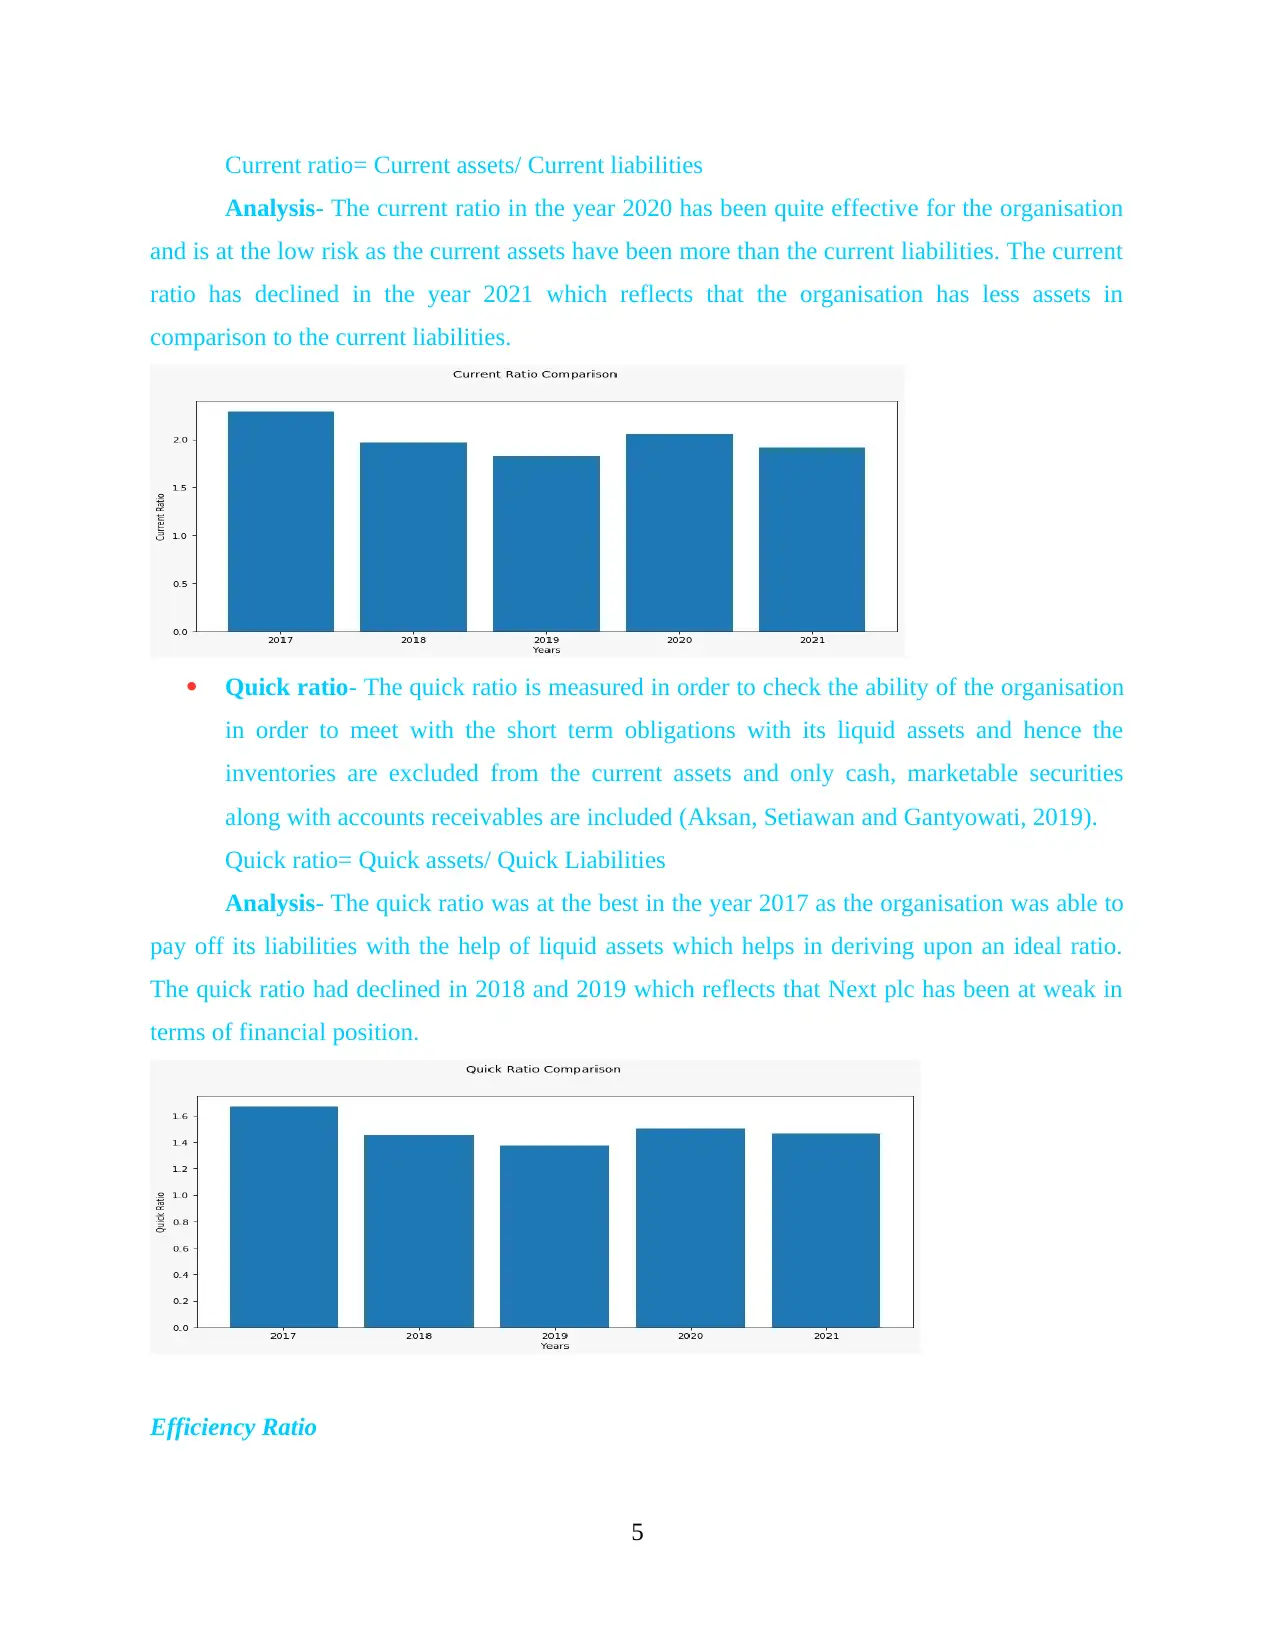
Current ratio= Current assets/ Current liabilities
Analysis- The current ratio in the year 2020 has been quite effective for the organisation
and is at the low risk as the current assets have been more than the current liabilities. The current
ratio has declined in the year 2021 which reflects that the organisation has less assets in
comparison to the current liabilities.
Quick ratio- The quick ratio is measured in order to check the ability of the organisation
in order to meet with the short term obligations with its liquid assets and hence the
inventories are excluded from the current assets and only cash, marketable securities
along with accounts receivables are included (Aksan, Setiawan and Gantyowati, 2019).
Quick ratio= Quick assets/ Quick Liabilities
Analysis- The quick ratio was at the best in the year 2017 as the organisation was able to
pay off its liabilities with the help of liquid assets which helps in deriving upon an ideal ratio.
The quick ratio had declined in 2018 and 2019 which reflects that Next plc has been at weak in
terms of financial position.
Efficiency Ratio
5
Debtor turnover ratio- Debtor turnover ratio helps in measuring the capacity of Next
plc to extend the credit along with the collection of the debts. This has helped the
organisation understand the capability of the organisation to use its assets.
Analysis- The debtor turnover ratio states that the organisation will require 63 days in order to
pay off its debt in order to get back to solvency. Further it can be analysed that Next plc has been
performing at a better pace in the year 2020. It has helped the organisation to increase its level of
productivity as well as the efficiency in the business operations.
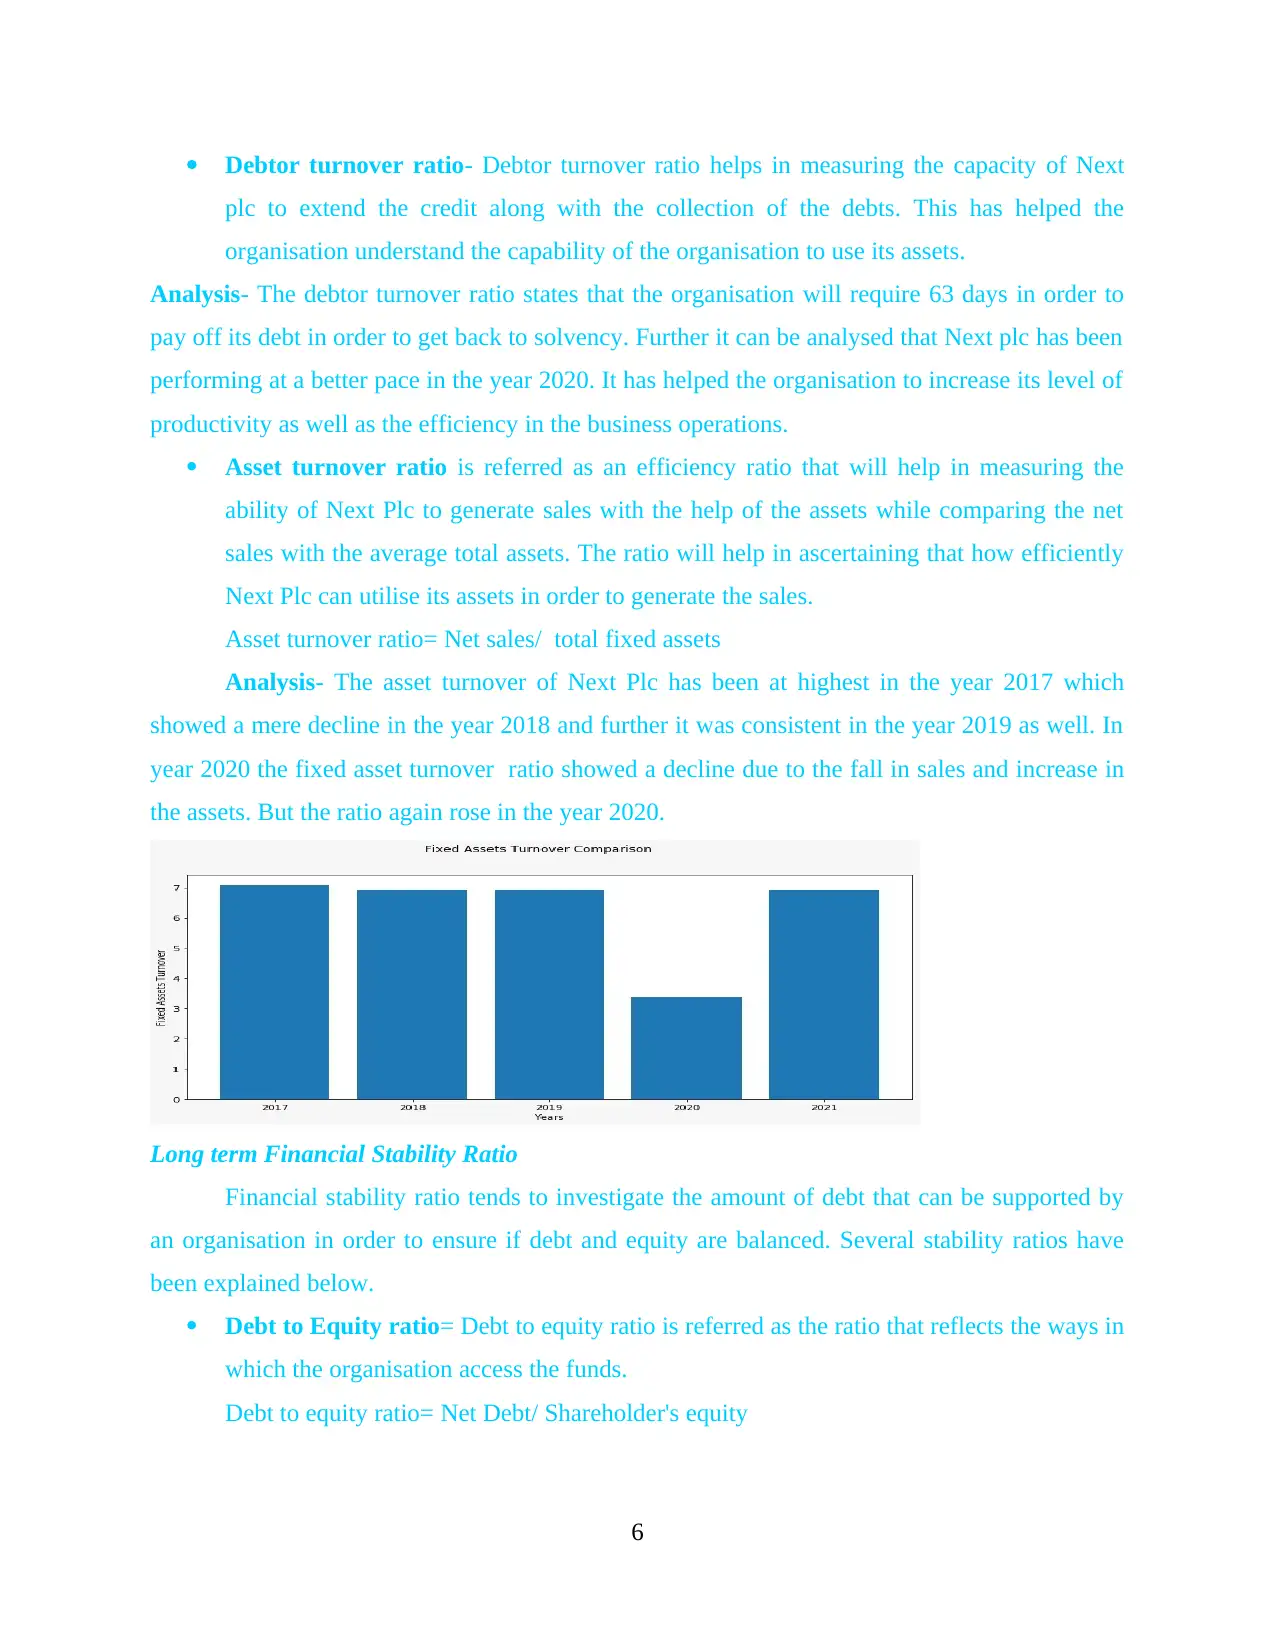
Asset turnover ratio is referred as an efficiency ratio that will help in measuring the
ability of Next Plc to generate sales with the help of the assets while comparing the net
sales with the average total assets. The ratio will help in ascertaining that how efficiently
Next Plc can utilise its assets in order to generate the sales.
Asset turnover ratio= Net sales/ total fixed assets
Analysis- The asset turnover of Next Plc has been at highest in the year 2017 which
showed a mere decline in the year 2018 and further it was consistent in the year 2019 as well. In
year 2020 the fixed asset turnover ratio showed a decline due to the fall in sales and increase in
the assets. But the ratio again rose in the year 2020.
Long term Financial Stability Ratio
Financial stability ratio tends to investigate the amount of debt that can be supported by
an organisation in order to ensure if debt and equity are balanced. Several stability ratios have
been explained below.
Debt to Equity ratio= Debt to equity ratio is referred as the ratio that reflects the ways in
which the organisation access the funds.
Debt to equity ratio= Net Debt/ Shareholder's equity
6
plc to extend the credit along with the collection of the debts. This has helped the
organisation understand the capability of the organisation to use its assets.
Analysis- The debtor turnover ratio states that the organisation will require 63 days in order to
pay off its debt in order to get back to solvency. Further it can be analysed that Next plc has been
performing at a better pace in the year 2020. It has helped the organisation to increase its level of
productivity as well as the efficiency in the business operations.
Asset turnover ratio is referred as an efficiency ratio that will help in measuring the
ability of Next Plc to generate sales with the help of the assets while comparing the net
sales with the average total assets. The ratio will help in ascertaining that how efficiently
Next Plc can utilise its assets in order to generate the sales.
Asset turnover ratio= Net sales/ total fixed assets
Analysis- The asset turnover of Next Plc has been at highest in the year 2017 which
showed a mere decline in the year 2018 and further it was consistent in the year 2019 as well. In
year 2020 the fixed asset turnover ratio showed a decline due to the fall in sales and increase in
the assets. But the ratio again rose in the year 2020.
Long term Financial Stability Ratio
Financial stability ratio tends to investigate the amount of debt that can be supported by
an organisation in order to ensure if debt and equity are balanced. Several stability ratios have
been explained below.
Debt to Equity ratio= Debt to equity ratio is referred as the ratio that reflects the ways in
which the organisation access the funds.
Debt to equity ratio= Net Debt/ Shareholder's equity
6
⊘ This is a preview!⊘
Do you want full access?
Subscribe today to unlock all pages.
Trusted by 1+ million students worldwide
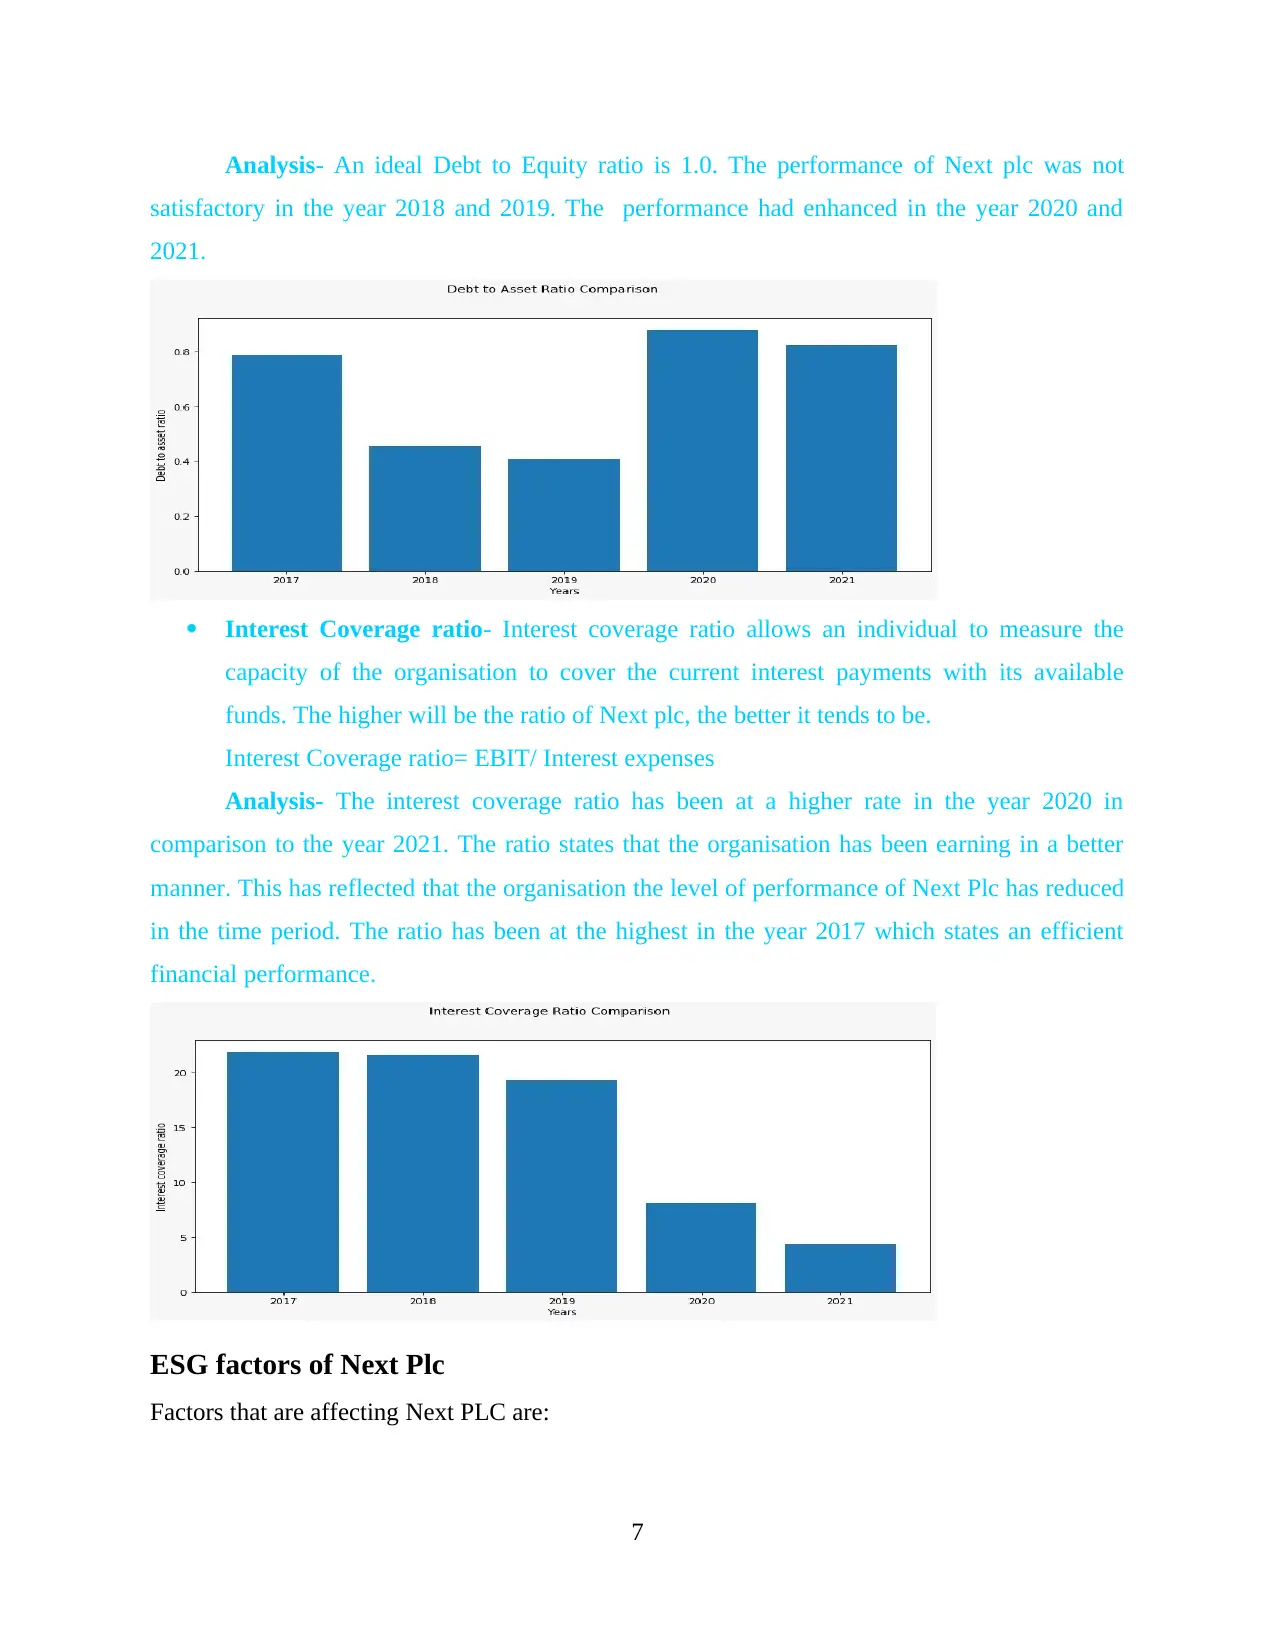
Analysis- An ideal Debt to Equity ratio is 1.0. The performance of Next plc was not
satisfactory in the year 2018 and 2019. The performance had enhanced in the year 2020 and
2021.
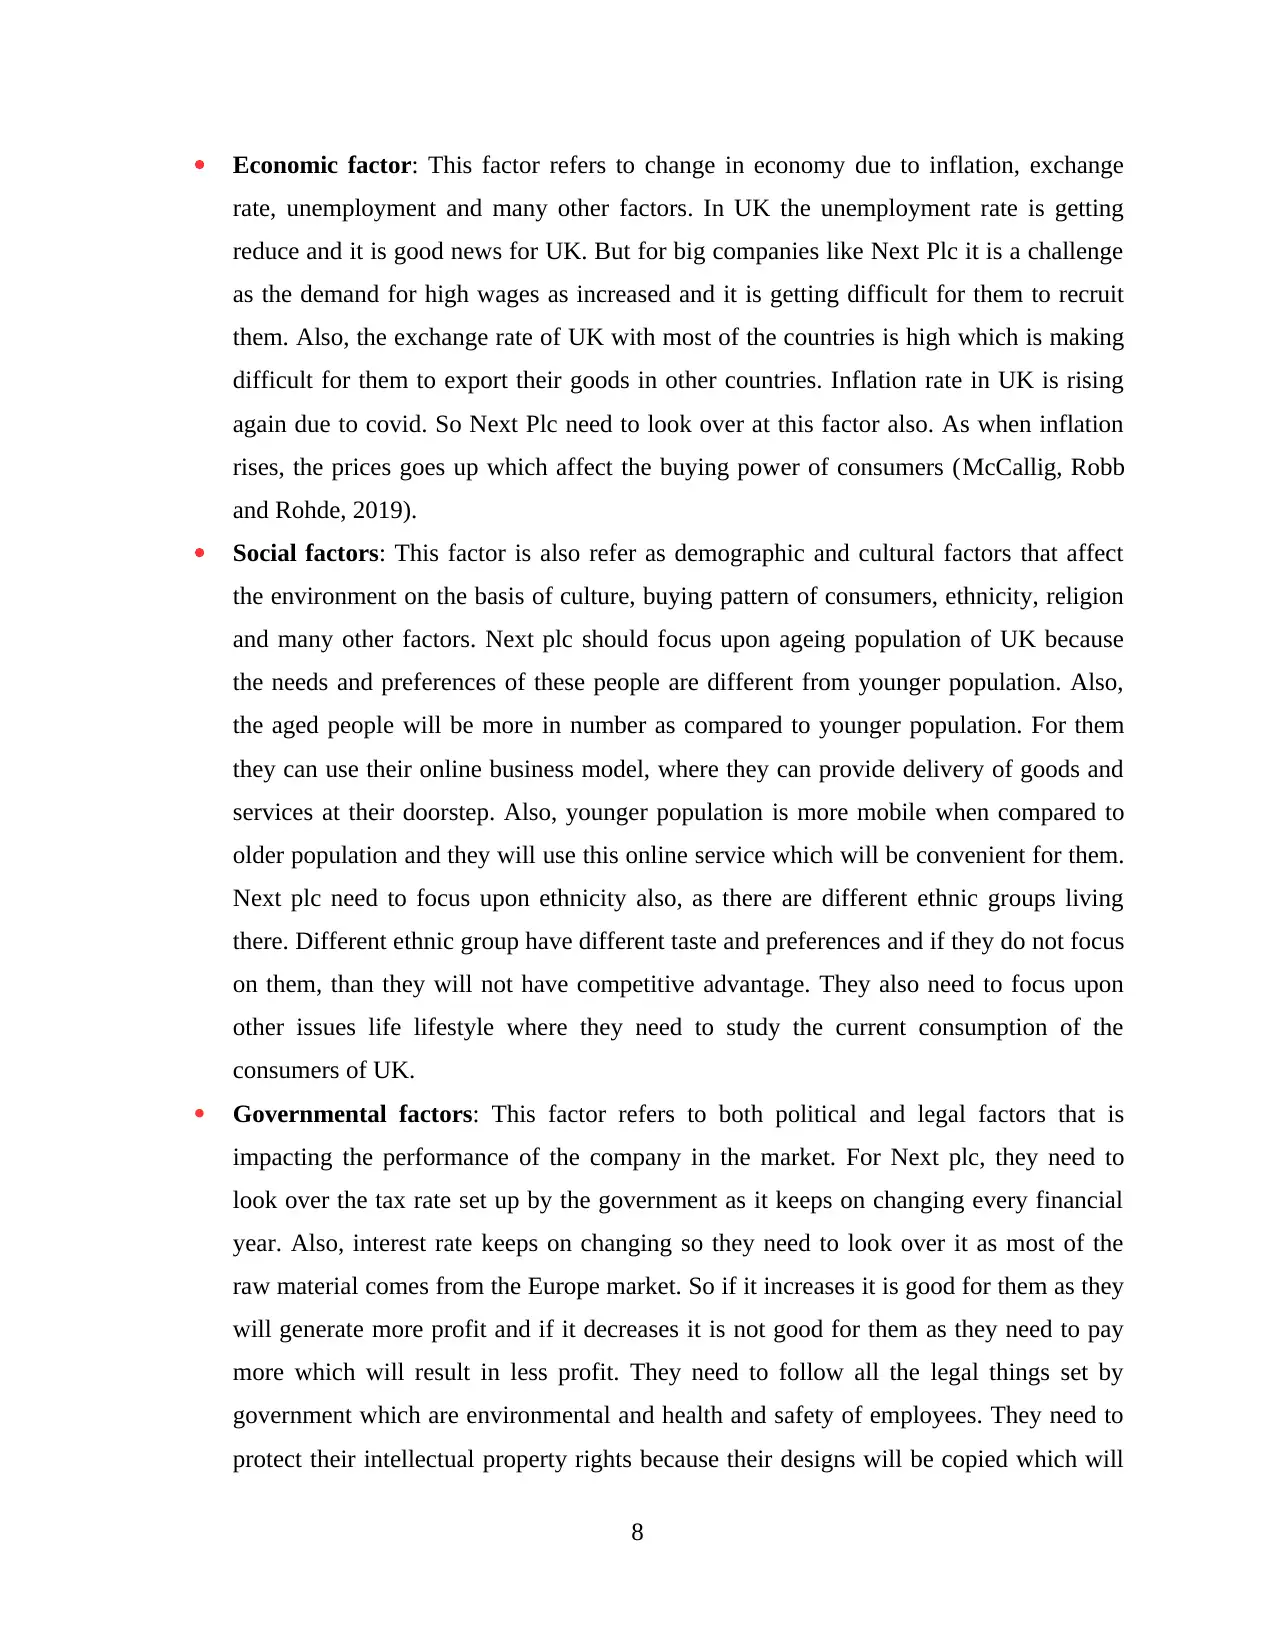
Interest Coverage ratio- Interest coverage ratio allows an individual to measure the
capacity of the organisation to cover the current interest payments with its available
funds. The higher will be the ratio of Next plc, the better it tends to be.
Interest Coverage ratio= EBIT/ Interest expenses
Analysis- The interest coverage ratio has been at a higher rate in the year 2020 in
comparison to the year 2021. The ratio states that the organisation has been earning in a better
manner. This has reflected that the organisation the level of performance of Next Plc has reduced
in the time period. The ratio has been at the highest in the year 2017 which states an efficient
financial performance.
ESG factors of Next Plc
Factors that are affecting Next PLC are:
7
satisfactory in the year 2018 and 2019. The performance had enhanced in the year 2020 and
2021.
Interest Coverage ratio- Interest coverage ratio allows an individual to measure the
capacity of the organisation to cover the current interest payments with its available
funds. The higher will be the ratio of Next plc, the better it tends to be.
Interest Coverage ratio= EBIT/ Interest expenses
Analysis- The interest coverage ratio has been at a higher rate in the year 2020 in
comparison to the year 2021. The ratio states that the organisation has been earning in a better
manner. This has reflected that the organisation the level of performance of Next Plc has reduced
in the time period. The ratio has been at the highest in the year 2017 which states an efficient
financial performance.
ESG factors of Next Plc
Factors that are affecting Next PLC are:
7
Paraphrase This Document
Need a fresh take? Get an instant paraphrase of this document with our AI Paraphraser
Economic factor: This factor refers to change in economy due to inflation, exchange
rate, unemployment and many other factors. In UK the unemployment rate is getting
reduce and it is good news for UK. But for big companies like Next Plc it is a challenge
as the demand for high wages as increased and it is getting difficult for them to recruit
them. Also, the exchange rate of UK with most of the countries is high which is making
difficult for them to export their goods in other countries. Inflation rate in UK is rising
again due to covid. So Next Plc need to look over at this factor also. As when inflation
rises, the prices goes up which affect the buying power of consumers (McCallig, Robb
and Rohde, 2019).
Social factors: This factor is also refer as demographic and cultural factors that affect
the environment on the basis of culture, buying pattern of consumers, ethnicity, religion
and many other factors. Next plc should focus upon ageing population of UK because
the needs and preferences of these people are different from younger population. Also,
the aged people will be more in number as compared to younger population. For them
they can use their online business model, where they can provide delivery of goods and
services at their doorstep. Also, younger population is more mobile when compared to
older population and they will use this online service which will be convenient for them.
Next plc need to focus upon ethnicity also, as there are different ethnic groups living
there. Different ethnic group have different taste and preferences and if they do not focus
on them, than they will not have competitive advantage. They also need to focus upon
other issues life lifestyle where they need to study the current consumption of the
consumers of UK.
Governmental factors: This factor refers to both political and legal factors that is
impacting the performance of the company in the market. For Next plc, they need to
look over the tax rate set up by the government as it keeps on changing every financial
year. Also, interest rate keeps on changing so they need to look over it as most of the
raw material comes from the Europe market. So if it increases it is good for them as they
will generate more profit and if it decreases it is not good for them as they need to pay
more which will result in less profit. They need to follow all the legal things set by
government which are environmental and health and safety of employees. They need to
protect their intellectual property rights because their designs will be copied which will
8
result in losing competitive advantage. They also need to protect rights of customer as
some customers have problem with the quality of the product so they need refund for it.
Also, while entering into new market they need to look up the legal environment of that
place as different countries have different laws (Pratt and Peters, 2017).
Recommendations
On the basis of the Ratio analysis and the ESG factors, several recommendations can be made.
The organisation, Next Plc can focus upon the trends in the economy in order to grab the
opportunities in order to enhance the market growth and capital of the organisation.
The organisation can keep a track of the recent political hindrances in the region that can
have an impact over the operational activities of the organisation. In order to keep a track
of the various political hindrances, the organisation and its management need to have
good awareness of the market.
Also, the organisation can look upon several legal formalities and obligations in order to
take benefits from the existing subsidiaries and tax concessions in the industry.
Next plc can focus upon the several trends in the market that are being favoured by the
customers in the market. This will help in attracting the customers towards the brand
outlets.
The organisation must focus upon its liquidity and profitability in order to develop and
sustain a positive brand image in the market. It can be done in consideration with the
assets and liabilities of the organisation (Yu, Lin and Tang, 2018).
Conclusion
It can be concluded from the report that Financial accounting plays a crucial role in the
organisation. Financial Accounting is referred as a branch of accounting that comprises of a
process of recording, analysing and summarising the reports. It can be concluded that ratio
analysis plays a crucial role in order to ascertain the financial position of the organisation. The
profitability and liquidity ratio have been calculated in the study along with the Economic, social
and governance factors that have an impact over the organisation. The report has recommended
few suggestions in order to improve the financial position of the organisation.
9
⊘ This is a preview!⊘
Do you want full access?
Subscribe today to unlock all pages.
Trusted by 1+ million students worldwide
References
Books and Journals
Yu, T., Lin, Z. and Tang, Q., 2018. Blockchain: the introduction and its application in financial
accounting. Journal of Corporate Accounting & Finance, 29(4), pp.37-47.
Pratt, J. and Peters, M.F., 2017. Financial accounting in an economic context. John Wiley &
Sons.
McCallig, J., Robb, A. and Rohde, F., 2019. Establishing the representational faithfulness of
financial accounting information using multiparty security, network analysis and a
blockchain. International Journal of Accounting Information Systems, 33, pp.47-58.
Aksan, I., Setiawan, D. and Gantyowati, E., 2019. Research development related to
implementation of financial accounting standards in Indonesia. International Journal of
Economics, Business and Accounting Research (IJEBAR), 3(04).
Porter, J.C., 2019. Beyond debits and credits: Using integrated projects to improve students’
understanding of financial accounting. Journal of Accounting Education, 46, pp.53-71.
Lee, T.A., 2020. Financial accounting theory. In The Routledge companion to accounting
history (pp. 159-184). Routledge.
Demerjian, P.R., 2017. Calculating efficiency with financial accounting data: Data envelopment
analysis for accounting researchers. Available at SSRN 2993687.
10
Paraphrase This Document
Need a fresh take? Get an instant paraphrase of this document with our AI Paraphraser
Appendix
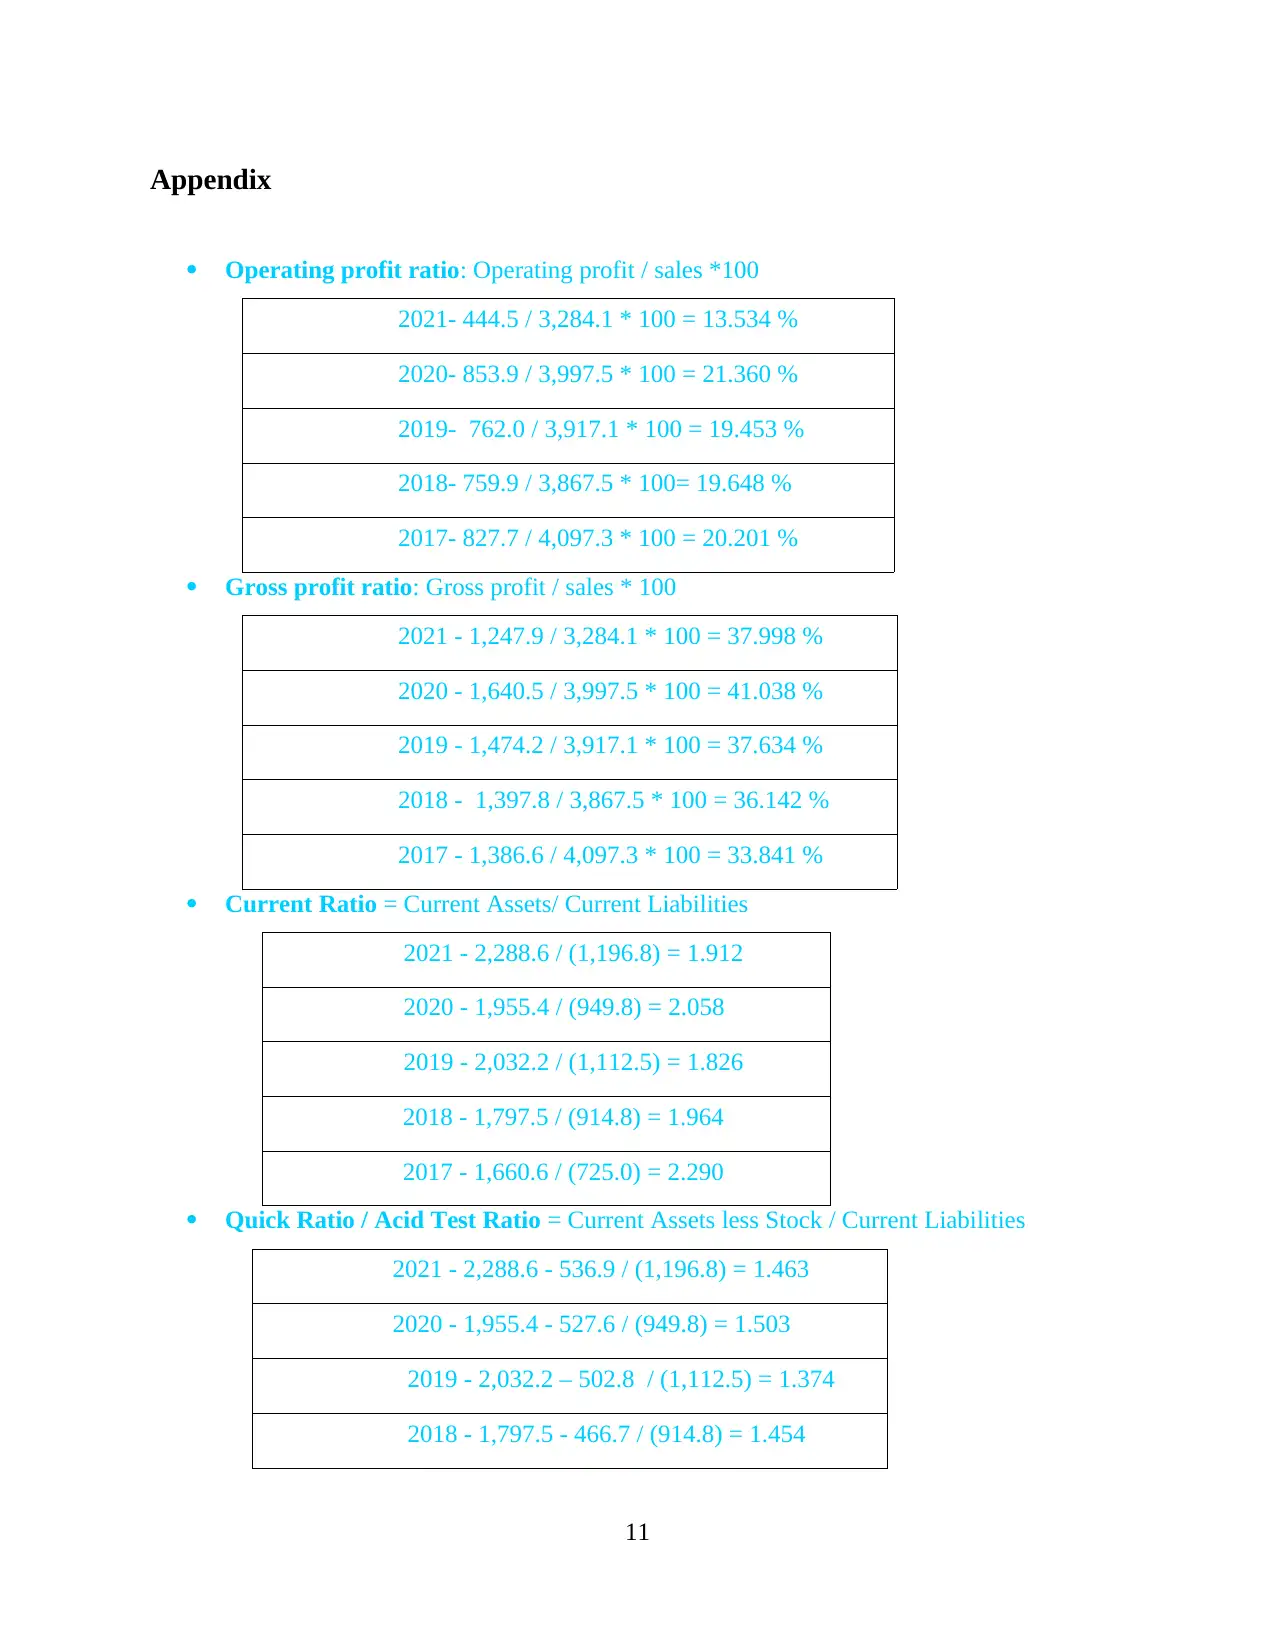
Operating profit ratio: Operating profit / sales *100
2021- 444.5 / 3,284.1 * 100 = 13.534 %
2020- 853.9 / 3,997.5 * 100 = 21.360 %
2019- 762.0 / 3,917.1 * 100 = 19.453 %
2018- 759.9 / 3,867.5 * 100= 19.648 %
2017- 827.7 / 4,097.3 * 100 = 20.201 %
Gross profit ratio: Gross profit / sales * 100
2021 - 1,247.9 / 3,284.1 * 100 = 37.998 %
2020 - 1,640.5 / 3,997.5 * 100 = 41.038 %
2019 - 1,474.2 / 3,917.1 * 100 = 37.634 %
2018 - 1,397.8 / 3,867.5 * 100 = 36.142 %
2017 - 1,386.6 / 4,097.3 * 100 = 33.841 %
Current Ratio = Current Assets/ Current Liabilities
2021 - 2,288.6 / (1,196.8) = 1.912
2020 - 1,955.4 / (949.8) = 2.058
2019 - 2,032.2 / (1,112.5) = 1.826
2018 - 1,797.5 / (914.8) = 1.964
2017 - 1,660.6 / (725.0) = 2.290
Quick Ratio / Acid Test Ratio = Current Assets less Stock / Current Liabilities
2021 - 2,288.6 - 536.9 / (1,196.8) = 1.463
2020 - 1,955.4 - 527.6 / (949.8) = 1.503
2019 - 2,032.2 – 502.8 / (1,112.5) = 1.374
2018 - 1,797.5 - 466.7 / (914.8) = 1.454
11
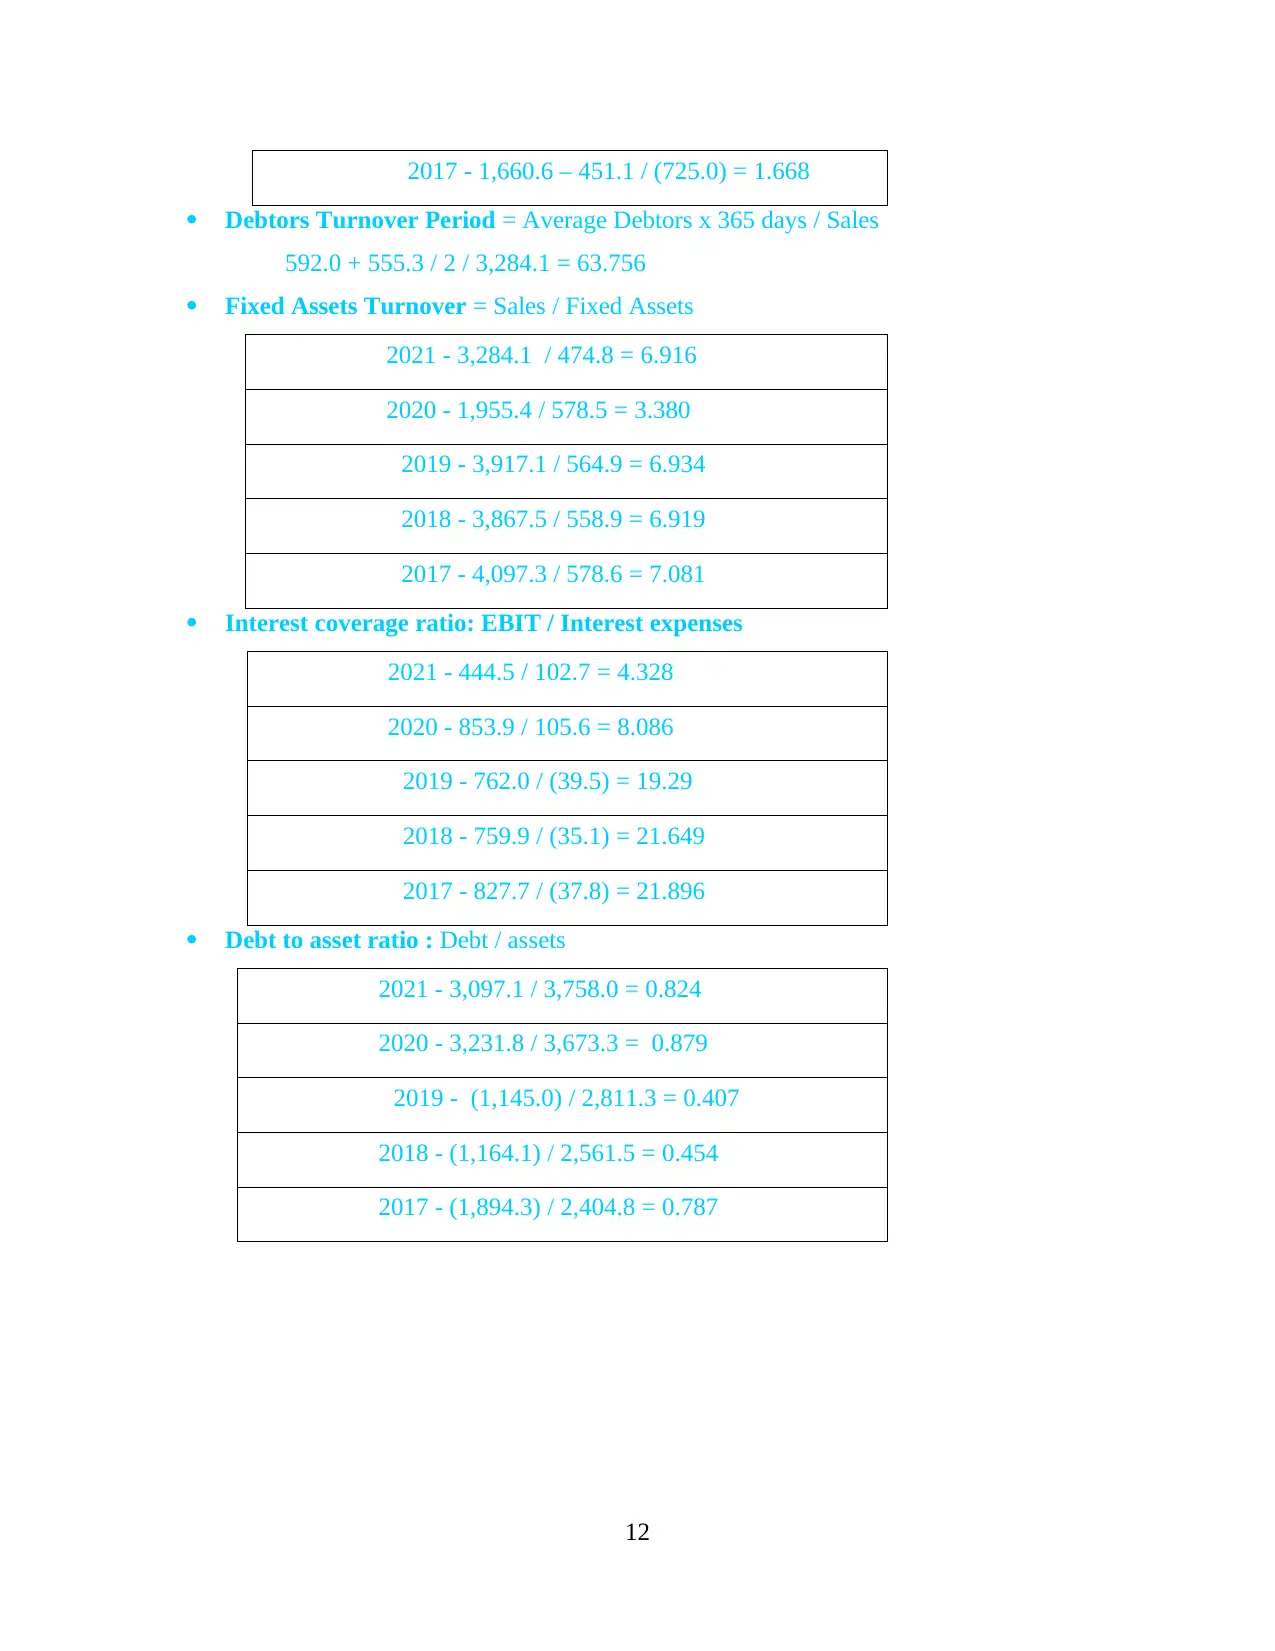
2017 - 1,660.6 – 451.1 / (725.0) = 1.668
Debtors Turnover Period = Average Debtors x 365 days / Sales
592.0 + 555.3 / 2 / 3,284.1 = 63.756
Fixed Assets Turnover = Sales / Fixed Assets
2021 - 3,284.1 / 474.8 = 6.916
2020 - 1,955.4 / 578.5 = 3.380
2019 - 3,917.1 / 564.9 = 6.934
2018 - 3,867.5 / 558.9 = 6.919
2017 - 4,097.3 / 578.6 = 7.081
Interest coverage ratio: EBIT / Interest expenses
2021 - 444.5 / 102.7 = 4.328
2020 - 853.9 / 105.6 = 8.086
2019 - 762.0 / (39.5) = 19.29
2018 - 759.9 / (35.1) = 21.649
2017 - 827.7 / (37.8) = 21.896
Debt to asset ratio : Debt / assets
2021 - 3,097.1 / 3,758.0 = 0.824
2020 - 3,231.8 / 3,673.3 = 0.879
2019 - (1,145.0) / 2,811.3 = 0.407
2018 - (1,164.1) / 2,561.5 = 0.454
2017 - (1,894.3) / 2,404.8 = 0.787
12
⊘ This is a preview!⊘
Do you want full access?
Subscribe today to unlock all pages.
Trusted by 1+ million students worldwide
1 out of 12
Related Documents


Your All-in-One AI-Powered Toolkit for Academic Success.
+13062052269
info@desklib.com
Available 24*7 on WhatsApp / Email
![[object Object]](/_next/static/media/star-bottom.7253800d.svg)
Unlock your academic potential
Copyright © 2020–2025 A2Z Services. All Rights Reserved. Developed and managed by ZUCOL.