Corporate Finance Report: Next Plc. Financial Performance Analysis
VerifiedAdded on 2022/11/25
|13
|4146
|340
Report
AI Summary
This report provides a comprehensive financial analysis of Next Plc., a UK-based retail company. It begins by calculating the cost of equity using the Capital Asset Pricing Model (CAPM), incorporating risk-free rates, equity beta, and market returns. The report then determines Next Plc.'s asset beta, considering its debt-to-equity ratio and corporate tax rate. Furthermore, it explores different dividend ratios, including dividend payout ratio, dividend coverage ratio, and earnings per share, to assess the company's dividend policy over the past five years. The analysis includes explanations and justifications for the data used, offering insights into the company's financial health and performance, and concludes with a discussion of suitable investment appraisal techniques.

CORPORATE FINANCE
Paraphrase This Document
Need a fresh take? Get an instant paraphrase of this document with our AI Paraphraser
Table of Contents
INTRODUCTION...........................................................................................................................3
MAIN BODY..................................................................................................................................3
a) Calculation of current cost of equity of Next Plc. using Capital Asset Pricing Model
(CAPM).......................................................................................................................................3
b) Calculation of Asset Beta of Next Plc.....................................................................................5
c) Different forms of dividend ratio.............................................................................................7
(D) Suitable investment appraisal technique...............................................................................9
CONCLUSION..............................................................................................................................11
REFERENCES................................................................................................................................1
INTRODUCTION
Next Plc. is an UK based retail sector company which offers the various products such as
cloths, footwear, beauty, accessories and home products. The main purpose and objectives of the
company is to provide the unique and in trend along with the high in quality products to their
local and international customers. This is an international retail company which have around 199
stores via franchise all over the 32 countries. The company have many segments in which one id
Next Finance which provide credit service to the customers so that they can buy the product
online and from stores in next pay. This report will state the cost of equity of the Next Plc. using
the CAPM model and also their asset beta. The report will also discuss the dividend policy of
Next Plc. over the past 5 years.
MAIN BODY
a) Calculation of current cost of equity of Next Plc. using Capital Asset Pricing Model (CAPM)
Cost of equity is a return amount that an organization need to pay its equity shareholders
and investors in order to compensate the risk that is taken by shareholder to invest in their
company (Phuoc, Kim and Su, 2018). In order to calculate the cost of equity of the company
using the capital asset pricing model the following formula need to be used:
Formula, Ke = rf + βe × (Rm - Rf)
Where, Ke = cost of equity
rf = Risk-Free Rate
βe= Equity beta
Rm= Expected returns of the market
In order to calculate βe (equity beta), the following formula need to be used:
Equity Beta(βe) = Covariance A, B/ Variance A
Where, A = 5 years daily returns of the FTSE100
And B = 5 years daily returns of the stock Next Plc.
Here, in the give case the following data is available related to Next Plc. Plc
Ke = cost of equity
rf = Risk-Free Rate = 0.778%
βe= Equity beta = 1.0896
⊘ This is a preview!⊘
Do you want full access?
Subscribe today to unlock all pages.
Trusted by 1+ million students worldwide
Rm= Expected returns of the market = 3.86% (2021)
So, the cost of equity of the Next Plc. are as follow:
Ke = 0.00778 + 1.0896* (0.0386 – 0.00778)
= 0.041357
Explanation and Justification of data used:
In order to calculate the cost of equity using the CAPM model, the risk-free rate of the
stock of the Next Plc. have been used. A risk-free rate is basically rate of return of the
stocks which has zero risk and no risk at all. In real world, such type of securities does
not exist because every type of security has some kind of the risk attack with it. For
example, US treasury bill is considered as a risk-free asset because it is hold, backed and
managed by the government of the US. This data is a part of the cost of equity calculation
using the capitalized assets price modelling (Baker, Kumar and Pattnaik, 2021).
Another data used to calculate the COE is include equity beta and this is one of the
important measures of the CAPM model as it helps in evaluating the expected return of
stocks. The equity beta is basically depending upon the debts and leverage of the
company. In case, if Next Plc. have no debts than their equity beta and asset beta will be
equal but if there is presence of the debt than equity and asset beta will be unequal.
Whenever the amount of the debt of the Next Plc. increases, its equity beta will also
increase which reflect the direct relationship between the two variables (Zaman and et.al.,
2019).
The expected return of the market is also one of the most important data used to calculate
the Ke because this is a forecast of the market’s return over the specific period of time.
The expected return of the FTSE100 market is 8.95% in the year 2021. But as this is a
forecast and estimation, so it is not important that it reflect accurate data all the time. The
accuracy of CAPM result is basically depends upon the ability of the experts to predict
the variable over the period of time. On an average, the investors and company expect at
least 15 to 20% and this also considered as good in stock market. So, the return of UK
market is not good as it shown (Yuan and Wen, 2018).
Further to calculate the ke the company and investors also need to use the data related to
the FTSE100 and Next Plc. 5-year daily return. 5-year returns of the both FTSE100 and
Paraphrase This Document
Need a fresh take? Get an instant paraphrase of this document with our AI Paraphraser
Next Plc. are being analysed because this data is enough to accommodate the short- and
medium-term activities. This activity is important to analyse and generate the equity beta
of the company with the help of which the cost of equity can be determinable. Basically,
different beta can be calculated for the different stock because it depends upon the debts
of the company (Lu and Wang, 2018).
The CAPM is a model which is widely used by the investors and companies because it is
easy to calculate and stress-tested. This covers the systematic risk attach with the
securities. It is because systematic risk or market risk is one of the most crucial factors as
this is unforeseen (Ahmed, 2017).
b) Calculation of Asset Beta of Next Plc.
Asset beta is a way through which the company or investors are able to measure the risk of
the security minus the company’s debts. It is basically the best way to measure the relation
between the company’s performance and its market. Here, in this case the asset beta is used to
identify and measure the relationship between the performance of the Next Plc. and the FTSE100
UK market. This is measured without the impact of a company debt. When compared this
formula or concept with the levered data, it is identified that the asset beta does not that the effect
of the financial leverage in their calculation. So, in order to calculate the asset beta of the Next
Plc. the following formula will be used:
βa = βe/ 1+(1-t) * D/E
Here,
βa= Asset beta
βe= Equity beta
t= corporate tax rate
D/E= Debt to Asset ratio
In order to calculate the debt to asset ratio, the following formula need to be used
D/E = Total Liabilities/ Total Shareholders’ Equity
So, here in the given case the following data is being used:
βa= Asset beta
βe= Equity beta = 1.0896
t= corporate tax rate = 19%
D/E= Debt to Asset ratio = 4.6861
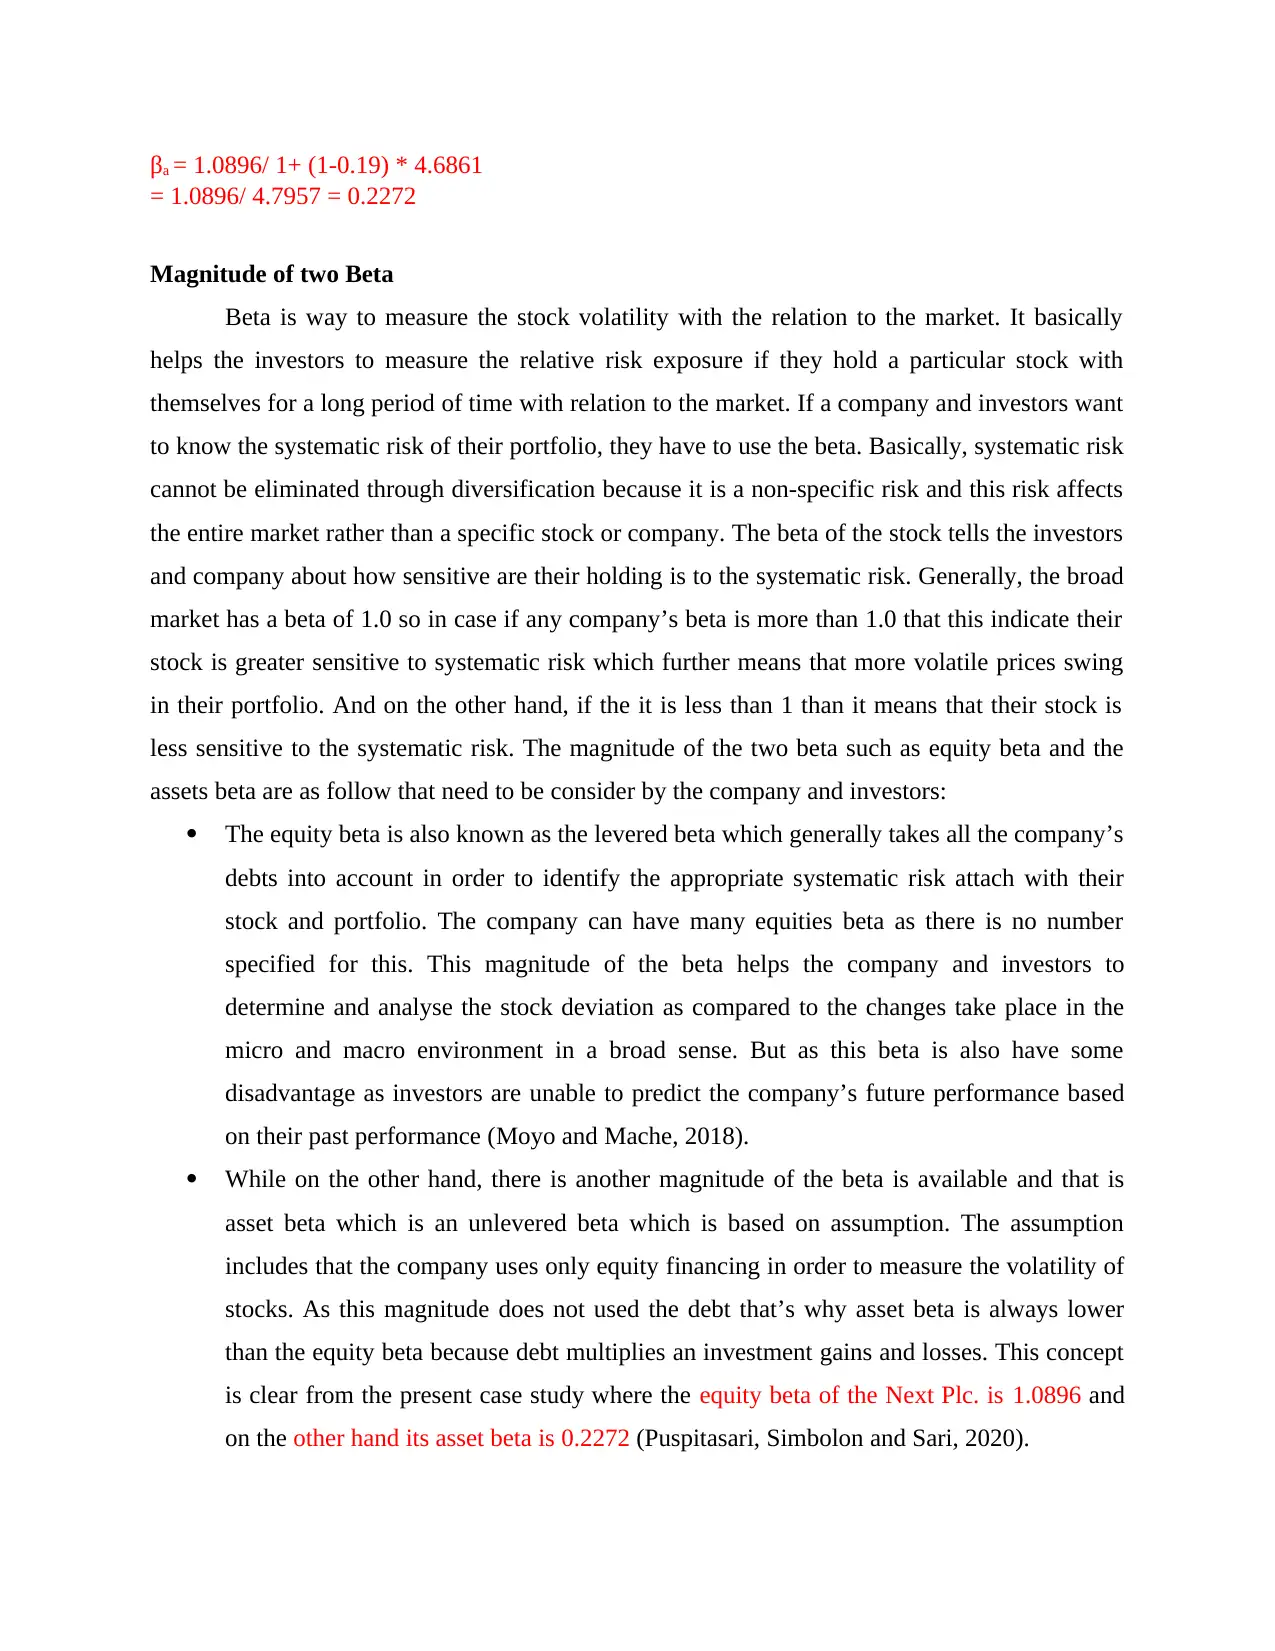
βa = 1.0896/ 1+ (1-0.19) * 4.6861
= 1.0896/ 4.7957 = 0.2272
Magnitude of two Beta
Beta is way to measure the stock volatility with the relation to the market. It basically
helps the investors to measure the relative risk exposure if they hold a particular stock with
themselves for a long period of time with relation to the market. If a company and investors want
to know the systematic risk of their portfolio, they have to use the beta. Basically, systematic risk
cannot be eliminated through diversification because it is a non-specific risk and this risk affects
the entire market rather than a specific stock or company. The beta of the stock tells the investors
and company about how sensitive are their holding is to the systematic risk. Generally, the broad
market has a beta of 1.0 so in case if any company’s beta is more than 1.0 that this indicate their
stock is greater sensitive to systematic risk which further means that more volatile prices swing
in their portfolio. And on the other hand, if the it is less than 1 than it means that their stock is
less sensitive to the systematic risk. The magnitude of the two beta such as equity beta and the
assets beta are as follow that need to be consider by the company and investors:
The equity beta is also known as the levered beta which generally takes all the company’s
debts into account in order to identify the appropriate systematic risk attach with their
stock and portfolio. The company can have many equities beta as there is no number
specified for this. This magnitude of the beta helps the company and investors to
determine and analyse the stock deviation as compared to the changes take place in the
micro and macro environment in a broad sense. But as this beta is also have some
disadvantage as investors are unable to predict the company’s future performance based
on their past performance (Moyo and Mache, 2018).
While on the other hand, there is another magnitude of the beta is available and that is
asset beta which is an unlevered beta which is based on assumption. The assumption
includes that the company uses only equity financing in order to measure the volatility of
stocks. As this magnitude does not used the debt that’s why asset beta is always lower
than the equity beta because debt multiplies an investment gains and losses. This concept
is clear from the present case study where the equity beta of the Next Plc. is 1.0896 and
on the other hand its asset beta is 0.2272 (Puspitasari, Simbolon and Sari, 2020).
⊘ This is a preview!⊘
Do you want full access?
Subscribe today to unlock all pages.
Trusted by 1+ million students worldwide
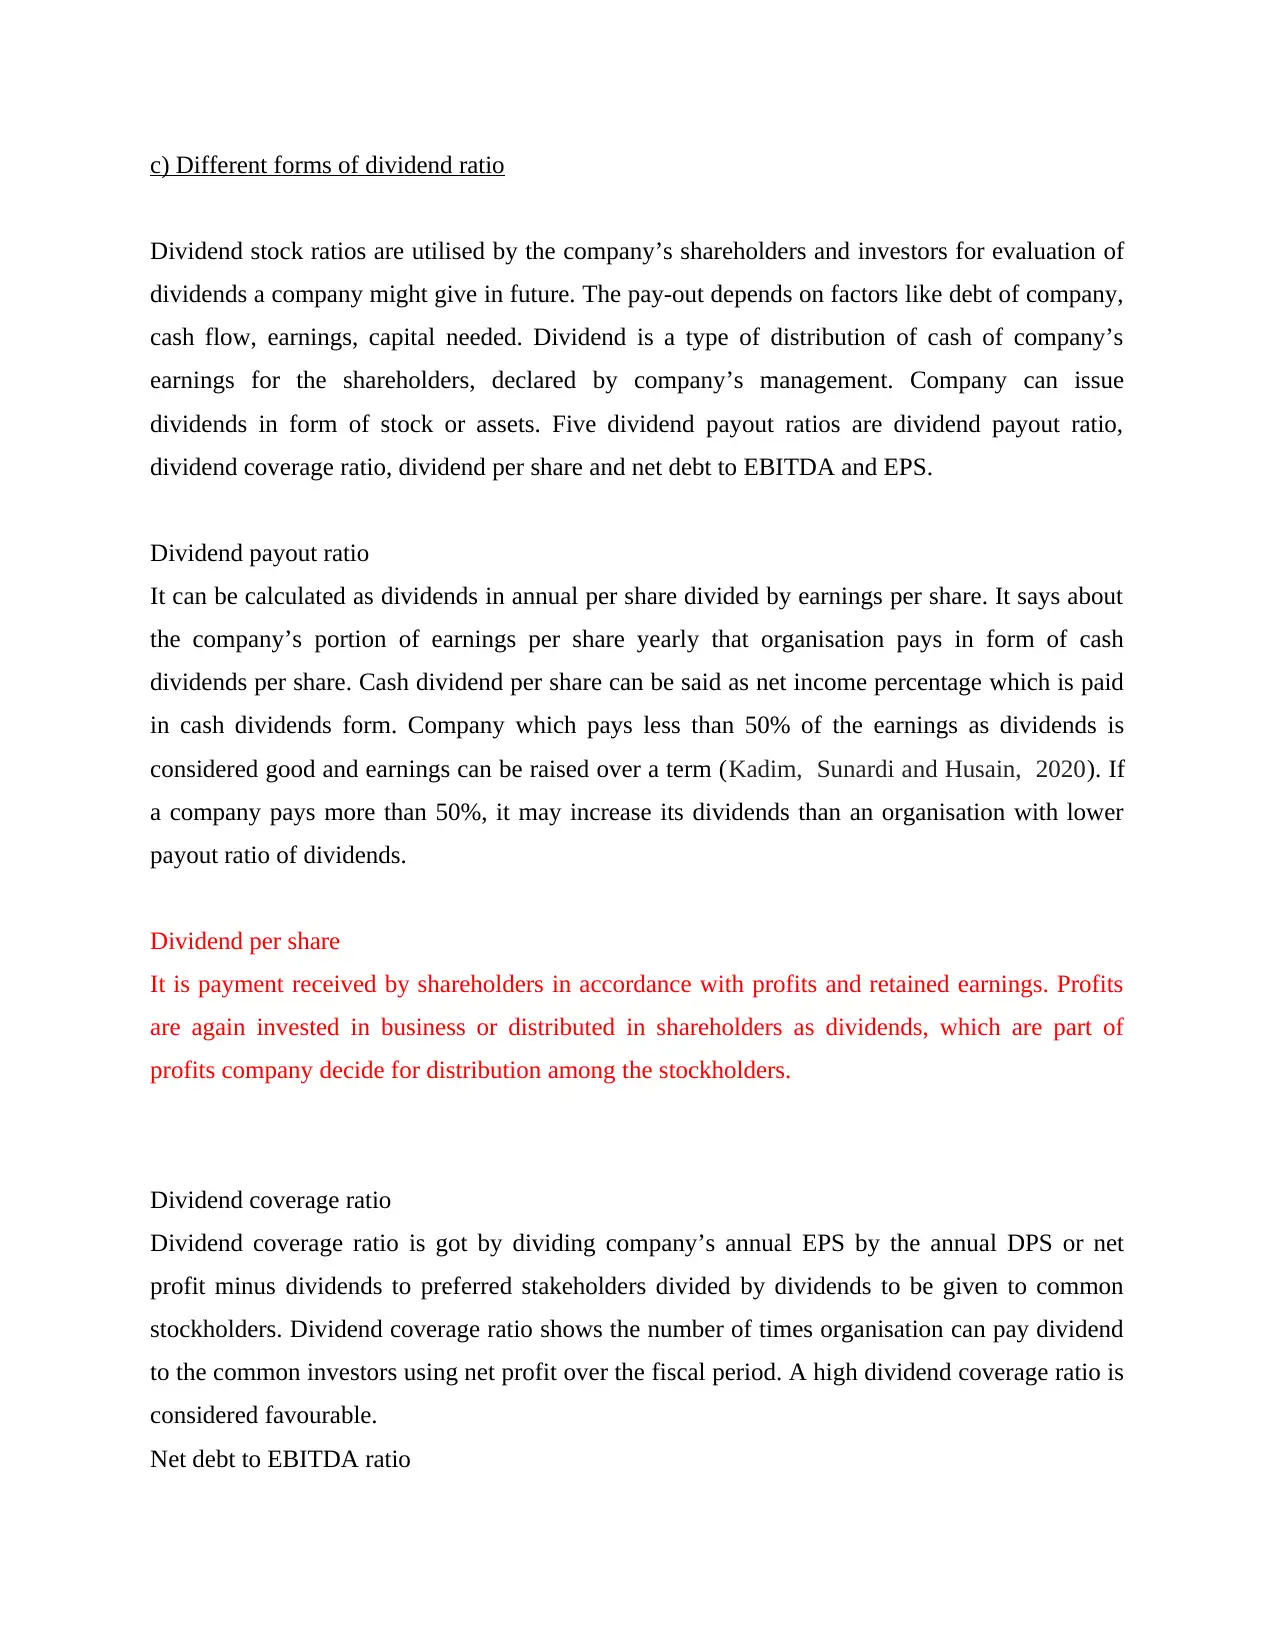
c) Different forms of dividend ratio
Dividend stock ratios are utilised by the company’s shareholders and investors for evaluation of
dividends a company might give in future. The pay-out depends on factors like debt of company,
cash flow, earnings, capital needed. Dividend is a type of distribution of cash of company’s
earnings for the shareholders, declared by company’s management. Company can issue
dividends in form of stock or assets. Five dividend payout ratios are dividend payout ratio,
dividend coverage ratio, dividend per share and net debt to EBITDA and EPS.
Dividend payout ratio
It can be calculated as dividends in annual per share divided by earnings per share. It says about
the company’s portion of earnings per share yearly that organisation pays in form of cash
dividends per share. Cash dividend per share can be said as net income percentage which is paid
in cash dividends form. Company which pays less than 50% of the earnings as dividends is
considered good and earnings can be raised over a term (Kadim, Sunardi and Husain, 2020). If
a company pays more than 50%, it may increase its dividends than an organisation with lower
payout ratio of dividends.
Dividend per share
It is payment received by shareholders in accordance with profits and retained earnings. Profits
are again invested in business or distributed in shareholders as dividends, which are part of
profits company decide for distribution among the stockholders.
Dividend coverage ratio
Dividend coverage ratio is got by dividing company’s annual EPS by the annual DPS or net
profit minus dividends to preferred stakeholders divided by dividends to be given to common
stockholders. Dividend coverage ratio shows the number of times organisation can pay dividend
to the common investors using net profit over the fiscal period. A high dividend coverage ratio is
considered favourable.
Net debt to EBITDA ratio
Paraphrase This Document
Need a fresh take? Get an instant paraphrase of this document with our AI Paraphraser
The ratio can be got by division of company’s liability in total less cash and equivalent by
EBITDA. The ratio says about leverage of company and the ability for meeting the debt. A
company with low ratio as measured against the industry average is more nice for investors. If
company has higher ratio which has been rising over long time, the ratio says that organisation
may do some cutting in it in future (Kadim, Sunardi and Husain, 2020).
Earnings per share
It is prominent financial tool showing the profitability of Next Plc.. It says that profit of company
gets associated with organisation’s common stock. Earnings per share gets allocated to the
company’s common investors with proportion to the common stock average of the organisation
(Yin and Nie, 2021). Earnings per share is company’s net income which can be distributed
among company’s shareholders. There are important points relating to the ratio, which are:
A) Reinvesting decisions: EPS is a prominent factor for the organisation that again invest
their gains in making their business grow.
B) Growth trends: Various trends are there for its growth. The trends give an idea to
company’s investors of gain an organisation has earned in previous years and profit the
company expects in future.
C) Comparison made easy: It is a factor which investors look for when they have to do
comparison of two companies in same sector which makes for good decision in investing.
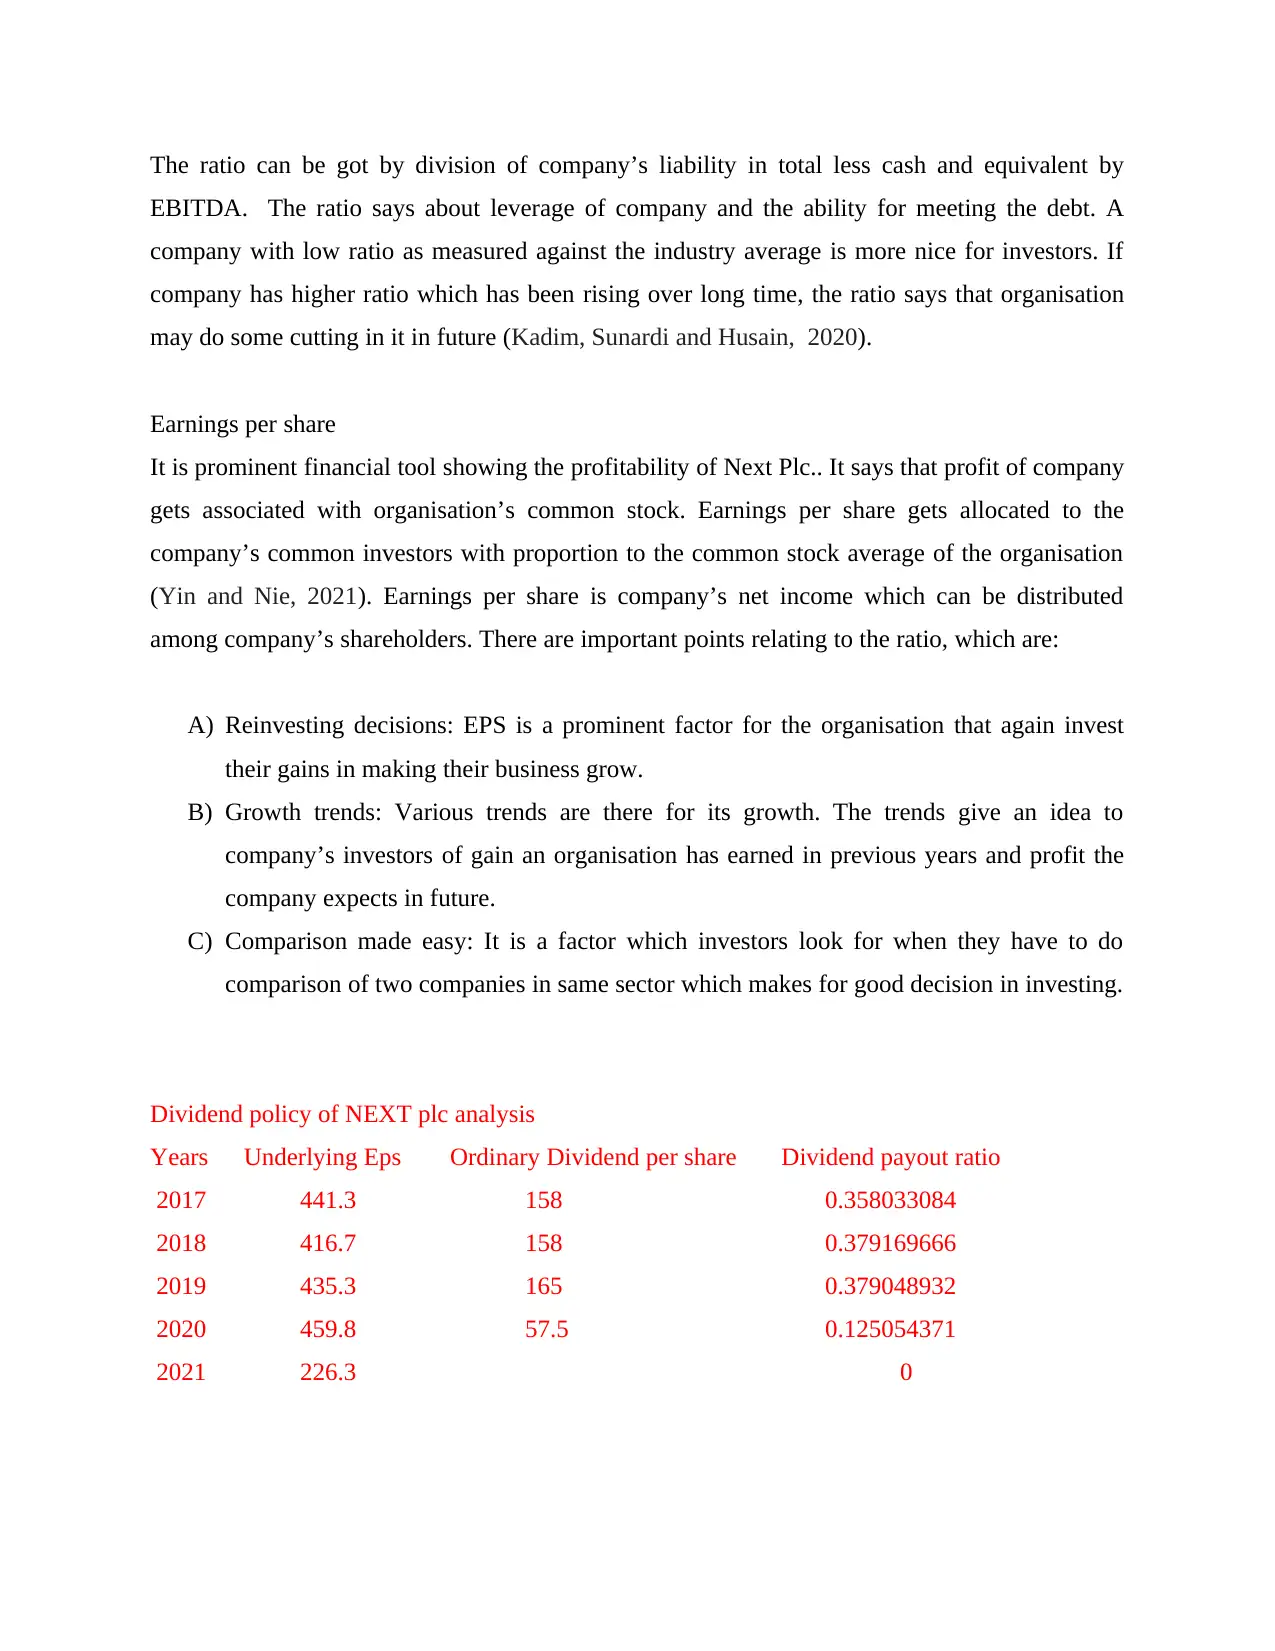
Dividend policy of NEXT plc analysis
Years Underlying Eps Ordinary Dividend per share Dividend payout ratio
2017 441.3 158 0.358033084
2018 416.7 158 0.379169666
2019 435.3 165 0.379048932
2020 459.8 57.5 0.125054371
2021 226.3 0
EBITDA. The ratio says about leverage of company and the ability for meeting the debt. A
company with low ratio as measured against the industry average is more nice for investors. If
company has higher ratio which has been rising over long time, the ratio says that organisation
may do some cutting in it in future (Kadim, Sunardi and Husain, 2020).
Earnings per share
It is prominent financial tool showing the profitability of Next Plc.. It says that profit of company
gets associated with organisation’s common stock. Earnings per share gets allocated to the
company’s common investors with proportion to the common stock average of the organisation
(Yin and Nie, 2021). Earnings per share is company’s net income which can be distributed
among company’s shareholders. There are important points relating to the ratio, which are:
A) Reinvesting decisions: EPS is a prominent factor for the organisation that again invest
their gains in making their business grow.
B) Growth trends: Various trends are there for its growth. The trends give an idea to
company’s investors of gain an organisation has earned in previous years and profit the
company expects in future.
C) Comparison made easy: It is a factor which investors look for when they have to do
comparison of two companies in same sector which makes for good decision in investing.
Dividend policy of NEXT plc analysis
Years Underlying Eps Ordinary Dividend per share Dividend payout ratio
2017 441.3 158 0.358033084
2018 416.7 158 0.379169666
2019 435.3 165 0.379048932
2020 459.8 57.5 0.125054371
2021 226.3 0
Company has seen a stable EPS and stable ratio of dividend pay out from period of 2017 to
2019. In this period company followed a dividend policy which was stable and growth of
dividends were according to earnings of company.
It can be seen that DPS ordinary along with dividends pay out ratio decreased by 65% and 67%
in the financial year of 2020 due to pandemic.
From then, NEXT Plc has followed an irregular dividend policy, paying no dividends in fiscal
year 2021.
(D) Suitable investment appraisal technique
Next Plc. Company is among the top automobile business entity. Investment appraisal is
a process that is about to undertake the best susitable decision for the investment decision
making. This entire technique is about to take the best suitable investment decision as a business
entity that can allow the best possible business growth and development opportunity. Companies
like Next Plc. contain plenty of financial resources that always motivate the business entity to
undertake best level of investment decision. Every time Next Plc. Company is looking for any
investment it always hold plenty of option that can allow the business entity to take on the most
suitable and feasible investment option in process to maximise the overall financial outcome of
the business entity (Rezende, Pereira and Penedo, 2019). Investment appraisal technique is
mostly utilise the investment decision on the basis of the financial outcome and investment
involved in undertaking the most suitable investment appraisal decision making. Every time
company take on the investment appraisal decision making it always assess the possible revenue
company would generate against taking up the investment decision making and also the financial
inflow company will generate to undertake the most suitable investment decision making.
CAPM cost of equity calculated in Part A is an effective tool or practice to undertake the
investment decision making in favour of the business entity. This model strategically identifies
the value of cost of equity in favour of the business venture. This model analysis the cost of
equity when it comes to ascertain the best suitable investment decision making in favour of the
organisation (Lin, 2021). Financial professionals at the Next Plc. Company like to use this model
of investment appraisal that clearly indicate about the cost equity holders require to beta in case
of company taking up the investment decision. This model is more suitable appraisal options as it
⊘ This is a preview!⊘
Do you want full access?
Subscribe today to unlock all pages.
Trusted by 1+ million students worldwide
clearly states the expected cost equity holders require to bear in case of taking up the best level
of investment appraisal decision making.
This model of investment appraisal has consumed the yield of few years gilt utilises as a
risk free rate that also changes over a daily basis of volatility. The expected return of market is
also backward looking and also they may not represent the future market return or the return in
the market with the same pace. The assumption is also made under this technique is that the
investor can borrow and lend at risk free rate is unattainable in the practical situation. All these
are a part of the cost of equity pricing model of investment appraisal technique (Xiao And et.al.,
2019). This can certainly denote that this model or technique of investment appraisal allow the
investors to understand the actual cost that would be offered against undertake the most suitable
investment decision making in respect to the business venture. Every time Next Plc. company
and its management undertake any type of the investment decision making it always ensue the
method of investment generate the best level of return potential over the chosen investment. This
make and improe the investment technique and assessment of the stakeholder for taking up best
level of investment decision making in the market.
Equity beta on other had is completely unsuitable model for analysing the investment
decision making of the company. This model do not support the business entity with support of
the relevant information that can support the business venture to take up the best level of
investment decision making as an organisation. This model is all about interpreting the overall
cost of the debt undertake by the business entity. This model favour the company to understand
the clear cost of the debt or the funds that Next Plc. Company will undertake or bring out in
against to invest in a certain project or proposal. The use of this model is majorly based on the
aspect and fact that the company require to take on such investment that can cost least value in
against to generate the financial resources (Araújo and Machado, 2018). This model is a suitable
technique to ascertain the best possible source for taking up the investment decision. The aim of
the model is to get to know about the potential source for investing in the project. In current
situation as the Next Plc. Company has been a big name or a brand in the world of business there
are plenty and potential of sources are available that can bring out potential financial resources in
favour of the organisation. The role of this model is to favour and guide the company to get o
know the cost of debt related to each financial source that further company can analysis the most
Paraphrase This Document
Need a fresh take? Get an instant paraphrase of this document with our AI Paraphraser
cheaply financial source that can generate the maximum possible funds for meeting up the
financial requirements of the business entity.
The use of the CAPM model is more appropriate a sit analysis the total cost equity holder
will have to bear in against to generate the financial resources for any of the investment decision
making taken up by the company (Ellahie, 2021). Selection of the source of finance is very
important every time investment decision is making by the business venture. This model
empowers the total cost that the owner of the company requires to meet in against to select an
appropriate financial source.
CONCLUSION
CAPM model is models that indicate and support the company to get to know about the
potential cost that business venture or entity require meeting in against to generate the financial
resources. This is a model that allows the company to understand the possible cost company will
generate in against to approach the financial source for collecting potential resources or funds.
The feature of this model makes it more feasible to use for the company in respect to take up the
best suitable investment decision making.
REFERENCES
Books and journals
Ahmed, I. E., 2017. The impact of corporate governance on islamic banking performance: The
case of UAE islamic banks. Journal of Banking & Finance. 9(9). pp.1-10.
Araújo, R. C. D. C. and Machado, M. A. V., 2018. Book-to-market ratio, return on equity and
Brazilian stock returns. RAUSP Management Journal. 53(3). pp.324-344.
Baker, H. K., Kumar, S. and Pattnaik, D., 2021. Twenty-five years of the journal of corporate
finance: a scientometric analysis. Journal of Corporate Finance. 66. p.101572.
Ellahie, A., 2021. Earnings beta. Review of Accounting Studies. 26(1). pp.81-122.
Kadim, A., Sunardi, N. and Husain, T., 2020. The modeling firm's value based on financial
ratios, intellectual capital and dividend policy. Accounting. 6(5). pp.859-870.
Lin, Q., 2021. The q5 model and its consistency with the intertemporal CAPM. Journal of
Banking & Finance. 127. p.106096.
Lu, J. and Wang, W., 2018. Managerial conservatism, board independence and corporate
innovation. Journal of Corporate Finance. 48. pp.1-16.
Moyo, V. and Mache, F., 2018. Inferring The Cost Of Equity: Does The CAPM Consistently
Outperform The Income And Multiples Valuation Models?. Journal of Applied Business
Research (JABR). 34(3). pp.519-532.
Phuoc, L. T., Kim, K. S. and Su, Y., 2018. Reexamination of Estimating Beta Coecient as a Risk
Measure in CAPM. The Journal of Asian Finance, Economics, and Business. 5(1). pp.11-
16.
Puspitasari, N. F. D., Simbolon, I. P. and Sari, N. N., 2020, May. Cost of Equity: Disclosure,
Size, and Political Connection. In 2nd International Seminar on Business, Economics,
Social Science and Technology (ISBEST 2019) (pp. 46-53). Atlantis Press.
Rezende, C. F., Pereira, V. S. and Penedo, A. S. T., 2019. Asset Pricing Model (CAPM) in
Emerging Markets: Evidence in BRICS nations and comparisons with other
G20. Future Studies Research Journal: Trends and Strategies. 11(2). pp.162-175.
Xiao, Z. And et.al., 2019, December. Empirical Test of the Effectiveness of CAPM for Shanghai
Stock Market-Based on Industry Grouping. In Fourth International Conference on
Economic and Business Management (FEBM 2019) (pp. 63-68). Atlantis Press.
1
⊘ This is a preview!⊘
Do you want full access?
Subscribe today to unlock all pages.
Trusted by 1+ million students worldwide
1 out of 13
Related Documents


Your All-in-One AI-Powered Toolkit for Academic Success.
+13062052269
info@desklib.com
Available 24*7 on WhatsApp / Email
![[object Object]](/_next/static/media/star-bottom.7253800d.svg)
Unlock your academic potential
Copyright © 2020–2026 A2Z Services. All Rights Reserved. Developed and managed by ZUCOL.