NG1S217 Engineering Computing Python Program
VerifiedAdded on 2019/09/19
|7
|1927
|950
Practical Assignment
AI Summary
This document outlines a practical assignment for the Engineering Computing Applications course (NG1S217), focusing on developing a Python command-line program. The program requires the implementation of six options, each involving file handling, data manipulation, and plotting. The tasks include reading and formatting data from text files, merging data from multiple files, generating and plotting a sine wave, comparing temperature data from two sensors, and combining data from multiple CSV files. The assignment also includes detailed grading criteria and submission guidelines.
FACULTY of COMPUTING,
ENGINEERING & SCIENCE
Final mark awarded:_____
Assessment Cover Sheet and Feedback Form 2016/17
Module Code:
NG1S217
Module Title:
Engineering Computing
Applications
Module Lecturer:
Palaniappan Valliappan
Assessment Title and Tasks:
Writing Python command line program
Assessment No.
1
No. of pages submitted in total including this page:
Completed by student
Word Count of submission
(if applicable): Completed by student
Date Set:
25 OCT 2016
Submission Date:
4 DEC 2016
Return Date:
20 working days
Part A: Record of Submission (to be completed by Student)
Extenuating Circumstances
If there are any exceptional circumstances that may have affected your ability to undertake or
submit this assignment, make sure you contact the Advice Centre on your campus prior to your
submission deadline.
Fit to sit policy:
The University operates a fit to sit policy whereby you, in submitting or presenting yourself for an
assessment, are declaring that you are fit to sit the assessment. You cannot subsequently claim
that your performance in this assessment was affected by extenuating factors.
Plagiarism and Unfair Practice Declaration:
By submitting this assessment, you declare that it is your own work and that the sources of
information and material you have used (including the internet) have been fully identified and
properly acknowledged as required1. Additionally, the work presented has not been submitted
for any other assessment. You also understand that the Faculty reserves the right to investigate
allegations of plagiarism or unfair practice which, if proven, could result in a fail in this
assessment and may affect your progress.
Intellectual Property and Retention of Student Work:
You understand that the University will retain a copy of any assessments submitted
electronically for evidence and quality assurance purposes; requests for the removal of
assessments will only be considered if the work contains information that is either politically
and/or commercially sensitive (as determined by the University) and where requests are made
by the relevant module leader or dissertation supervisor.
Details of Submission:
Note that all work handed in after the submission date and within 5 working days will be capped
at 40%2. No marks will be awarded if the assessment is submitted after the late submission
date unless extenuating circumstances are applied for and accepted (Advice Centre to be
consulted).
You are required to acknowledge that you
have read the above statements by writing
your student number(s) in the box:
Student Number(s):
1 University Academic Misconduct Regulations
2 Information on exclusions to this rule is available from the Advice Centre at each Campus
Page 1 of 7
Paraphrase This Document
Need a fresh take? Get an instant paraphrase of this document with our AI Paraphraser
IT IS YOUR RESPONSIBILITY TO KEEP RECORDS OF ALL WORK SUBMITTED
Part B: Marking and Assessment
(to be completed by Module Lecturer)
Assessment Task:
This assignment will be marked out of 100.
This assignment contributes to 50% of the total module marks
Title: Writing python command line program
Task: Refer to assignment – programming problem on Page 6 of this document
Assignment to be submitted on blackboard and a printed copy (just stapled on top
left in colour with python keywords highlighted as in the editor, no binding /
folders needed) to myself before submission date. Don’t email as might be
stopped by spam / antivirus programs.
Learning Outcomes to be assessed (as specified in the validated module
descriptor https://icis.southwales.ac.uk/ ):
To write computer code to simulate or solve engineering problems
Grading Criteria:
On next page
Page 2 of 7
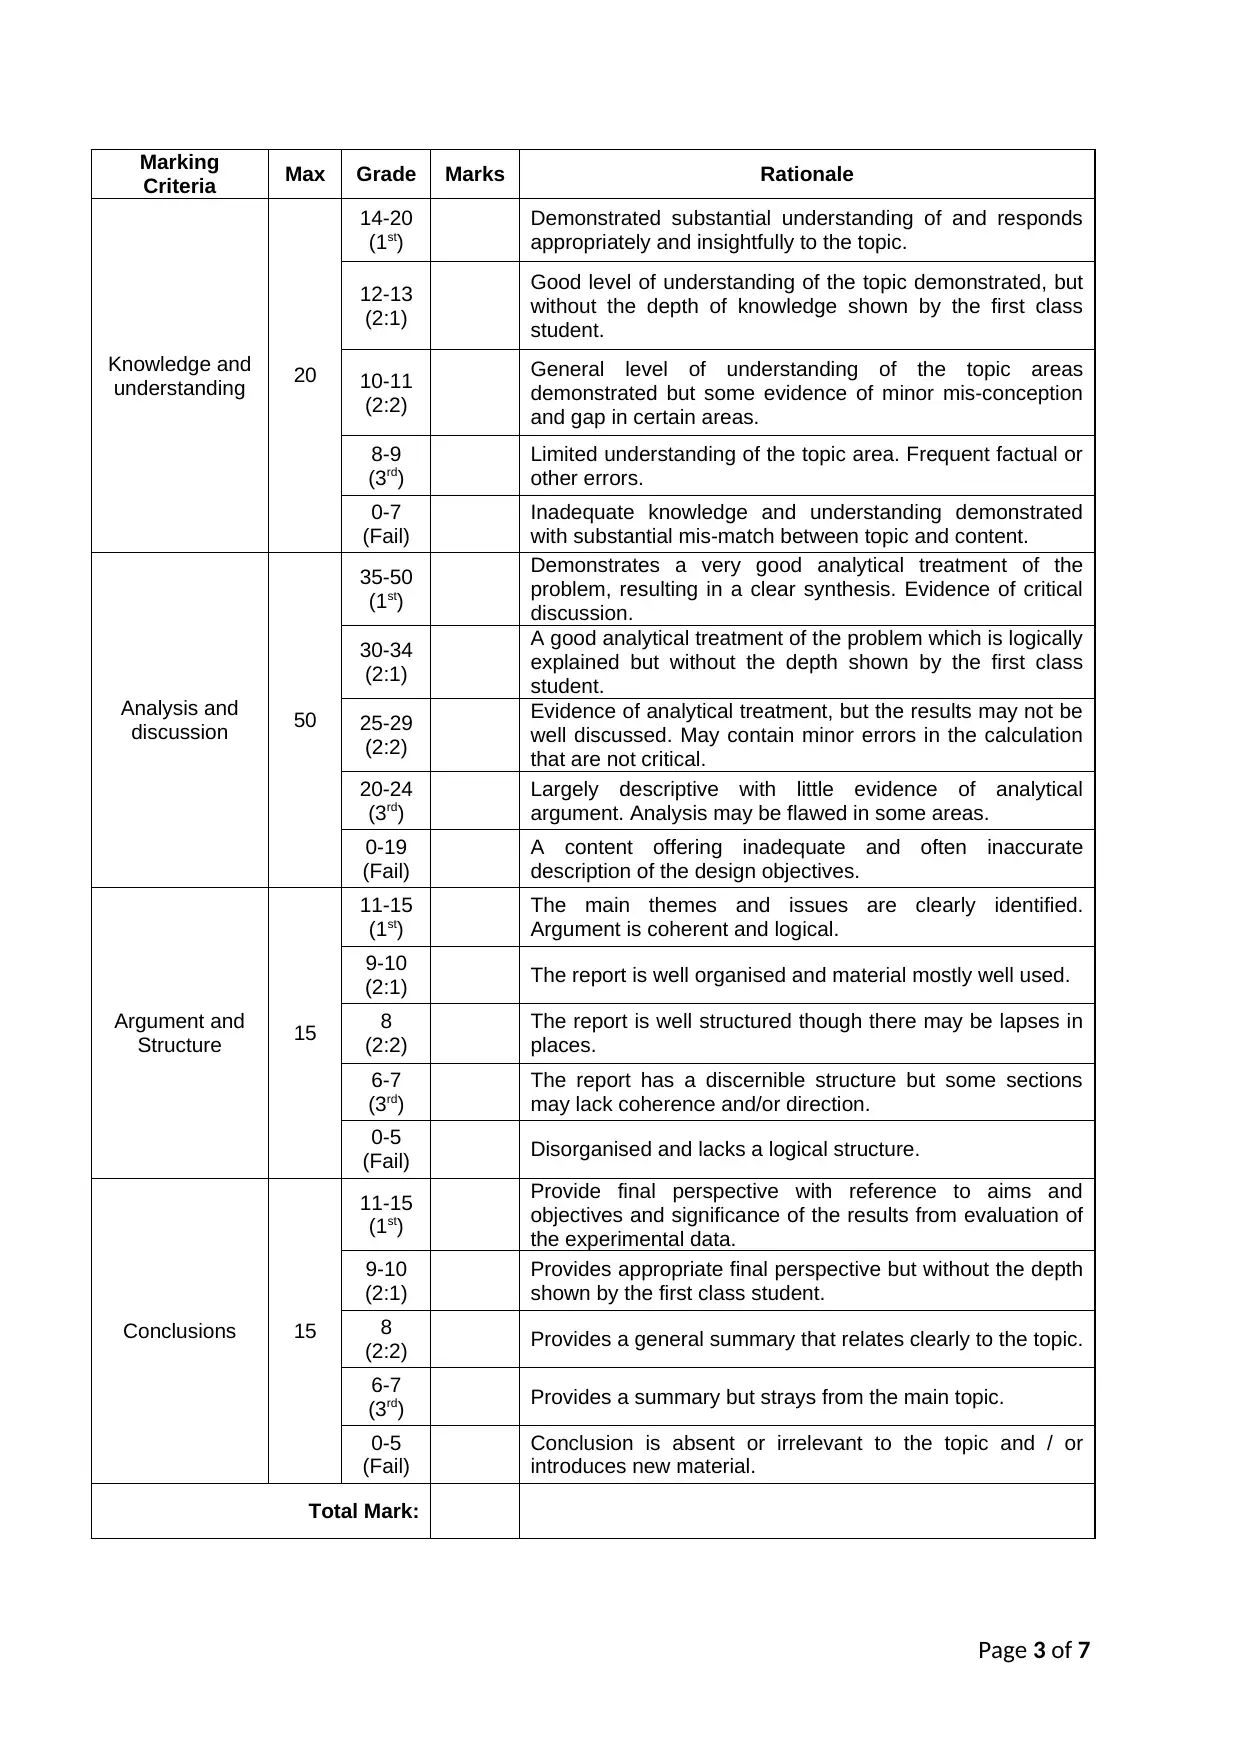
Marking
Criteria Max Grade Marks Rationale
Knowledge and
understanding 20
14-20
(1st)
Demonstrated substantial understanding of and responds
appropriately and insightfully to the topic.
12-13
(2:1)
Good level of understanding of the topic demonstrated, but
without the depth of knowledge shown by the first class
student.
10-11
(2:2)
General level of understanding of the topic areas
demonstrated but some evidence of minor mis-conception
and gap in certain areas.
8-9
(3rd)
Limited understanding of the topic area. Frequent factual or
other errors.
0-7
(Fail)
Inadequate knowledge and understanding demonstrated
with substantial mis-match between topic and content.
Analysis and
discussion 50
35-50
(1st)
Demonstrates a very good analytical treatment of the
problem, resulting in a clear synthesis. Evidence of critical
discussion.
30-34
(2:1)
A good analytical treatment of the problem which is logically
explained but without the depth shown by the first class
student.
25-29
(2:2)
Evidence of analytical treatment, but the results may not be
well discussed. May contain minor errors in the calculation
that are not critical.
20-24
(3rd)
Largely descriptive with little evidence of analytical
argument. Analysis may be flawed in some areas.
0-19
(Fail)
A content offering inadequate and often inaccurate
description of the design objectives.
Argument and
Structure 15
11-15
(1st)
The main themes and issues are clearly identified.
Argument is coherent and logical.
9-10
(2:1) The report is well organised and material mostly well used.
8
(2:2)
The report is well structured though there may be lapses in
places.
6-7
(3rd)
The report has a discernible structure but some sections
may lack coherence and/or direction.
0-5
(Fail) Disorganised and lacks a logical structure.
Conclusions 15
11-15
(1st)
Provide final perspective with reference to aims and
objectives and significance of the results from evaluation of
the experimental data.
9-10
(2:1)
Provides appropriate final perspective but without the depth
shown by the first class student.
8
(2:2) Provides a general summary that relates clearly to the topic.
6-7
(3rd) Provides a summary but strays from the main topic.
0-5
(Fail)
Conclusion is absent or irrelevant to the topic and / or
introduces new material.
Total Mark:
Page 3 of 7
⊘ This is a preview!⊘
Do you want full access?
Subscribe today to unlock all pages.
Trusted by 1+ million students worldwide
Feedback/feed-forward (linked to assessment criteria):
Mark: Marker’s Signature: Date:
Work on this module has been marked, double marked/moderated in
line with USW procedures.
Provisional mark only: subject to change and/or confirmation by the Assessment
Board
Page 4 of 7
Mark: Marker’s Signature: Date:
Work on this module has been marked, double marked/moderated in
line with USW procedures.
Provisional mark only: subject to change and/or confirmation by the Assessment
Board
Page 4 of 7
Paraphrase This Document
Need a fresh take? Get an instant paraphrase of this document with our AI Paraphraser
Part C: Reflections on Assessment
(to be completed by student – optional)
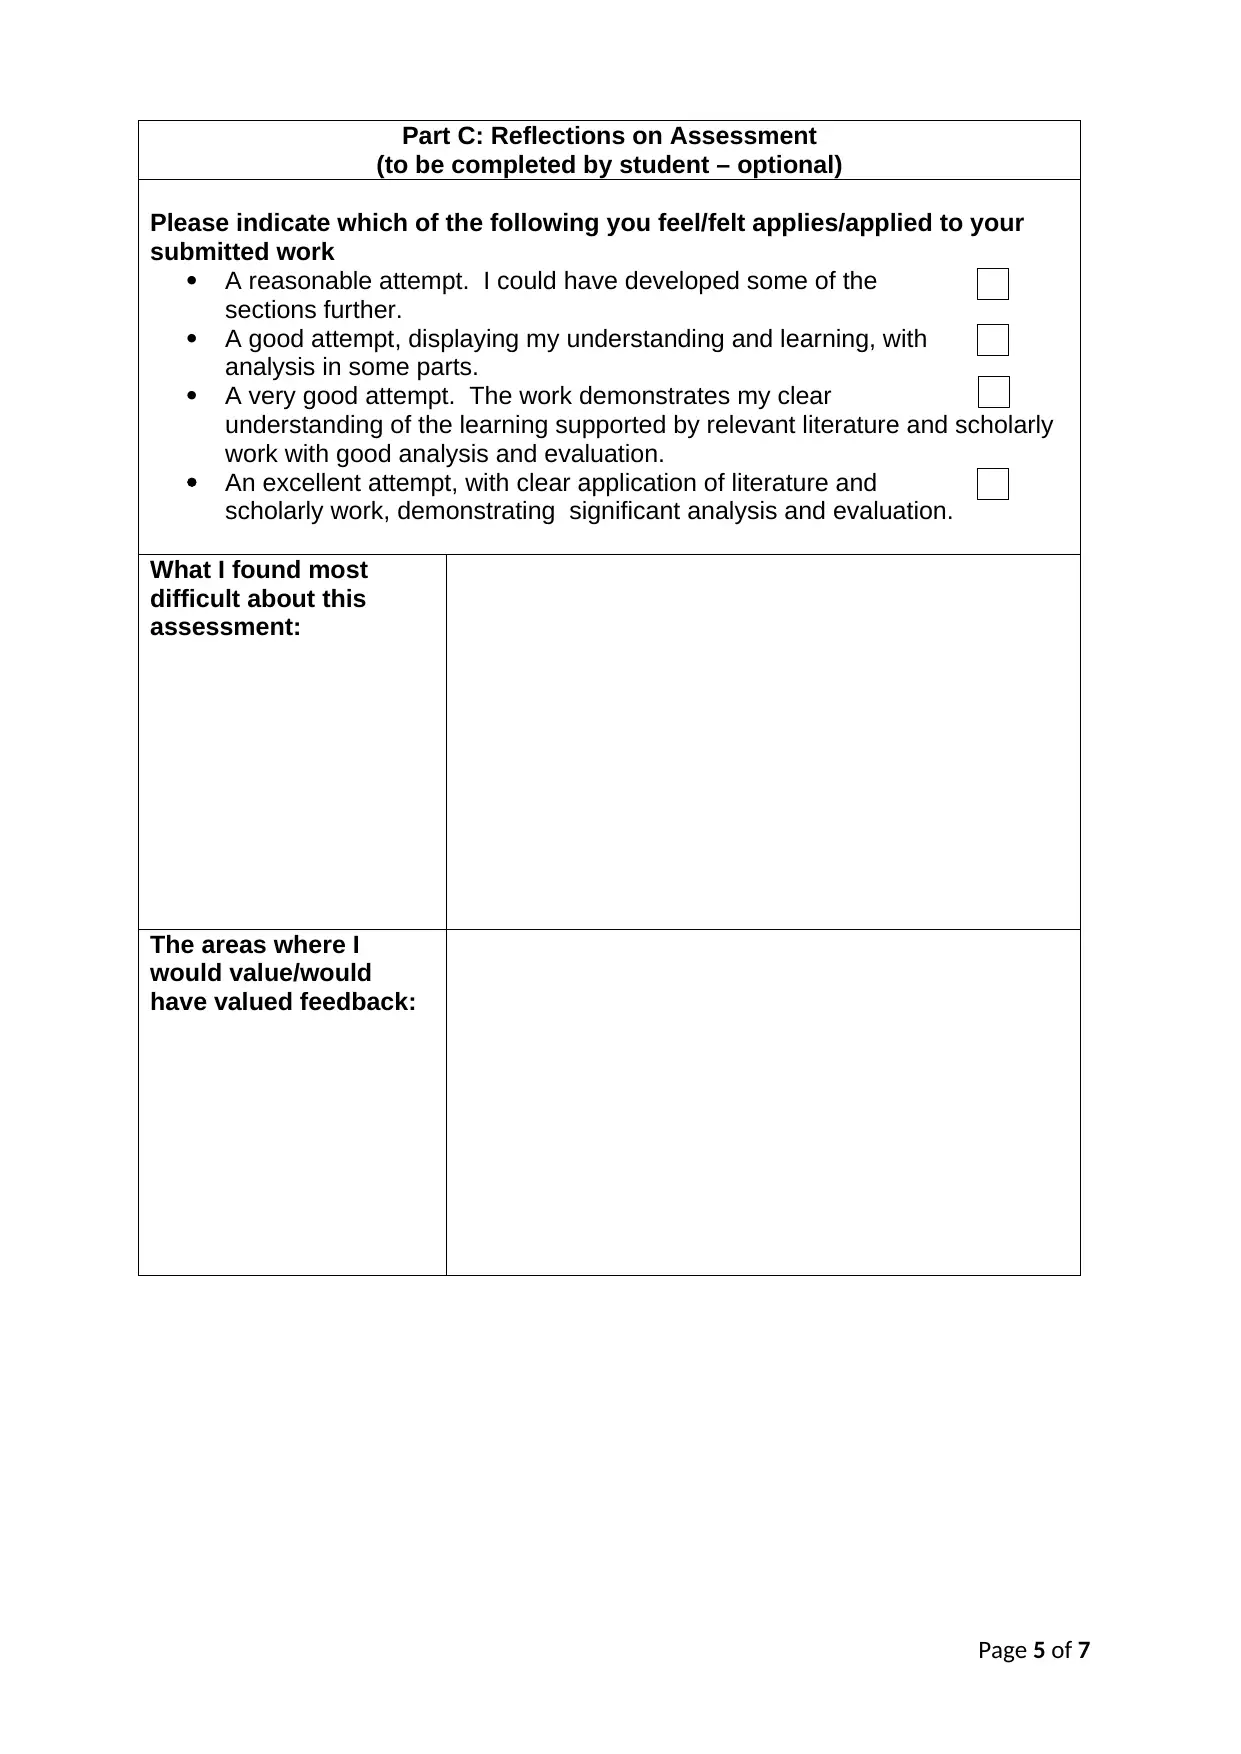
Please indicate which of the following you feel/felt applies/applied to your
submitted work
A reasonable attempt. I could have developed some of the
sections further.
A good attempt, displaying my understanding and learning, with
analysis in some parts.
A very good attempt. The work demonstrates my clear
understanding of the learning supported by relevant literature and scholarly
work with good analysis and evaluation.
An excellent attempt, with clear application of literature and
scholarly work, demonstrating significant analysis and evaluation.
What I found most
difficult about this
assessment:
The areas where I
would value/would
have valued feedback:
Page 5 of 7
(to be completed by student – optional)
Please indicate which of the following you feel/felt applies/applied to your
submitted work
A reasonable attempt. I could have developed some of the
sections further.
A good attempt, displaying my understanding and learning, with
analysis in some parts.
A very good attempt. The work demonstrates my clear
understanding of the learning supported by relevant literature and scholarly
work with good analysis and evaluation.
An excellent attempt, with clear application of literature and
scholarly work, demonstrating significant analysis and evaluation.
What I found most
difficult about this
assessment:
The areas where I
would value/would
have valued feedback:
Page 5 of 7
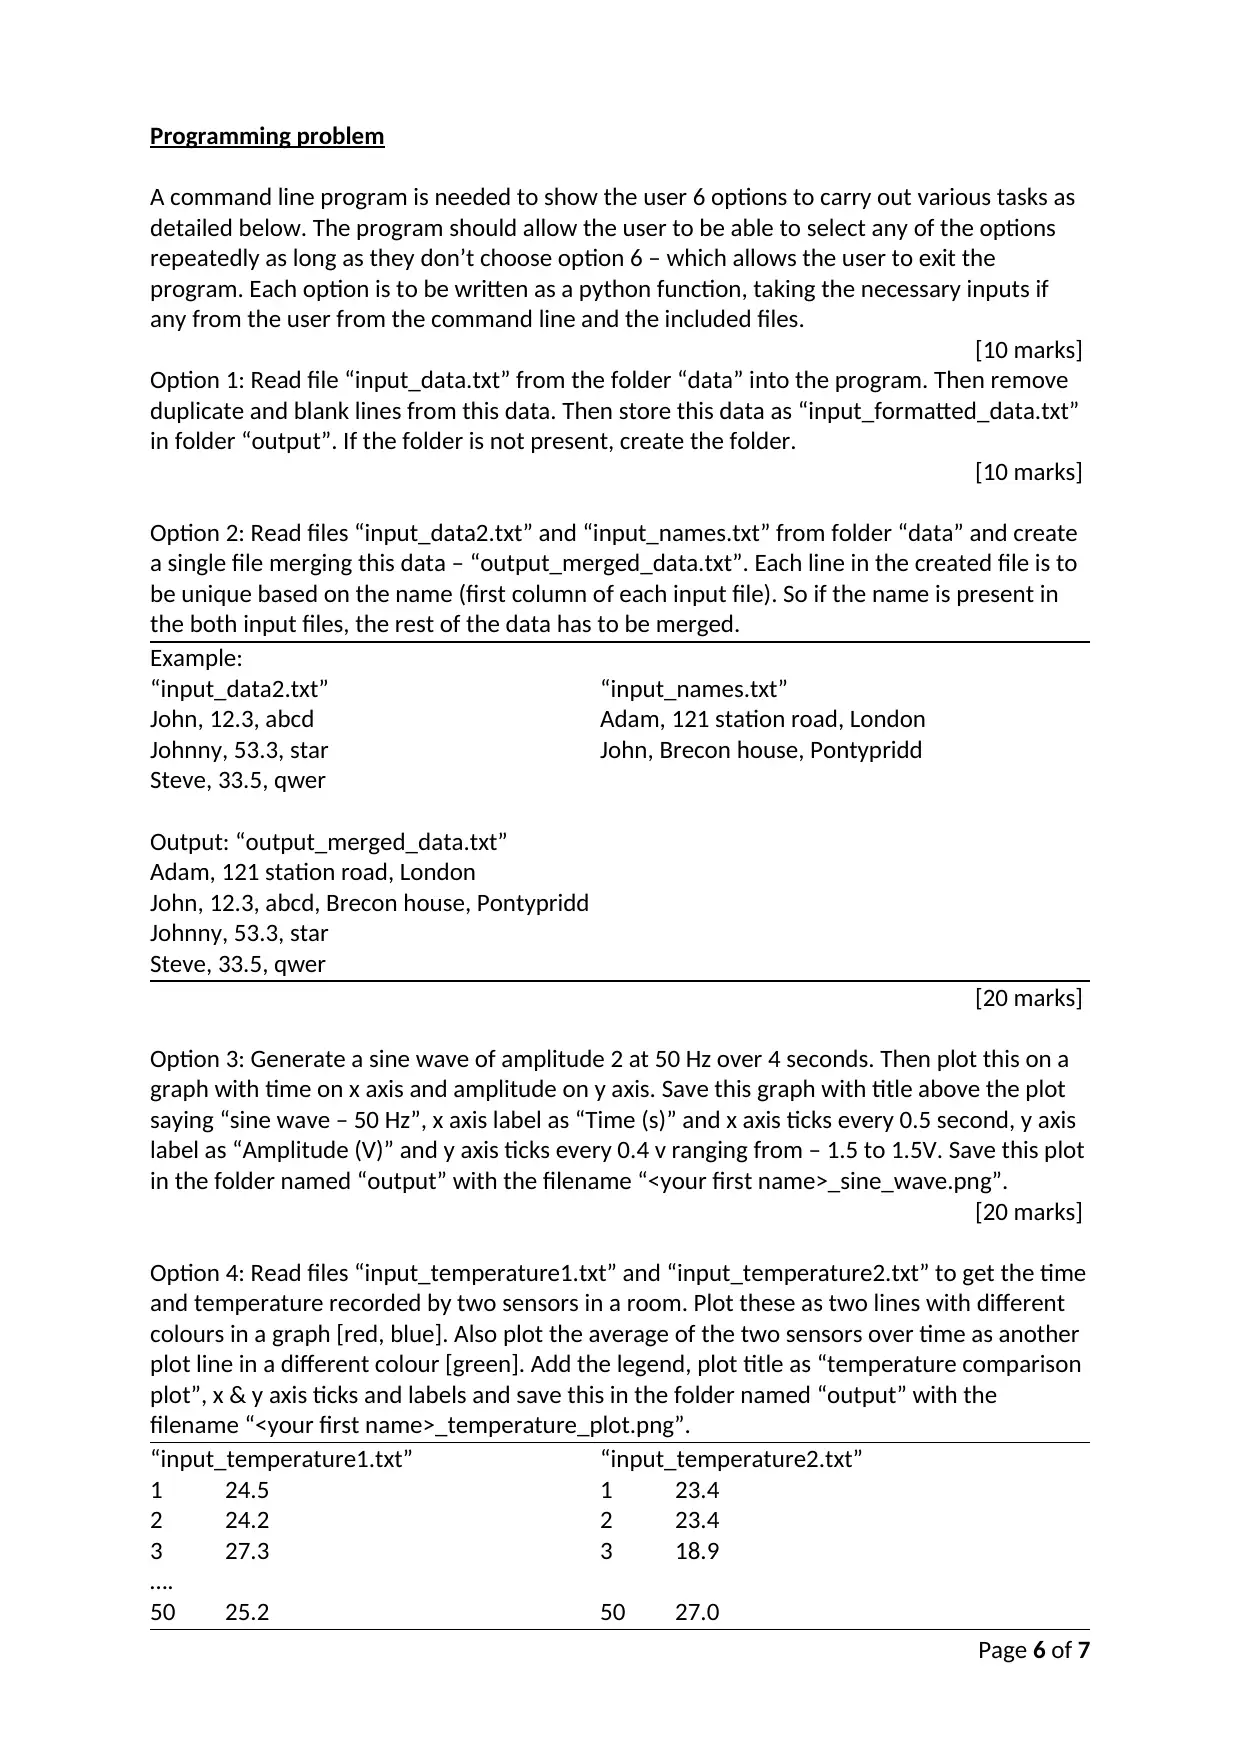
Programming problem
A command line program is needed to show the user 6 options to carry out various tasks as
detailed below. The program should allow the user to be able to select any of the options
repeatedly as long as they don’t choose option 6 – which allows the user to exit the
program. Each option is to be written as a python function, taking the necessary inputs if
any from the user from the command line and the included files.
[10 marks]
Option 1: Read file “input_data.txt” from the folder “data” into the program. Then remove
duplicate and blank lines from this data. Then store this data as “input_formatted_data.txt”
in folder “output”. If the folder is not present, create the folder.
[10 marks]
Option 2: Read files “input_data2.txt” and “input_names.txt” from folder “data” and create
a single file merging this data – “output_merged_data.txt”. Each line in the created file is to
be unique based on the name (first column of each input file). So if the name is present in
the both input files, the rest of the data has to be merged.
Example:
“input_data2.txt” “input_names.txt”
John, 12.3, abcd Adam, 121 station road, London
Johnny, 53.3, star John, Brecon house, Pontypridd
Steve, 33.5, qwer
Output: “output_merged_data.txt”
Adam, 121 station road, London
John, 12.3, abcd, Brecon house, Pontypridd
Johnny, 53.3, star
Steve, 33.5, qwer
[20 marks]
Option 3: Generate a sine wave of amplitude 2 at 50 Hz over 4 seconds. Then plot this on a
graph with time on x axis and amplitude on y axis. Save this graph with title above the plot
saying “sine wave – 50 Hz”, x axis label as “Time (s)” and x axis ticks every 0.5 second, y axis
label as “Amplitude (V)” and y axis ticks every 0.4 v ranging from – 1.5 to 1.5V. Save this plot
in the folder named “output” with the filename “<your first name>_sine_wave.png”.
[20 marks]
Option 4: Read files “input_temperature1.txt” and “input_temperature2.txt” to get the time
and temperature recorded by two sensors in a room. Plot these as two lines with different
colours in a graph [red, blue]. Also plot the average of the two sensors over time as another
plot line in a different colour [green]. Add the legend, plot title as “temperature comparison
plot”, x & y axis ticks and labels and save this in the folder named “output” with the
filename “<your first name>_temperature_plot.png”.
“input_temperature1.txt” “input_temperature2.txt”
1 24.5 1 23.4
2 24.2 2 23.4
3 27.3 3 18.9
….
50 25.2 50 27.0
Page 6 of 7
⊘ This is a preview!⊘
Do you want full access?
Subscribe today to unlock all pages.
Trusted by 1+ million students worldwide
[20 marks]
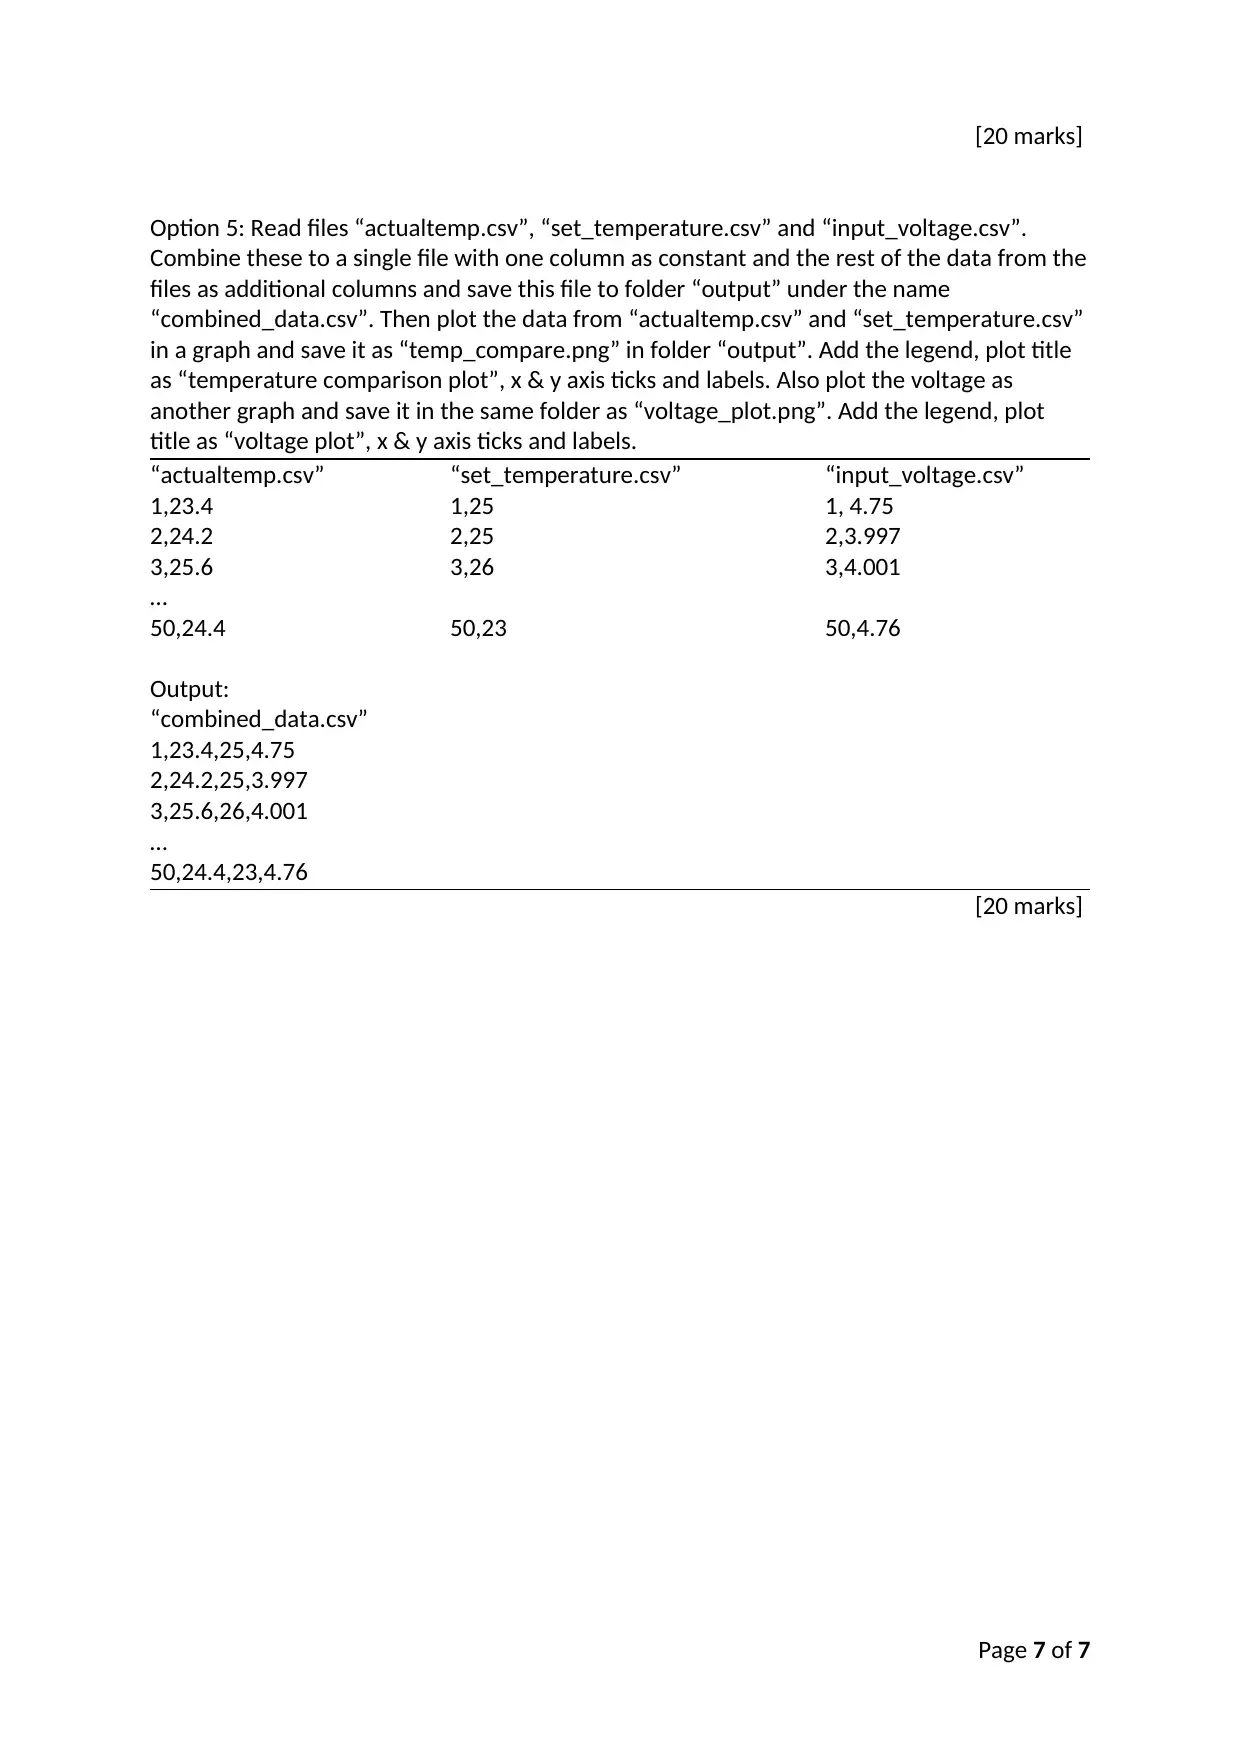
Option 5: Read files “actualtemp.csv”, “set_temperature.csv” and “input_voltage.csv”.
Combine these to a single file with one column as constant and the rest of the data from the
files as additional columns and save this file to folder “output” under the name
“combined_data.csv”. Then plot the data from “actualtemp.csv” and “set_temperature.csv”
in a graph and save it as “temp_compare.png” in folder “output”. Add the legend, plot title
as “temperature comparison plot”, x & y axis ticks and labels. Also plot the voltage as
another graph and save it in the same folder as “voltage_plot.png”. Add the legend, plot
title as “voltage plot”, x & y axis ticks and labels.
“actualtemp.csv” “set_temperature.csv” “input_voltage.csv”
1,23.4 1,25 1, 4.75
2,24.2 2,25 2,3.997
3,25.6 3,26 3,4.001
…
50,24.4 50,23 50,4.76
Output:
“combined_data.csv”
1,23.4,25,4.75
2,24.2,25,3.997
3,25.6,26,4.001
…
50,24.4,23,4.76
[20 marks]
Page 7 of 7
1 out of 7
Related Documents


Your All-in-One AI-Powered Toolkit for Academic Success.
+13062052269
info@desklib.com
Available 24*7 on WhatsApp / Email
![[object Object]](/_next/static/media/star-bottom.7253800d.svg)
Unlock your academic potential
Copyright © 2020–2026 A2Z Services. All Rights Reserved. Developed and managed by ZUCOL.