Financial Analysis of Nice Cars: Liquidity, Leverage, and Share Price
VerifiedAdded on 2022/09/12
|14
|3027
|19
Report
AI Summary
This report provides a comprehensive financial analysis of Nice Cars, examining its performance from 2015 to 2017. The analysis includes a detailed evaluation of various financial ratios, such as liquidity ratios (current and quick ratios), leverage ratios (debt ratio and debt-to-equity ratio), operating leverage, and working capital ratio. The report assesses Nice Cars' ability to manage short-term obligations, its financing strategies, and the efficiency of its operations. Furthermore, the report compares Nice Cars' financial position with those of competitors, Alpine and Peugeot, highlighting their respective strengths and weaknesses. The analysis also delves into the company's cash flow from operations and share price valuation, determining whether the shares are undervalued or overvalued. The findings reveal insights into Nice Cars' financial health, providing a basis for strategic recommendations and decision-making.

Financial Analysis
Paraphrase This Document
Need a fresh take? Get an instant paraphrase of this document with our AI Paraphraser

Financial Analysis 1
Tasks
A. Financial Ratios
Financial Ratio is a relative magnitude of two selected numerical values taken from enterprises
financial position. Financial ratio contains the two numerical values that help to define the
financial situation of the firm. There are different kinds of financial ratios that determine the
financial performance of the company such as profitability, current, solvency, leverage, working
capital and the other ratios. The different financial ratio defines the different area and capabilities
of the firm to generate the profit and the others (Robinson, Henry, Pirie, and Broihahn, 2015). In
this task, the financial ratio has been used to examine the financial performance.
Financial Ratio
Analysis
Nice
cars
2015 2016 2017
Liquidity Ratio
Current Ratio Current assets 91847 102052 106735
Current liabilities 77081 84457 87105
1.19 1.21 1.23
Quick Ratio Quick assets 49875 56627 58821
Current liabilities 77081 84457 87105
0.65 0.67 0.68
Financial Analysis 2
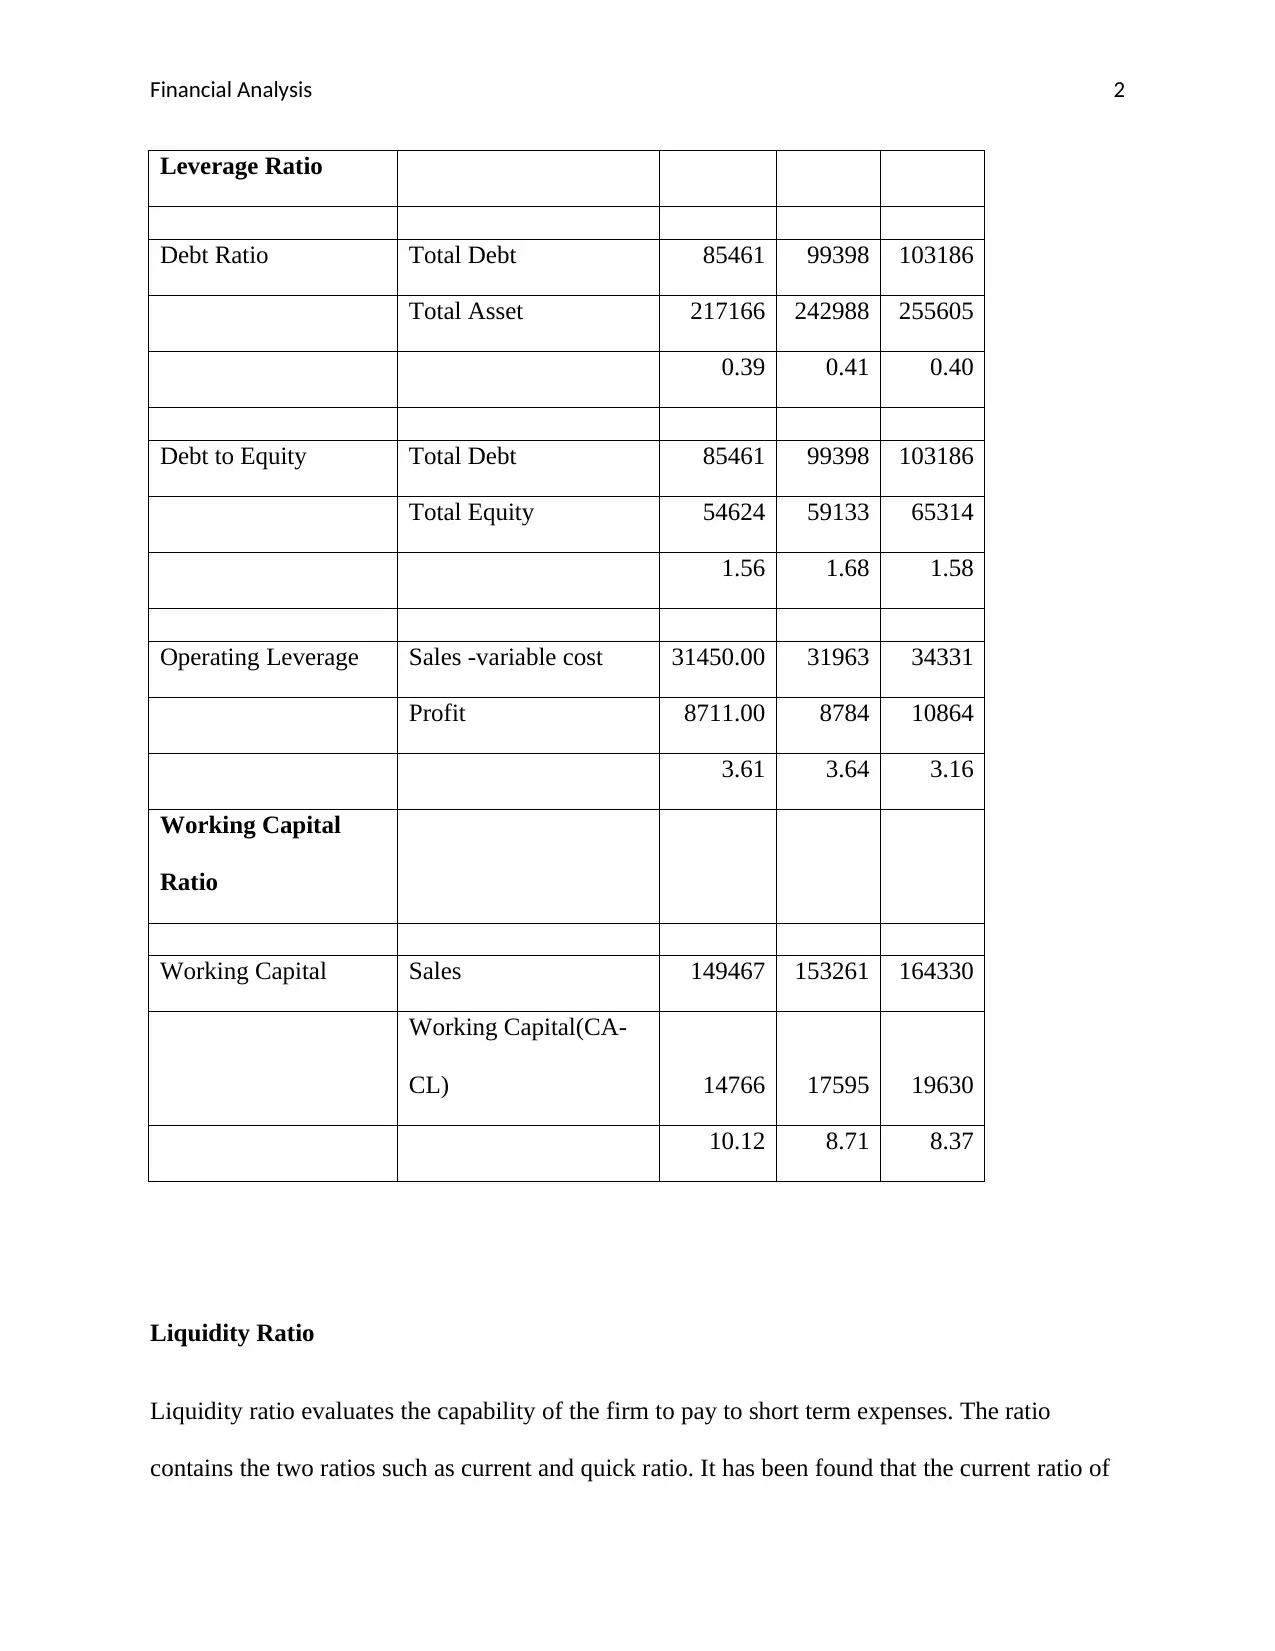
Leverage Ratio
Debt Ratio Total Debt 85461 99398 103186
Total Asset 217166 242988 255605
0.39 0.41 0.40
Debt to Equity Total Debt 85461 99398 103186
Total Equity 54624 59133 65314
1.56 1.68 1.58
Operating Leverage Sales -variable cost 31450.00 31963 34331
Profit 8711.00 8784 10864
3.61 3.64 3.16
Working Capital
Ratio
Working Capital Sales 149467 153261 164330
Working Capital(CA-
CL) 14766 17595 19630
10.12 8.71 8.37
Liquidity Ratio
Liquidity ratio evaluates the capability of the firm to pay to short term expenses. The ratio
contains the two ratios such as current and quick ratio. It has been found that the current ratio of
⊘ This is a preview!⊘
Do you want full access?
Subscribe today to unlock all pages.
Trusted by 1+ million students worldwide

Financial Analysis 3
the firm has been increasing from the three years such 2015-2017. From the last three years, it is
observed that the current ratio of the business is increasing such as 1.19, 1.21 and 1.23 in 2015,
2016 and 2017 respectively. The reason behind the increases of current ratio is increasing current
assets as compare to current liabilities. The increasing current assets depicts that the company
invest in current assets more instead of fixed assets. The increasing current assets as compare to
current liabilities depicts that the firm has the capabilities to pay its all short term obligations.
The evaluation of quick ratio also represents the increasing ratio as the amount of cash in hand
has been increases such as 0.65, 0.67 and 0.68 in 2015, 2016, and 2017 respectively. The
liquidity position of the organization becomes strong that helps to pay the short term
expenditures (Schroeder, Clark, and Cathey, 2019).
Financial Leverage Ratio
Financial leverage ratio evaluates the finance activities of the company. There are two ways in
which the company can finance its operation activities such as issuing equity shares and
borrowing money from other as debt. According to calculation of financial leverage ratio of the
firm, it has been analyzed that the company finance operating activities by borrowing the money
from the third parties. The company prefers to uses the debt as a financial source as compare to
equity. According to the evaluation of debt to equity ratio, it is observed that 1.56, 1.68 and 1.58
are the ratio in the three years such as 2015, 2016 and 2017 respectively. As per the financial
ratio result, it depicts that the company uses the debt as source to finance the operation activities.
It affects the financial position of the company in coming future as debt can increases the
chances of insolvency (Williams, and Dobelman, 2017).
Operation Leverage Ratio
Paraphrase This Document
Need a fresh take? Get an instant paraphrase of this document with our AI Paraphraser

Financial Analysis 4
Operation leverage ratio is a financial efficiency ratio that has been measured percentage of
using the fixed cost in order to generate the profits. As per the calculation of operating leverage
ratio, the amount of leverage ratio is increasing from 3.61, 3.64 and 3.16 in the year 2015, 2016,
and 2017 respectively. The company has the capability to generate the revenue has been
increases.
Working Capital Ratio
Working capital ratio is also a part of liquidity as it helps to evaluate the liquidity of the firm to
pay the short term obligations. The ratio of working capital has been evaluated with the help of
current assets and current liabilities (Storey, Keasey, Watson, and Wynarczyk, 2016). According
to the evaluation of working capital ratio, it has been determined that the situation of capital
employed has been increases from the year 2015, 2016 and 2017 such as 14766, 17595 and
19630 respectively. Sales amount to the company has been increases from the three years but the
ratio of working capital has been decreases. The decreasing working capital ratio 10.12, 8.71 and
8.37 depicts the ability of the firm has been decreases to pay the all the obligations.
B. Financial Ratios of Competitors
In this task, financial position of the firm has been examined and compare with the other
companies in order to evaluate the financial performance of the firm in the market.
Financial
Ratio Analysis
Nice Alp Peu

Financial Analysis 5
cars ine oget
2015 2016
201
7
201
5
201
6
201
7
201
5 2016
201
7
Liquidity
Ratio
Current Ratio Current assets
9184
7
1020
52
106
735
142
952
130
382
128
330
220
31
1942
4
264
99
Current
liabilities
7708
1
8445
7
871
05
577
84
509
61
467
05
309
03
2295
8
292
34
1.19 1.21 1.23 2.47 2.56 2.75
0.7
1 0.85
0.9
1
Quick Ratio Quick assets
4987
5
5662
7
588
21
983
88
860
24
927
38
150
01
1644
7
215
48
Current
liabilities
7708
1
8445
7
871
05
577
84
509
61
467
05
309
03
2295
8
292
34
0.65 0.67 0.68 1.70 1.69 1.99
0.4
9 0.72
0.7
4
Leverage
Ratio
Debt Ratio Total Debt
8546
1
9939
8
103
186
930
2
104
16
982
3
129
85
1000
1
115
51
Total Asset 2171 2429 255 211 205 201 597 4244 451
⊘ This is a preview!⊘
Do you want full access?
Subscribe today to unlock all pages.
Trusted by 1+ million students worldwide

Financial Analysis 6
66 88 605 309 182 857 64 4 53
0.39 0.41 0.40 0.04 0.05 0.05
0.2
2 0.24
0.2
6
Debt to Equity Total Debt
8546
1
9939
8
103
186
930
2
104
16
982
3
129
85
1000
1
115
51
Total Equity
5462
4
5913
3
653
14
123
949
131
534
137
180
104
18
1221
9
146
18
1.56 1.68 1.58 0.08 0.08 0.07
1.2
5 0.82
0.7
9
Operating
Leverage
Sales -variable
cost
3145
0.00
3196
3
343
31
516
36
419
49
422
56
-
364 2733
323
5
Profit
8711.
00 8784
108
64
127
04
109
55
789
4
-
222
7 951
194
4
3.61 3.64 3.16 4.06 3.83 5.35
0.1
6 2.87
1.6
6
Working
Capital Ratio
Working
Capital Sales
1494
67
1532
61
164
330
294
560
273
056
247
751
530
79
5476
7
540
30
Working
Capital(CA-
1476
6
1759
5
196
30
851
68
794
21
816
25
-
887
-
3534
-
273
Paraphrase This Document
Need a fresh take? Get an instant paraphrase of this document with our AI Paraphraser

Financial Analysis 7
CL) 2 5
10.12 8.71 8.37 3.46 3.44 3.04
-
5.9
8
-
15.5
0
-
19.
76
By evaluating the financial ratio of two more automakers companies of French, it is observed
that the financial situation of Alpine is strong as compare to nicecars, and Peugeot. According to
the financial ratio, liquidity position of Alpine is strong as compare to nicecars, and Peugeot
(Alpine, 2016). After the liquidity position, Nicecars have a strong liquidity position in the
market. The amount of current assets is high due to which the capability of Alpine is high in
order to pay short term obligations. The debt to equity ratio of Nice cars is 1.56, 1.68 and 1.58,
Alpine is 0.08, 0.08 and 0.07, and Peugeot is 1.25, 0.82 and 0.79 (Peugeot, 2016). From the
above debt to equity ratio, it is observed that Alpine is the only company that finance the
operating activities by issuing the share instead of debt. But Nicecars is also the company that
finances the operating activities by borrowing the money on debt instead of issuing of equity
shares. Peugeot is also the company that more prefers the debt instead of equity due to which it
debt to equity ratio is less as compare to Nice cars and Alpine companies (Peugeot, 2017).
Increasing the debt of Nicecars increases the risk of insolvency in the coming future. Nicecars
has to issues the share as per the Alpine so that the financing activities will not affect the
financial performance of the organization. Peugeot also has to finance the operation activities by
issuing the shares so that the risk of insolvency has been reduces. At the end, it can be said that
Nicecars have less financial position as compare to Alpine (Alpine, 2017). The company faces

Financial Analysis 8
the financial crisis in coming future and Alpine is the best company in terms of financial
position.
C. Cash Flow From Operations
Cash flow from operations is the section of a firm's cash flow statement. The operating statement
depicts that the amount of cash that has been generated or used from carrying out its operating
activities in a specific period of time. The increasing amount of cash flow of operating activities
states that the company earns the high revenue by selling the goods and investing in further
activities. The increasing cash flow from of operating activities is beneficial for the company.
According to the financial situation of the firm, it has been found that the company operating
activities has been decreases and in the year 2017, the amount of operating activities reflects the
negative amount which is not beneficial for the organization. In the year 2015, 2016, and 2017,
the amount of cash flow from operating activities is 222, 3711, and -1652. In the year 2015, the
amount of operating is 222 which is increasing with the high gap in the year 2016 with the
amount of 3711 which is beneficial for the company. In the year 2017, the amount of operation
activities reflects the negative amount that is -1652. The amount of cash flow from operating
activities has been fluctuated year by year. At the initial year, it is observed that the amount
from operating activities has been increases but after that its getting negative that is not
beneficial for the company.
There are various reasons behind the increasing the amount of cash flow from operating
activities. The biggest reason in this case behind the increasing cash flow from operation
activities is to improve the efficiency in maintaining the current assets with the motive to pay the
current liabilities and the other short term expenses. It is necessary for the firm to maintain the
⊘ This is a preview!⊘
Do you want full access?
Subscribe today to unlock all pages.
Trusted by 1+ million students worldwide

Financial Analysis 9
current assets and current liabilities so that the capabilities to pay the short term obligations have
been increases. Increasing operating activities helps the company to operate effectively and
efficiency in the market. The other reason behind increasing the amount of cash flow from
operation is inventory, account receivable, and sales. The rising amount of these turnovers helps
the organization to operate effectively. It also reflects that the company operates the business for
long term. But decreasing the amount of cash flow from operating activities has also some
reasons which are required to improve by the company for increasing the operation activities.
There are also various reasons behind the decreasing of cash flow from operating activities and
these are declining net income, sales and change in working capital. In this case, the amount of
expenses has been increases in the last three years such as 18247, 19348, and 19432. The amount
of cost of goods sold has been increases due to which the net profit margin of the firm has been
decreasing. The decreasing ratio of net margin and increasing expenses affects the amount of
cash flow from operating activities. These are the reasons in the case of nice cars due to which
the amount of cash flow from operating has been decreases.
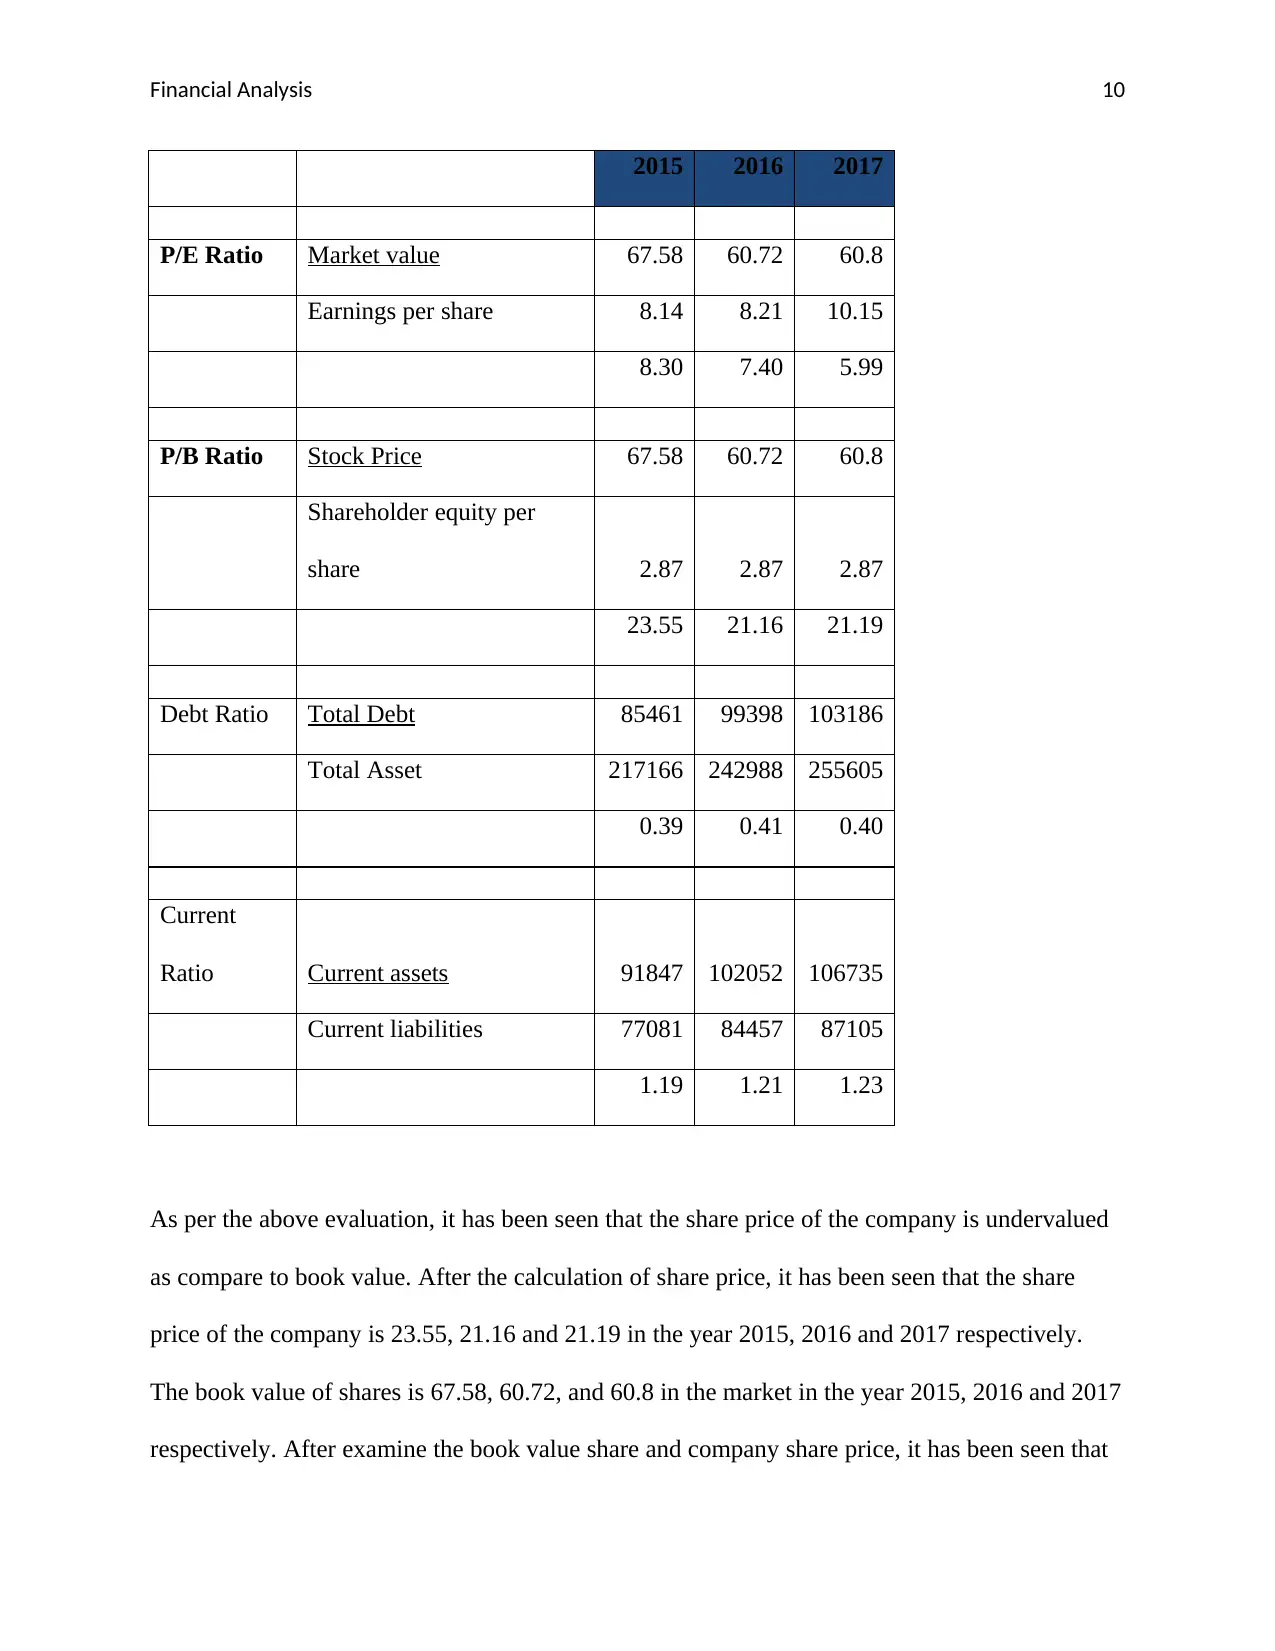
D. Share Price
There are two ways to measures the share prices of the company such as undervalued and
overvalued. The evaluation of share price has been done.
Nice
cars
current assets and current liabilities so that the capabilities to pay the short term obligations have
been increases. Increasing operating activities helps the company to operate effectively and
efficiency in the market. The other reason behind increasing the amount of cash flow from
operation is inventory, account receivable, and sales. The rising amount of these turnovers helps
the organization to operate effectively. It also reflects that the company operates the business for
long term. But decreasing the amount of cash flow from operating activities has also some
reasons which are required to improve by the company for increasing the operation activities.
There are also various reasons behind the decreasing of cash flow from operating activities and
these are declining net income, sales and change in working capital. In this case, the amount of
expenses has been increases in the last three years such as 18247, 19348, and 19432. The amount
of cost of goods sold has been increases due to which the net profit margin of the firm has been
decreasing. The decreasing ratio of net margin and increasing expenses affects the amount of
cash flow from operating activities. These are the reasons in the case of nice cars due to which
the amount of cash flow from operating has been decreases.
D. Share Price
There are two ways to measures the share prices of the company such as undervalued and
overvalued. The evaluation of share price has been done.
Nice
cars
Paraphrase This Document
Need a fresh take? Get an instant paraphrase of this document with our AI Paraphraser
Financial Analysis 10
2015 2016 2017
P/E Ratio Market value 67.58 60.72 60.8
Earnings per share 8.14 8.21 10.15
8.30 7.40 5.99
P/B Ratio Stock Price 67.58 60.72 60.8
Shareholder equity per
share 2.87 2.87 2.87
23.55 21.16 21.19
Debt Ratio Total Debt 85461 99398 103186
Total Asset 217166 242988 255605
0.39 0.41 0.40
Current
Ratio Current assets 91847 102052 106735
Current liabilities 77081 84457 87105
1.19 1.21 1.23
As per the above evaluation, it has been seen that the share price of the company is undervalued
as compare to book value. After the calculation of share price, it has been seen that the share
price of the company is 23.55, 21.16 and 21.19 in the year 2015, 2016 and 2017 respectively.
The book value of shares is 67.58, 60.72, and 60.8 in the market in the year 2015, 2016 and 2017
respectively. After examine the book value share and company share price, it has been seen that

Financial Analysis 11
share price of the firm is undervalued. The value of share of the organization is less as compare
to the market value. The share price of the firm has been decreases continuously year by year due
to which the investors think twice to invest in it (Chen, Ong, and Hsu, 2016).
A. Investors always invest in the company when the share price of the organization that has
been decreases. But in this case, the share price of the firm has been decreases year by
year due to which the chance of increasing the share price value is also less. Investors
have a risk to invest in it by purchasing the shares and also to retain the shares of the
company for long time (Di Tella, 2017). Retain the share of the company increase the
risk for investors because if in the coming future the amount of share has been reduce
then the investors faces the challenges and risk of facing the loss (DeFusco, et. al, 2015).
Being an investor, it is required to sale the shares in the market with the current share
price otherwise the prices of share has been decreases and the chances of facing the loss
is high. Facing the loss is the main reason of reducing the share price of the firm as
compare the share price of the market. The other reason of selling the share price is that
the amount of debt is also increasing due to which in the coming future the company face
the financial crisis. It is observed that the high debt increases the case of insolvency for
the company. As the chances of insolvency has been increases due to which the investors
has the risk of facing the loss instead of profit.
B. Yes, it is observed that the shares of the company are undervalued. By evaluating the
share price, it has been seen that the market price of shares is 67.58, 60.72, and 60.8 in
2015, 2016 and 2017 respectively. But the company share prices are 23.55, 21.16 and
21.19 in 2015, 2016 and 2017 respectively. By comparing the share price of company
⊘ This is a preview!⊘
Do you want full access?
Subscribe today to unlock all pages.
Trusted by 1+ million students worldwide
1 out of 14
Related Documents


Your All-in-One AI-Powered Toolkit for Academic Success.
+13062052269
info@desklib.com
Available 24*7 on WhatsApp / Email
![[object Object]](/_next/static/media/star-bottom.7253800d.svg)
Unlock your academic potential
Copyright © 2020–2026 A2Z Services. All Rights Reserved. Developed and managed by ZUCOL.