Economic Comparison: Nigeria and UK - ISYS40141 Global Business
VerifiedAdded on 2023/05/29
|19
|4065
|373
Report
AI Summary
This report provides a comparative analysis of the economies of Nigeria and the United Kingdom, focusing on GDP per capita, purchasing power parity (PPP), internet usage, and the population aged 65 and above. The analysis reveals that the United Kingdom has a higher GDP per capita and greater internet penetration compared to Nigeria, indicating a higher standard of living and more advanced technological infrastructure. Factors such as physical capital, human capital, and unemployment levels contribute to the economic disparities between the two nations. The report concludes with recommendations for international businesses considering investment in either country, suggesting that while both markets offer opportunities, Nigeria presents a potentially higher growth trajectory due to lower competition and significant expansion potential. Desklib offers additional resources for students studying global business and economics.
COMPARISON OF NIGERIA AND THE UNITED KINGDOM i
COMPARISON OF NIGERIA AND THE UNITED KINGDOM
Student Name
Institutional Affiliation
Facilitator
Course
Date
COMPARISON OF NIGERIA AND THE UNITED KINGDOM
Student Name
Institutional Affiliation
Facilitator
Course
Date
Paraphrase This Document
Need a fresh take? Get an instant paraphrase of this document with our AI Paraphraser
COMPARISON OF NIGERIA AND THE UNITED KINGDOM ii
Abstract
Globalization has been on the rise for the past years. Many businesses have embraced it and have
entered into international trade (Giddens 2018, p.19). Business expansion beyond national
boundaries calls for extensive analysis of macro and microeconomic analysis of the nations of
interest to access business viability in the nations. In this research two nations Nigeria and the
United Kingdom have been analyzed based on three factors namely, the GDP per capita, PPP
(constant 2005 international $), the population aged 65 years and above as a percentage of the
total population and internet usage per 100 people in each nation. The trend for the different data
sets has been established and the viability of international business investment in the two nations
based on the three factors has been accessed.
COMPARISON OF NIGERIA AND THE UNITED KINGDOM iii
Table of Contents
Abstract.......................................................................................................................................................ii
Abbreviations.............................................................................................................................................vi
Introduction.................................................................................................................................................1
Overview of the economies of Nigeria and the United Kingdom................................................................1
Comparisons................................................................................................................................................2
Gross Domestic Product (GDP) per capita, purchasing power parity (PPP) (constant 2005 international
$).............................................................................................................................................................2
Physical capital....................................................................................................................................5
Human capital......................................................................................................................................5
Unemployment....................................................................................................................................5
The meaning of the data to an international business...............................................................................6
Internet users per 100 people...................................................................................................................6
Improved physical infrastructure.........................................................................................................8
The cost of internet..............................................................................................................................8
The meaning of the data to an international business...............................................................................8
Population aged 65 and above (% of total)..............................................................................................9
The meaning of the data to an international business.............................................................................10
Conclusion and Recommendations............................................................................................................10
References.................................................................................................................................................12
⊘ This is a preview!⊘
Do you want full access?
Subscribe today to unlock all pages.
Trusted by 1+ million students worldwide

COMPARISON OF NIGERIA AND THE UNITED KINGDOM iv
List of Figures
Figure 1: Nigeria and the United Kingdom GDP per capita, PPP (constant 2005 international $)..............4
Figure 2: Nigeria and the United Kingdom Internet users (per 100 people)................................................7
Figure 3: Nigeria and the United States Population ages 65 and above (% of total)..................................10
Paraphrase This Document
Need a fresh take? Get an instant paraphrase of this document with our AI Paraphraser
COMPARISON OF NIGERIA AND THE UNITED KINGDOM v
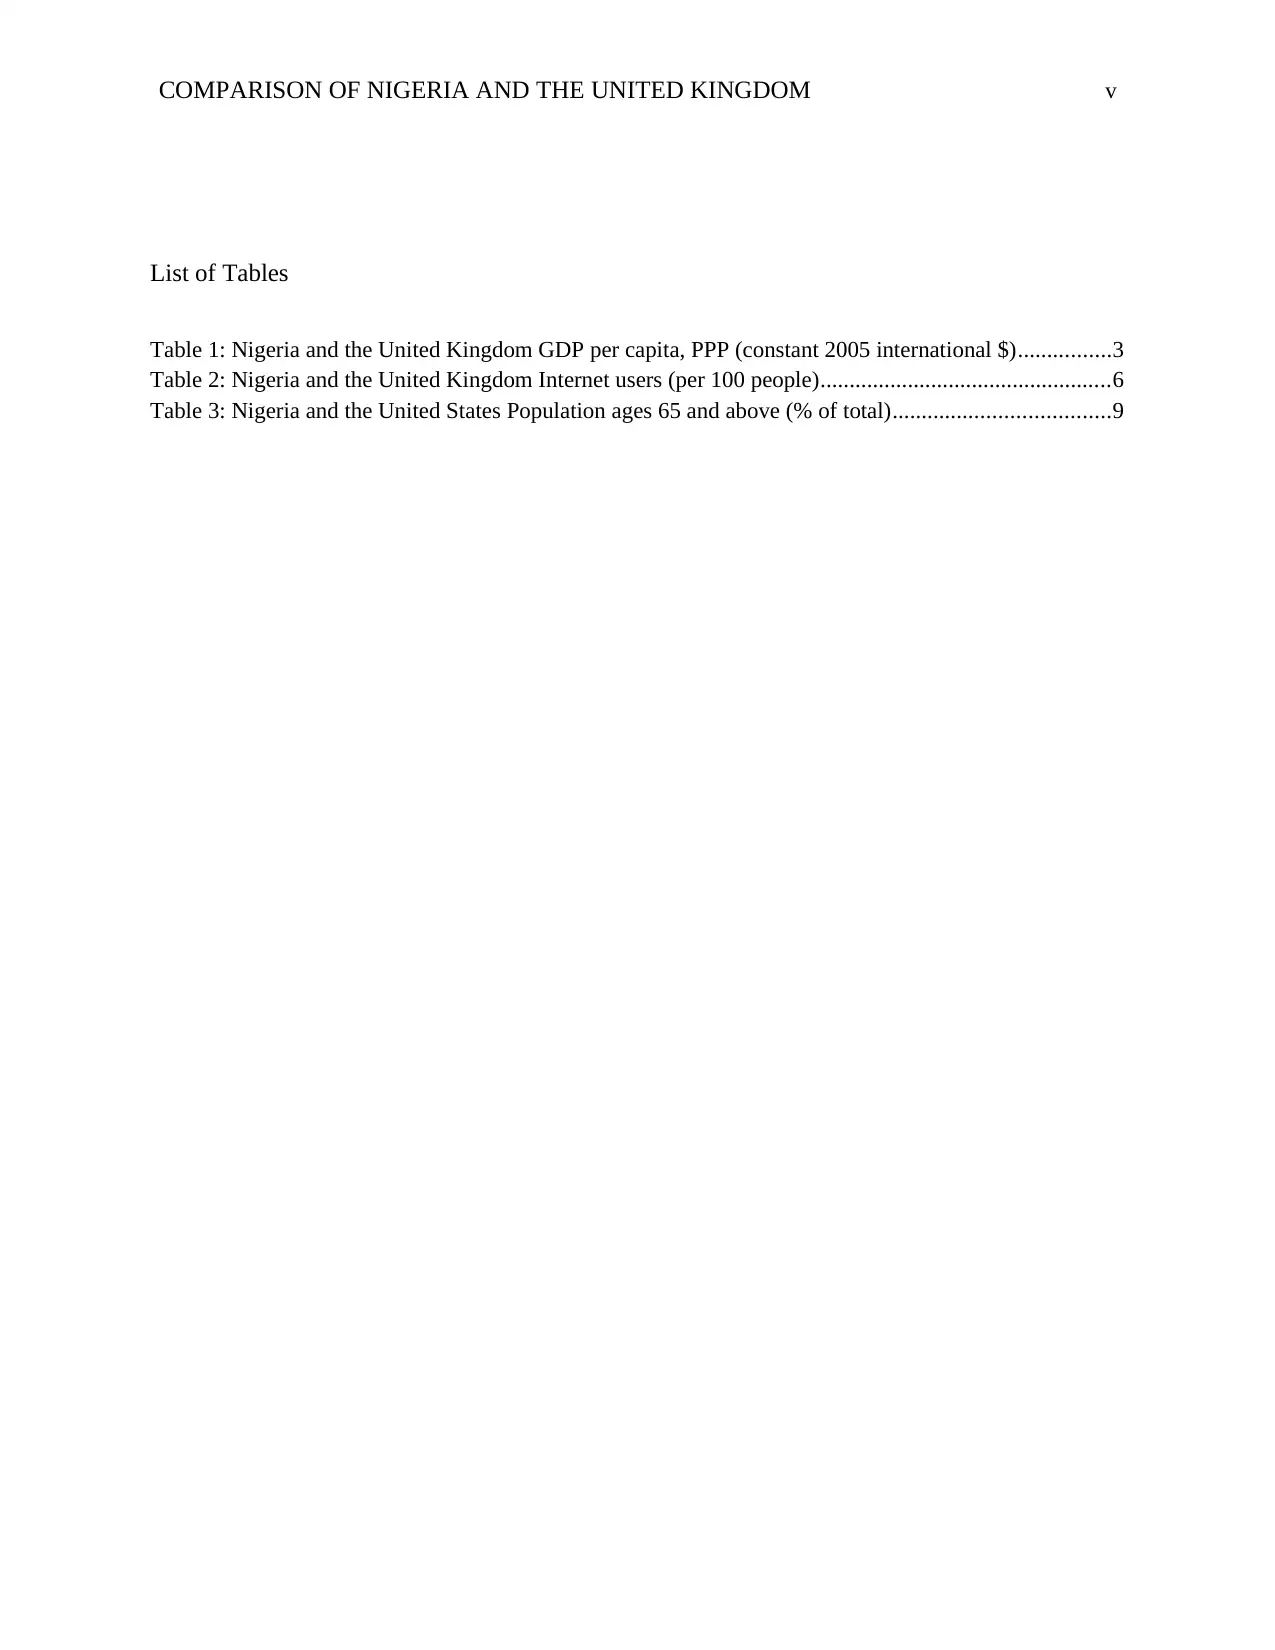
List of Tables
Table 1: Nigeria and the United Kingdom GDP per capita, PPP (constant 2005 international $)................3
Table 2: Nigeria and the United Kingdom Internet users (per 100 people)..................................................6
Table 3: Nigeria and the United States Population ages 65 and above (% of total).....................................9
COMPARISON OF NIGERIA AND THE UNITED KINGDOM vi
Abbreviations
FDIs: Foreign Direct Investments
GDP: Gross Domestic Product
PPP: Purchasing Power Parity
ICT: Information Communication Technology
Abbreviations
FDIs: Foreign Direct Investments
GDP: Gross Domestic Product
PPP: Purchasing Power Parity
ICT: Information Communication Technology
⊘ This is a preview!⊘
Do you want full access?
Subscribe today to unlock all pages.
Trusted by 1+ million students worldwide
COMPARISON OF NIGERIA AND THE UNITED KINGDOM 1
Introduction
Today’s world of business has become more globalized. Many businesses have realized the value
of international trade and have moved a set further to invest in nations across their national
boundaries. Investing in an international market calls for a great scrutiny and analysis of various
macro and microeconomic indicators of the nation of interest (Kadocsa and Francsovics 2011,
p.23). This enables businesses to identify the available opportunities, the level of competition in
the market, government stability and the entire economic factors among others considering the
nation of interest. Businesses access the risks of entering an international market by considering
whether they will make profits or losses in the long run. The topic of interest analyses three key
indicators for two nations namely Nigeria and United Kingdom. These indicators include the
gross domestic product (GDP) per capita, purchasing power parity (PPP) (constant 2005
international $), internet users per 100 people and the population aged 65 and above as a
percentage of the total population.
Overview of the economies of Nigeria and the United Kingdom
The economy of Nigeria has been doing well for the past years with the current economic growth
which is measured in terms of the gross domestic product annual growth rate being estimated to
be 2.7 percent. It has been ranked position 12 out of 47 nations in the Sub-Saharan Africa region
in terms of economic growth. It embraces a free economy but its free market reforms plan have
been implemented at a very slow rate over the past years due to the scarcity of resources in the
nation (Ake 2015, p.85). According to the 2018 Index, Nigeria has been ranked position 104 in
terms of economic freedom with a score of 58.5 which is a relatively low score compared to
some developed nations like the United Kingdom. The overall economic performance of Nigeria
Paraphrase This Document
Need a fresh take? Get an instant paraphrase of this document with our AI Paraphraser
COMPARISON OF NIGERIA AND THE UNITED KINGDOM 2
is above the expected average at regional level but it is still below the expected world average
performance (Aboyade 2013, p.127).
The United Kingdom is among the richest nations not only in the Europe region but also in the
world. It has been doing well in terms of economic performance and still better results are
anticipated in future. It has been ranked position 4 out of 44 nations in the Europe region in
terms of economic performance. It also embraces free economy with well implemented free trade
policies. According to the 2018 index, the United Kingdom is ranked position 8 in terms of
economic freedom with a score of 78.0 which is good but still below some of the developed
nations like the United States. The overall economic performance of the United Kingdom is well
above the expected averages both at the regional and world levels (Tanzi 2010, p.400).
Comparisons
Gross Domestic Product (GDP) per capita, purchasing power parity (PPP)
(constant 2005 international $)
Gross domestic product indicates all the final goods and services market value for a given
country over a period of time. It can be used to access the economic performance of a nation
over a given period of time (Rajewski 2014, p.71). Gross domestic product per capita indicates
the gross domestic product per individual in a given nation. The purchasing power parity
indicates the exchange rate adjustments which should be made between the currencies of two
nations in order to make them equal considering the consumer’s purchasing power in each nation
(Taylor 2013, p.436). It can be used as a tool for comparing consumer levels of income across
different nations. The gross domestic product per capita based on the purchasing power parity
indicates the gross domestic product per individual which has been converted to international
COMPARISON OF NIGERIA AND THE UNITED KINGDOM 3
dollars, usually the US dollar by use of the rates of the purchasing power parity (Carvalho, Diniz,
Lacerda and Mello 2012, p.407). It indicates the standards of living for individuals across
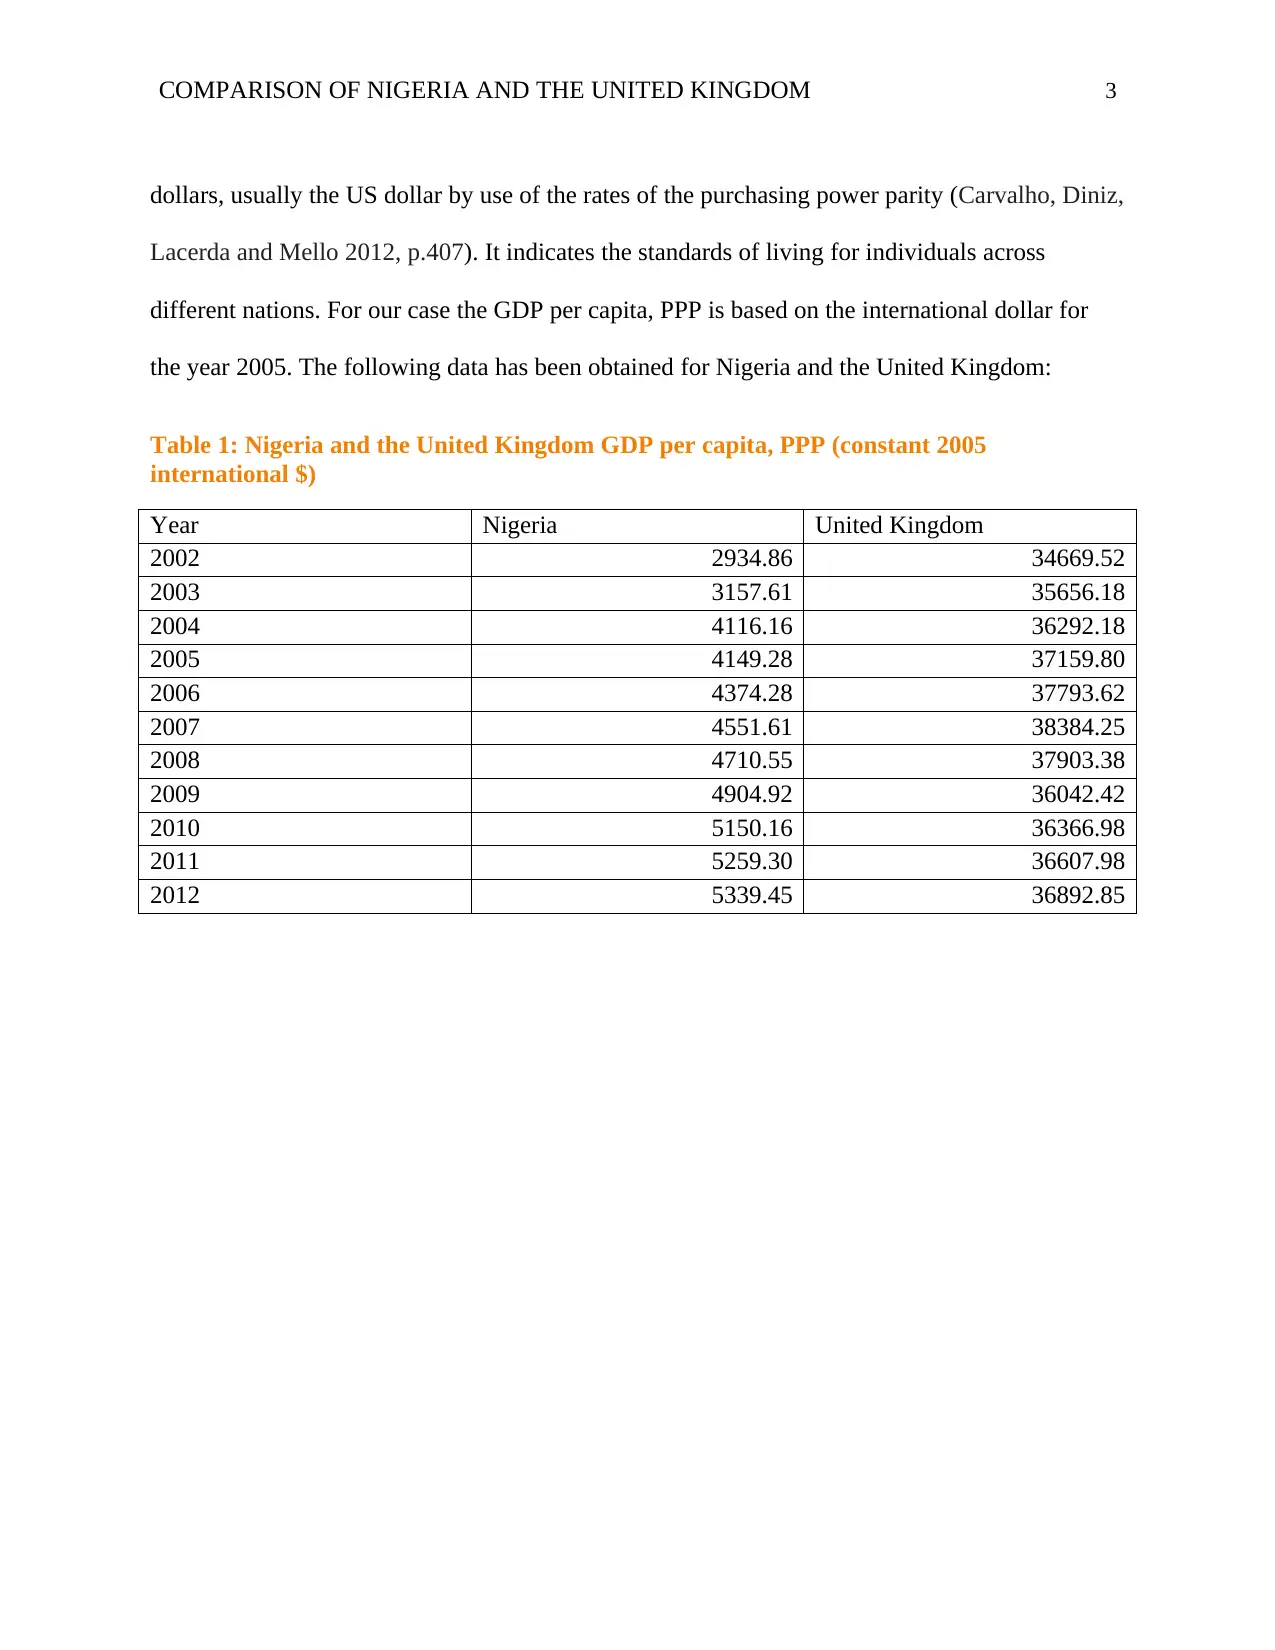
different nations. For our case the GDP per capita, PPP is based on the international dollar for
the year 2005. The following data has been obtained for Nigeria and the United Kingdom:
Table 1: Nigeria and the United Kingdom GDP per capita, PPP (constant 2005
international $)
Year Nigeria United Kingdom
2002 2934.86 34669.52
2003 3157.61 35656.18
2004 4116.16 36292.18
2005 4149.28 37159.80
2006 4374.28 37793.62
2007 4551.61 38384.25
2008 4710.55 37903.38
2009 4904.92 36042.42
2010 5150.16 36366.98
2011 5259.30 36607.98
2012 5339.45 36892.85
dollars, usually the US dollar by use of the rates of the purchasing power parity (Carvalho, Diniz,
Lacerda and Mello 2012, p.407). It indicates the standards of living for individuals across
different nations. For our case the GDP per capita, PPP is based on the international dollar for
the year 2005. The following data has been obtained for Nigeria and the United Kingdom:
Table 1: Nigeria and the United Kingdom GDP per capita, PPP (constant 2005
international $)
Year Nigeria United Kingdom
2002 2934.86 34669.52
2003 3157.61 35656.18
2004 4116.16 36292.18
2005 4149.28 37159.80
2006 4374.28 37793.62
2007 4551.61 38384.25
2008 4710.55 37903.38
2009 4904.92 36042.42
2010 5150.16 36366.98
2011 5259.30 36607.98
2012 5339.45 36892.85
⊘ This is a preview!⊘
Do you want full access?
Subscribe today to unlock all pages.
Trusted by 1+ million students worldwide
COMPARISON OF NIGERIA AND THE UNITED KINGDOM 4
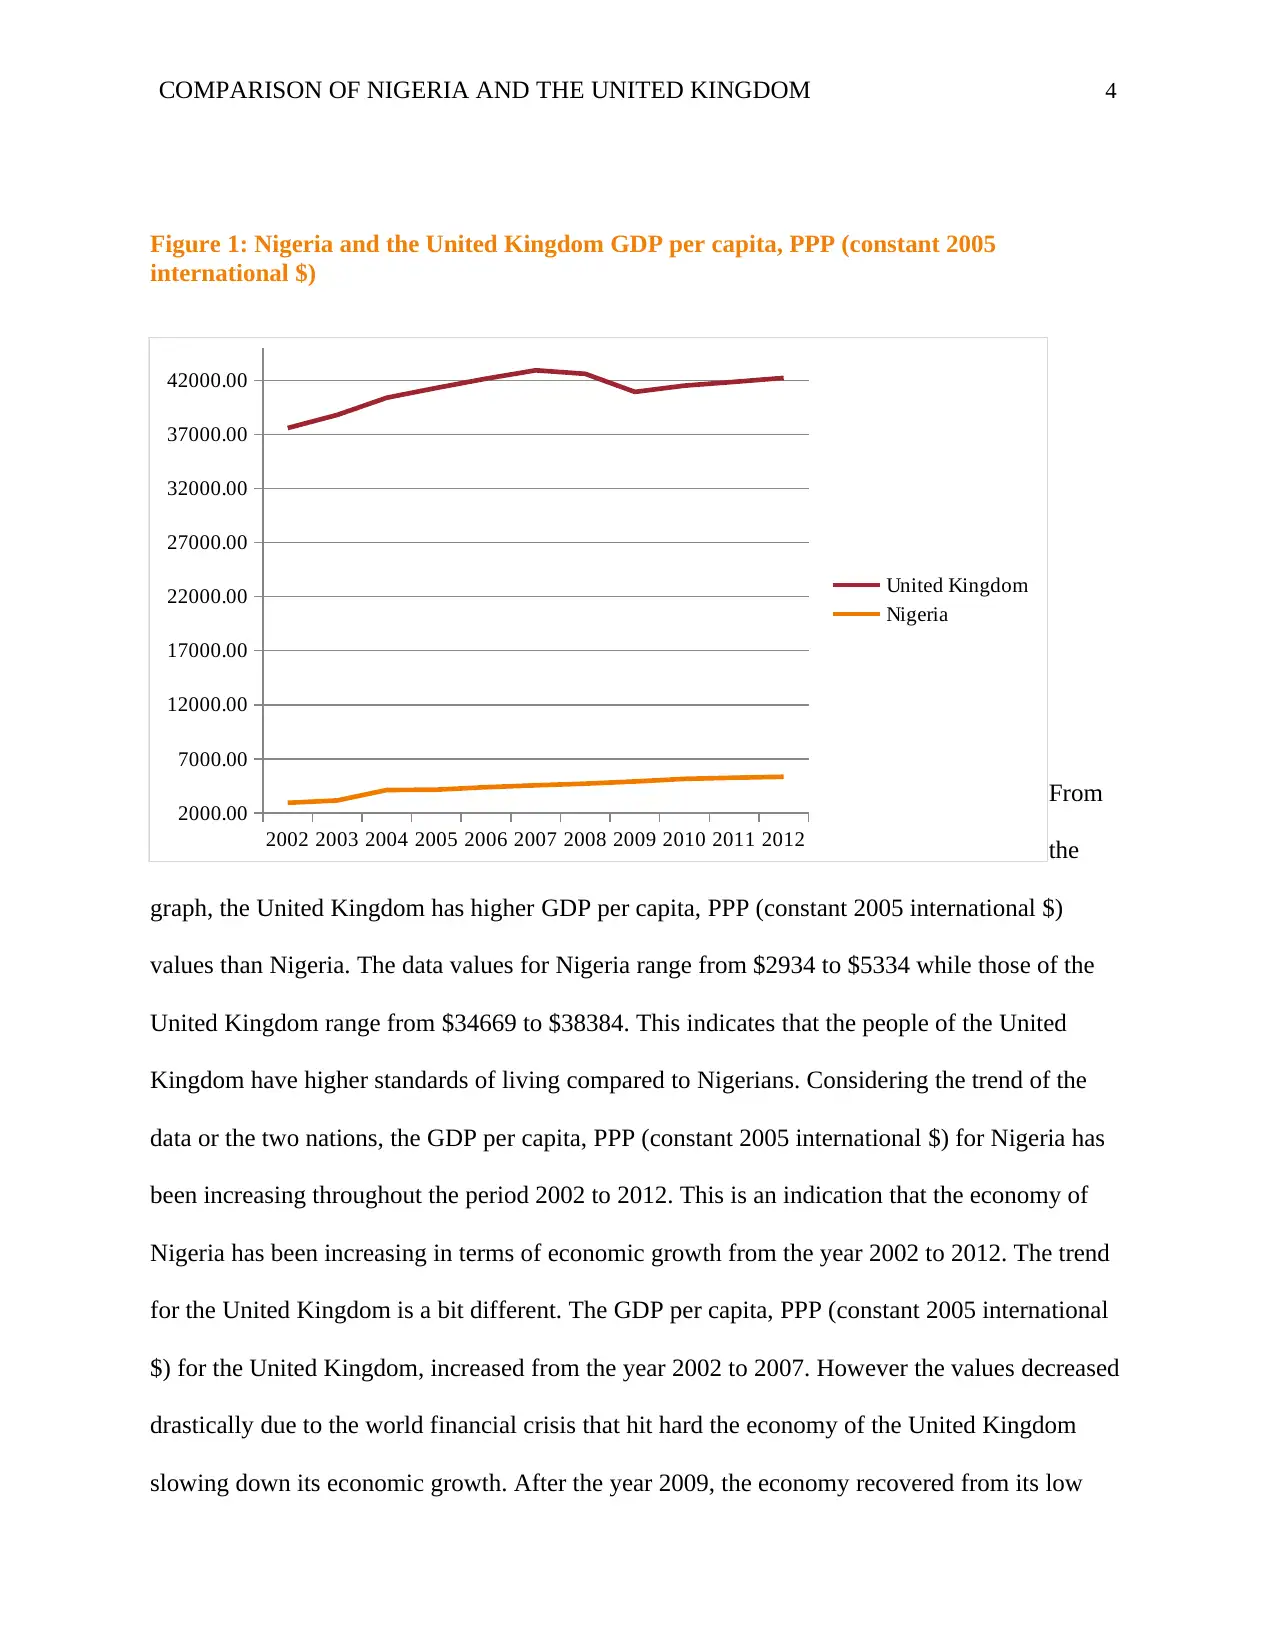
Figure 1: Nigeria and the United Kingdom GDP per capita, PPP (constant 2005
international $)
From
the
graph, the United Kingdom has higher GDP per capita, PPP (constant 2005 international $)
values than Nigeria. The data values for Nigeria range from $2934 to $5334 while those of the
United Kingdom range from $34669 to $38384. This indicates that the people of the United
Kingdom have higher standards of living compared to Nigerians. Considering the trend of the
data or the two nations, the GDP per capita, PPP (constant 2005 international $) for Nigeria has
been increasing throughout the period 2002 to 2012. This is an indication that the economy of
Nigeria has been increasing in terms of economic growth from the year 2002 to 2012. The trend
for the United Kingdom is a bit different. The GDP per capita, PPP (constant 2005 international
$) for the United Kingdom, increased from the year 2002 to 2007. However the values decreased
drastically due to the world financial crisis that hit hard the economy of the United Kingdom
slowing down its economic growth. After the year 2009, the economy recovered from its low
2002 2003 2004 2005 2006 2007 2008 2009 2010 2011 2012
2000.00
7000.00
12000.00
17000.00
22000.00
27000.00
32000.00
37000.00
42000.00
United Kingdom
Nigeria
Paraphrase This Document
Need a fresh take? Get an instant paraphrase of this document with our AI Paraphraser
COMPARISON OF NIGERIA AND THE UNITED KINGDOM 5
performance and continued to grow again. Due to the increase in the economic performance after
the economy recovered, the standards of living of the citizens of the nation started to increase
again. The difference between the two nations is explained by four factors namely the physical
capital, human capital, the level of unemployment and technology.
Physical capital
The physical capital of a country generally refers to its infrastructure. Infrastructure may be in
form of roads, factories and machinery among others. The United Kingdom has an improved
infrastructure compared to Nigeria. The United Kingdom tends to use capital intensive methods
of production which are more productive as compared to the labor intensive methods used by
Nigeria. As a result, the GDP of the United Kingdom is higher than that of Nigeria and hence the
United Kingdom has a higher GDP per capita, PPP converted.
Human capital
Human capital generally reflects the quality of labor of a country (Schultz 2011, p.1).
Considering the period 2002 to 2012, the United Kingdom had heavily invested in human capital
by improving the quality of its education system as compared to Nigeria which had a poor
education system. The highly skilled labor force of the United Kingdom contributed much
towards improving the nation’s productivity and hence its higher GDP per capita, PPP converted.
Unemployment
The level of unemployment reflects the number of people working in a given country (Mortensen
and Pissarides 2014, p.397). Considering the year 2002 to 2012, Nigeria had a higher rate of
unemployment averaging 7 percent as compared to the United Kingdom which had
unemployment rate averaging 5 percent. This means that the United Kingdom had a higher
COMPARISON OF NIGERIA AND THE UNITED KINGDOM 6
population working than that of Nigeria and hence it had a higher GDP per capita, PPP
converted.
The meaning of the data to an international business
As an international business, a higher GDP per capita, PPP converted indicates higher levels of
consumer income. This means that the demand for goods and services will be higher in a nation
which has a higher GDP per capita, PPP converted. Based on the data an investment in United
States is likely to do much better as compared to that in Nigeria.
Also the GDP per capita, PPP converted for both countries has been rising towards the end of the
period. This means that both nations are still expanding in terms of economic growth and hence
one can choose to invest in either nation. However it will be wise to invest in Nigeria since it has
a huge gap of expansion and the level of competition between firms is low.
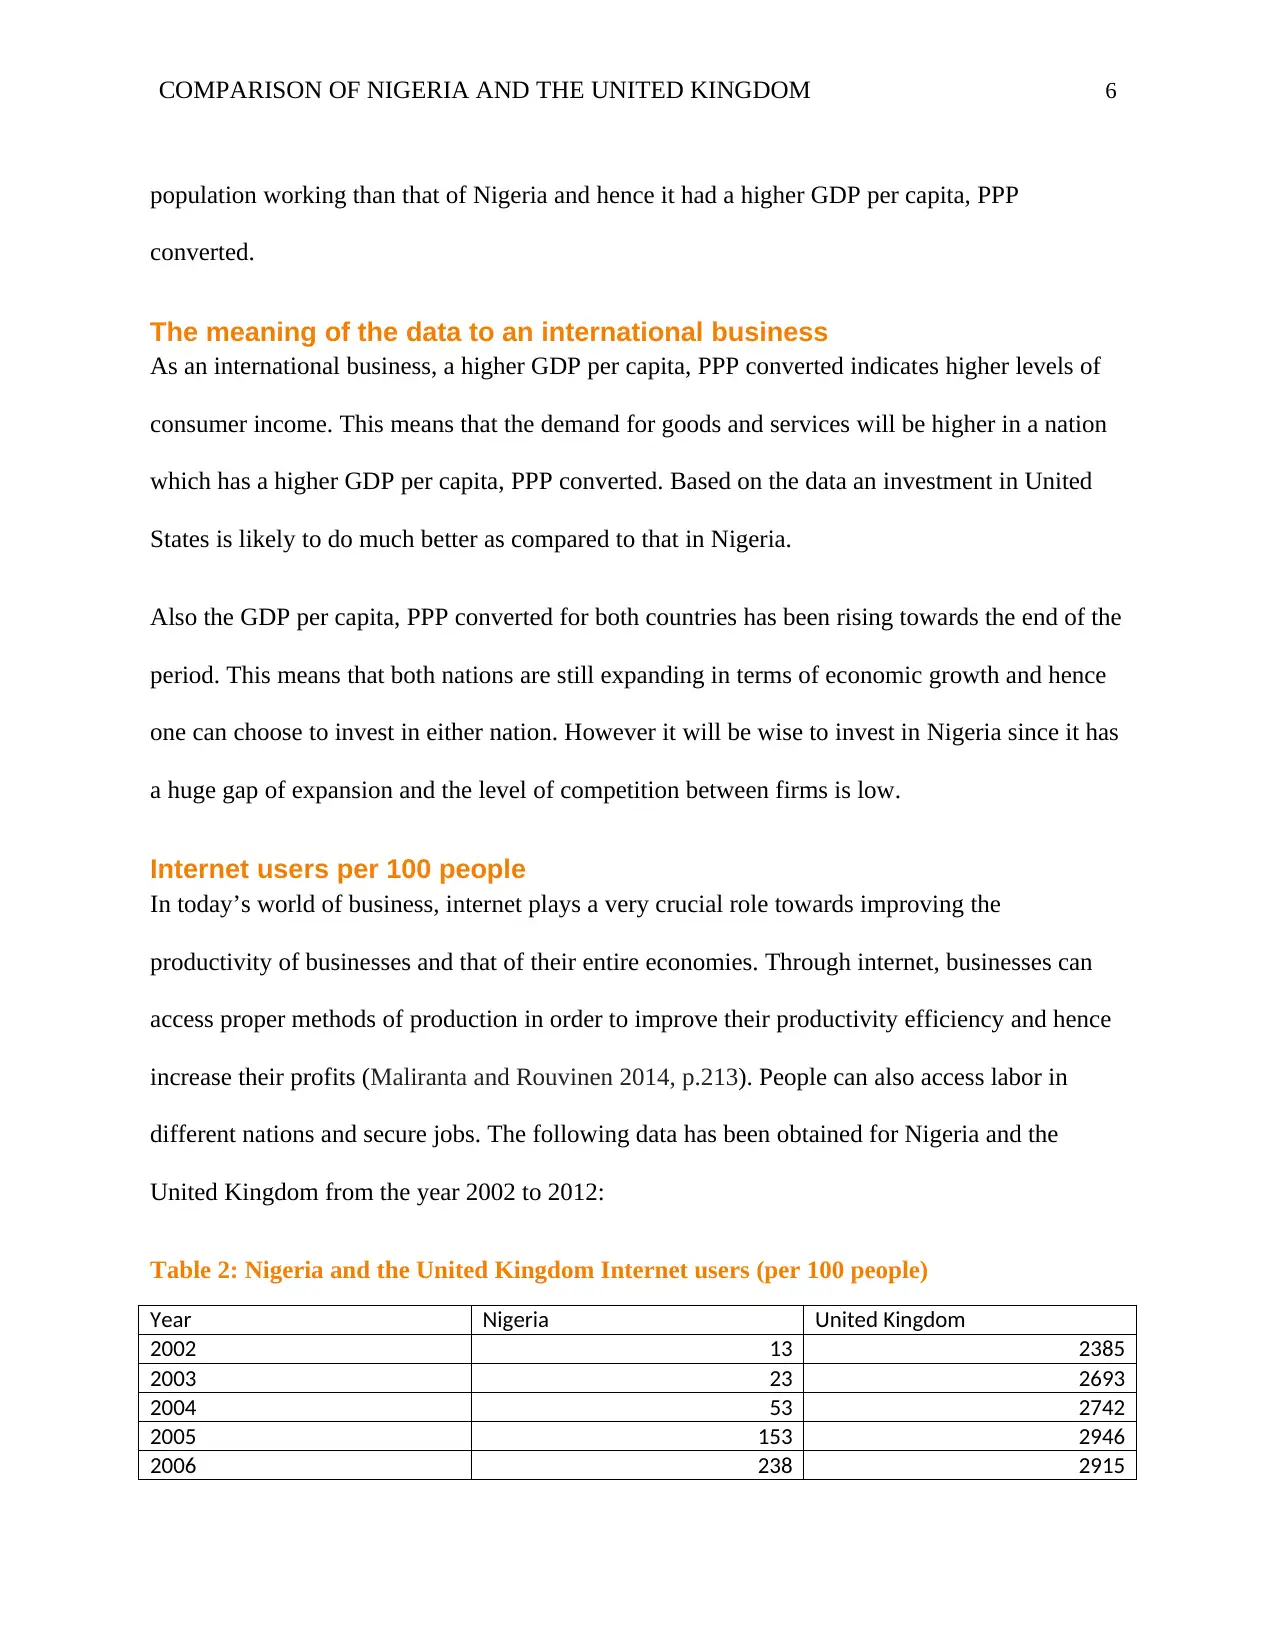
Internet users per 100 people
In today’s world of business, internet plays a very crucial role towards improving the
productivity of businesses and that of their entire economies. Through internet, businesses can
access proper methods of production in order to improve their productivity efficiency and hence
increase their profits (Maliranta and Rouvinen 2014, p.213). People can also access labor in
different nations and secure jobs. The following data has been obtained for Nigeria and the
United Kingdom from the year 2002 to 2012:
Table 2: Nigeria and the United Kingdom Internet users (per 100 people)
Year Nigeria United Kingdom
2002 13 2385
2003 23 2693
2004 53 2742
2005 153 2946
2006 238 2915
population working than that of Nigeria and hence it had a higher GDP per capita, PPP
converted.
The meaning of the data to an international business
As an international business, a higher GDP per capita, PPP converted indicates higher levels of
consumer income. This means that the demand for goods and services will be higher in a nation
which has a higher GDP per capita, PPP converted. Based on the data an investment in United
States is likely to do much better as compared to that in Nigeria.
Also the GDP per capita, PPP converted for both countries has been rising towards the end of the
period. This means that both nations are still expanding in terms of economic growth and hence
one can choose to invest in either nation. However it will be wise to invest in Nigeria since it has
a huge gap of expansion and the level of competition between firms is low.
Internet users per 100 people
In today’s world of business, internet plays a very crucial role towards improving the
productivity of businesses and that of their entire economies. Through internet, businesses can
access proper methods of production in order to improve their productivity efficiency and hence
increase their profits (Maliranta and Rouvinen 2014, p.213). People can also access labor in
different nations and secure jobs. The following data has been obtained for Nigeria and the
United Kingdom from the year 2002 to 2012:
Table 2: Nigeria and the United Kingdom Internet users (per 100 people)
Year Nigeria United Kingdom
2002 13 2385
2003 23 2693
2004 53 2742
2005 153 2946
2006 238 2915
⊘ This is a preview!⊘
Do you want full access?
Subscribe today to unlock all pages.
Trusted by 1+ million students worldwide
1 out of 19


Your All-in-One AI-Powered Toolkit for Academic Success.
+13062052269
info@desklib.com
Available 24*7 on WhatsApp / Email
![[object Object]](/_next/static/media/star-bottom.7253800d.svg)
Unlock your academic potential
Copyright © 2020–2026 A2Z Services. All Rights Reserved. Developed and managed by ZUCOL.