Analysis of Nike's Financial Performance and Accounting Practices
VerifiedAdded on 2023/05/29
|11
|2283
|346
Report
AI Summary
This report provides a comprehensive analysis of Nike's financial performance and accounting practices, focusing on inventory management and long-term debt treatment. Part C analyzes Nike's accounting for inventories and bonds/long-term debt, comparing it with US GAAP and conceptual frameworks. It examines inventory measurement, disclosure, and compliance with standards, as well as long-term debt classification, recognition, and compliance. Part D critically evaluates Nike's financial performance based on the latest financial results, ratio analysis (liquidity, solvency, and profitability), share price movement, and relevant news flow, including its performance in the FIFA World Cup 2018 and its brand value. The report concludes with an investment recommendation based on the analysis of Nike's financial health and market position, suggesting that investment in the stock is a good idea.

RESEARCH PAPER
NIKE –PART C & PART D
STUDENT ID:
[Pick the date]
NIKE –PART C & PART D
STUDENT ID:
[Pick the date]
Paraphrase This Document
Need a fresh take? Get an instant paraphrase of this document with our AI Paraphraser
PART C
Introduction
The objective of this task is to analyse the accounting treatment provided by the company
(Nike) with regards to two critical items namely inventories and bond & long term debts.
This has been analysed with reference to the appropriate treatment that has been suggested as
part of conceptual framework along with the US GAAP.
Inventories: Measurement
Importance to Nike
The given topic has significant relevant to Nike considering that it needs to manage the
inventory in order to ensure that there is no shortage of supply. Lack of inventory can lead to
loss of sales. However, inventory needs to be managed in a manner whereby associated
storage and handling costs are minimised. Additionally, considering that the company keeps
on coming up with new models, hence obsolescence risk exists owing to which inventory
management is imperative.
Disclosure in financial statements
The closing inventory for the company as on May 31, 2018 is $ 5,261 million while the
opening inventory for the company as on May 31, 2017 is $ 5,055 million. The inventory
balance has been reported as part of the current assets of the company since these are
expected to be sold within one year period.
Recommended accounting treatment
Considering that inventory potentially brings in sales in the future, hence it would be
considered as asset in accordance with the asset definition highlighted in conceptual
framework. Additional aspect that is noteworthy that the inventory on books is expected to be
sold within one year, hence it is reported as current asset (MASB, 2018).
The inventory treatment under US GAAP is different from IFRS. As per US GAAP, there are
three acceptable costing methods i.e. FIFO, weighted average and LIFO (Last In First Out)
and the flexibility remains with the company to deploy suitable method. This is in sharp
contrast with IFRS which prohibits the use of LIFO. With regards to measurement of
inventory, the lower of the market value and the cost is taken into consideration. The market
value is essentially the current replacement cost. With regards to inventory write down also
reversal is not permissible under US GAAP but it is permissible under IFRS (IASplus, n.d.).
Inventory treatment by Nike
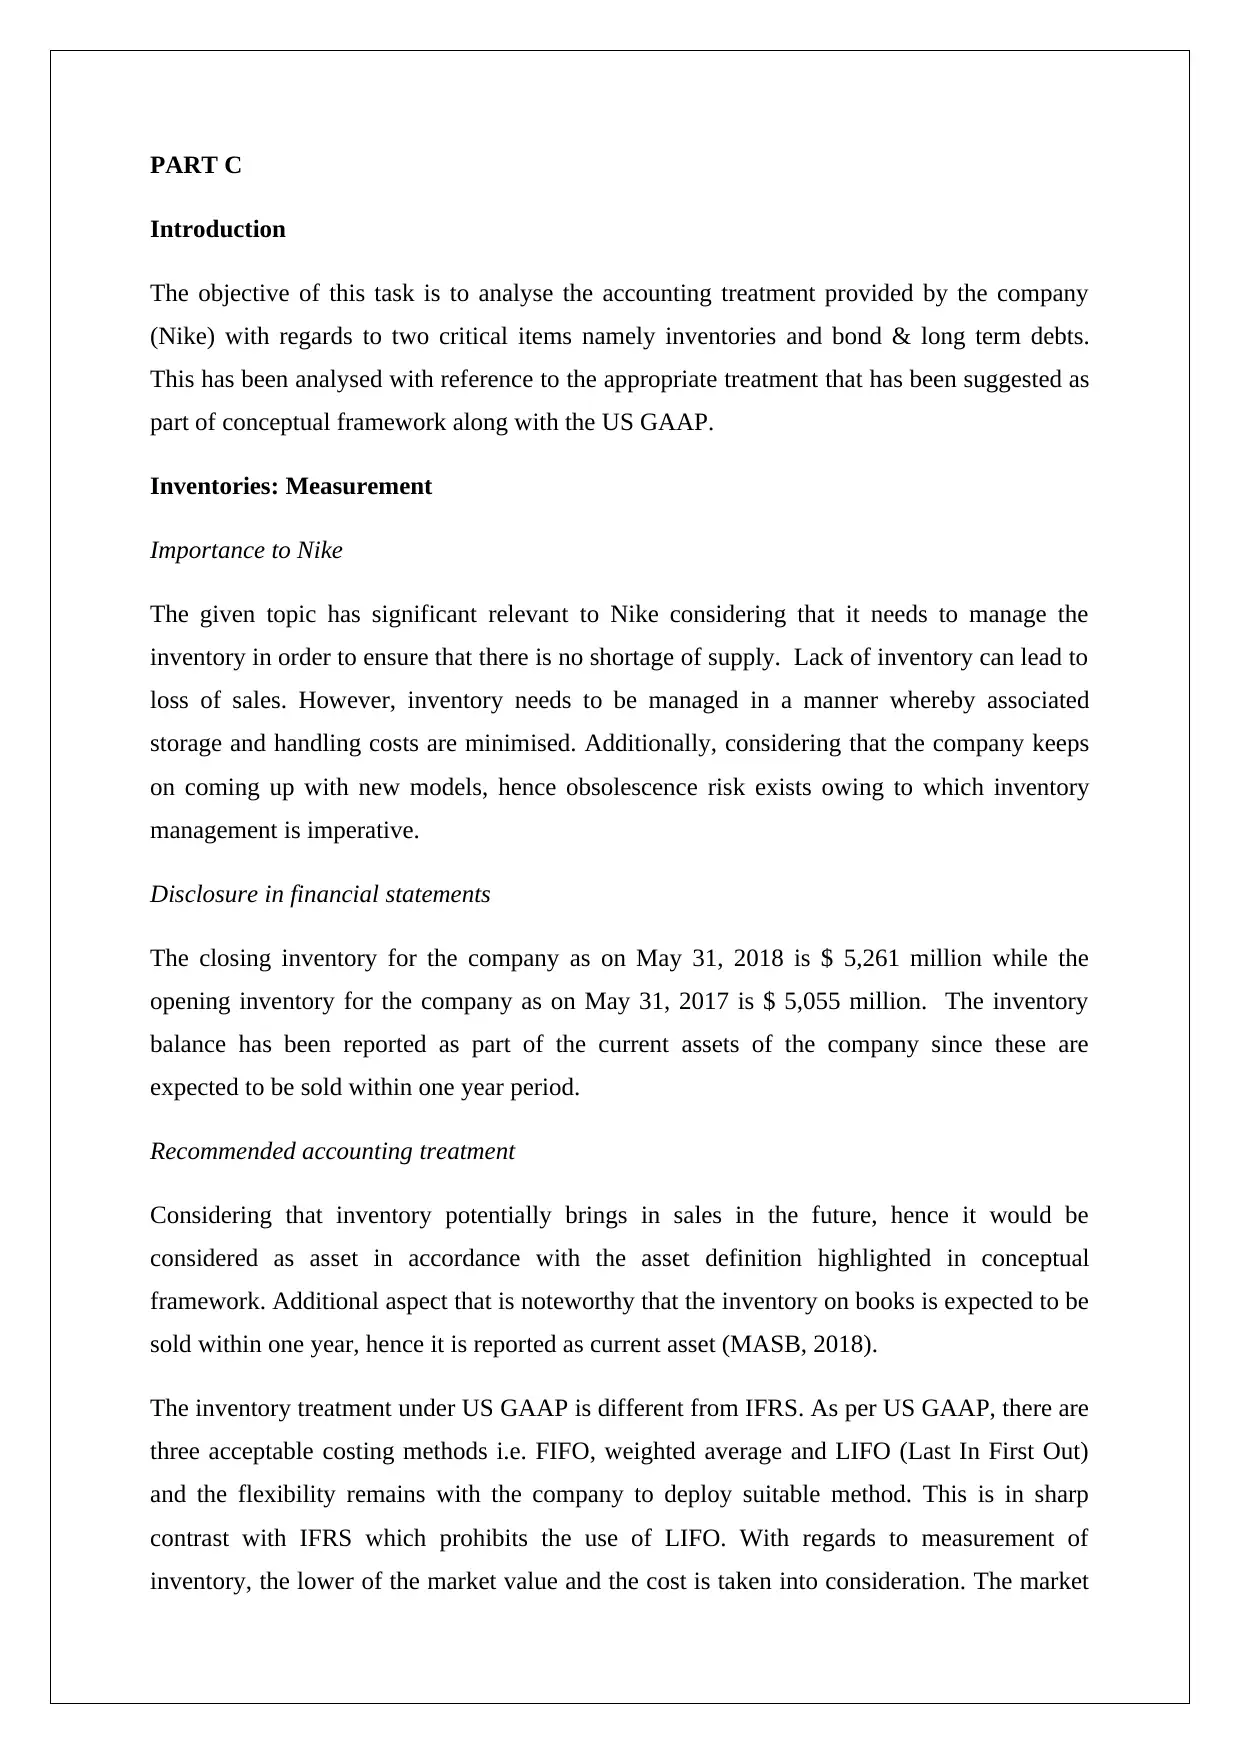
The recognition of the inventory is based on cost. The company has highlighted the inventory
reserves related policy in significant policies as indicated below.
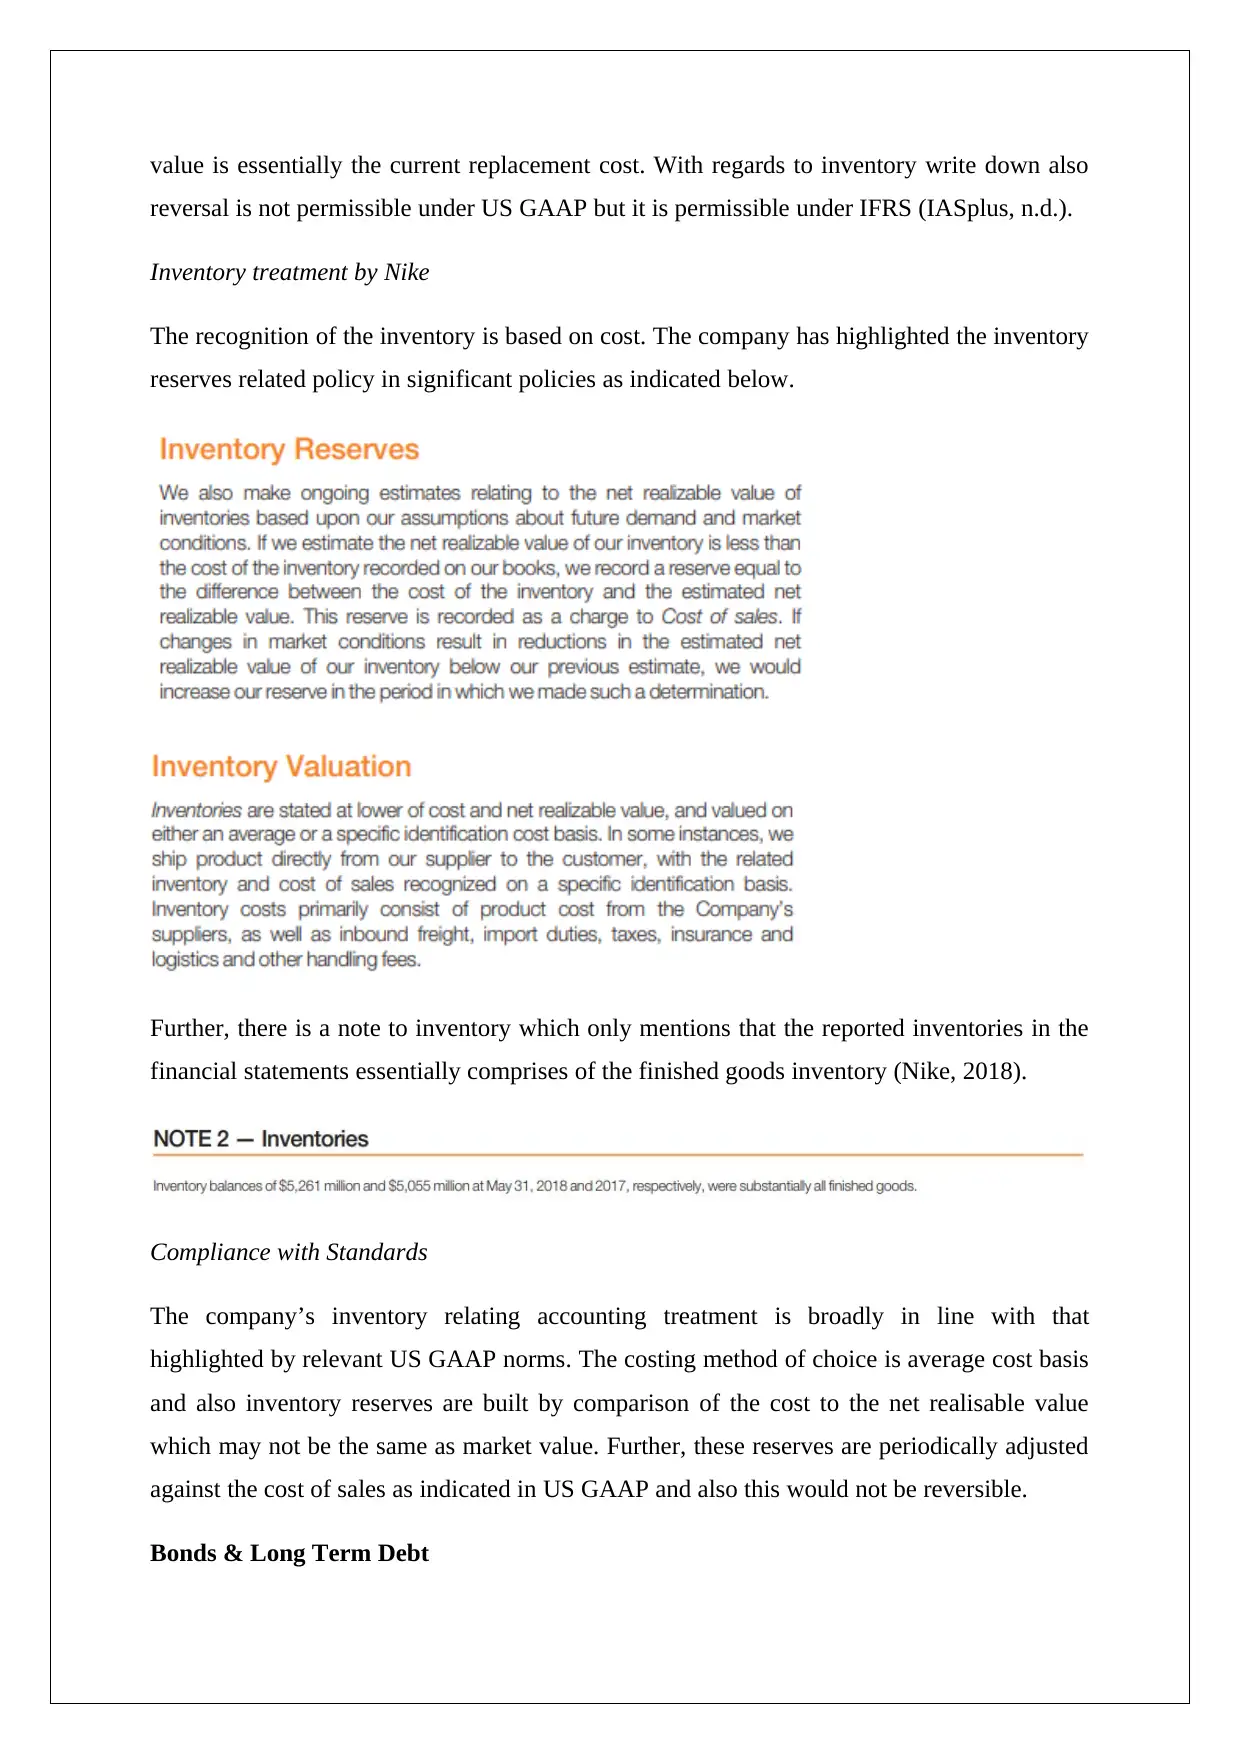
Further, there is a note to inventory which only mentions that the reported inventories in the
financial statements essentially comprises of the finished goods inventory (Nike, 2018).
Compliance with Standards
The company’s inventory relating accounting treatment is broadly in line with that
highlighted by relevant US GAAP norms. The costing method of choice is average cost basis
and also inventory reserves are built by comparison of the cost to the net realisable value
which may not be the same as market value. Further, these reserves are periodically adjusted
against the cost of sales as indicated in US GAAP and also this would not be reversible.
Bonds & Long Term Debt
reversal is not permissible under US GAAP but it is permissible under IFRS (IASplus, n.d.).
Inventory treatment by Nike
The recognition of the inventory is based on cost. The company has highlighted the inventory
reserves related policy in significant policies as indicated below.
Further, there is a note to inventory which only mentions that the reported inventories in the
financial statements essentially comprises of the finished goods inventory (Nike, 2018).
Compliance with Standards
The company’s inventory relating accounting treatment is broadly in line with that
highlighted by relevant US GAAP norms. The costing method of choice is average cost basis
and also inventory reserves are built by comparison of the cost to the net realisable value
which may not be the same as market value. Further, these reserves are periodically adjusted
against the cost of sales as indicated in US GAAP and also this would not be reversible.
Bonds & Long Term Debt
⊘ This is a preview!⊘
Do you want full access?
Subscribe today to unlock all pages.
Trusted by 1+ million students worldwide
Importance to Nike
The above instruments tend to provide required capital for the company which is used for
expansion, branding along with product development. In the absence of long term financing
options, the company would have to rely on short term debt along with equity. This would be
an issue for the company considering that equity dilution is prudent to an extent only and
short term debt is not suitable for funding capital assets.
Disclosure in financial statements
The long term debt for the company as on May 31, 2018 is $ 3,468 million while the long
term debt for the company as on May 31, 2017 was $ 3,471 million. The long term debt has
been reported as part of the non-current liabilities of the company since these are expected to
be paid over long term (i.e. have maturity in excess of one year). It is imperative to note that
all of this long term debt is in the form of long term bonds (Nike, 2018).
Recommended accounting treatment
The long term debt (including bonds) should be treated as liability considering that in the
future there would be cash outflow associated for settling the same. Besides, the liability
arises on account of transactions taken in the past. Besides, considering that these liabilities
are expected to require cash outflow in the long term (i.e. more than one year), hence the
nature of liabilities would be non-current liabilities as per conceptual framework (MASB,
2018)
As per US GAAP, classification of debt liabilities takes place on the basis of repayment and
also if the debt is callable. Typically, callable obligations would be considered as current
despite the actual repayment being greater than one year. In accordance with US GAAP, any
issuance cost associated with long term bonds is capitalised at the time of bond issue and is
expensed during the maturity period of the bond (IASplus, 2018). The repayment of principal
refers to the repayment of borrowings and thus, suitable adjustment would be made in the
item. Further, the bonds are stated based on their adjusted cost considering the principal
repayments made and the market value is not reflected (Navigating Accouting, nd).
Long term debt treatment by Nike
A relevant disclosure regarding the composition of long term debt with regards to the
currency and other relevant details is indicated below.
Paraphrase This Document
Need a fresh take? Get an instant paraphrase of this document with our AI Paraphraser
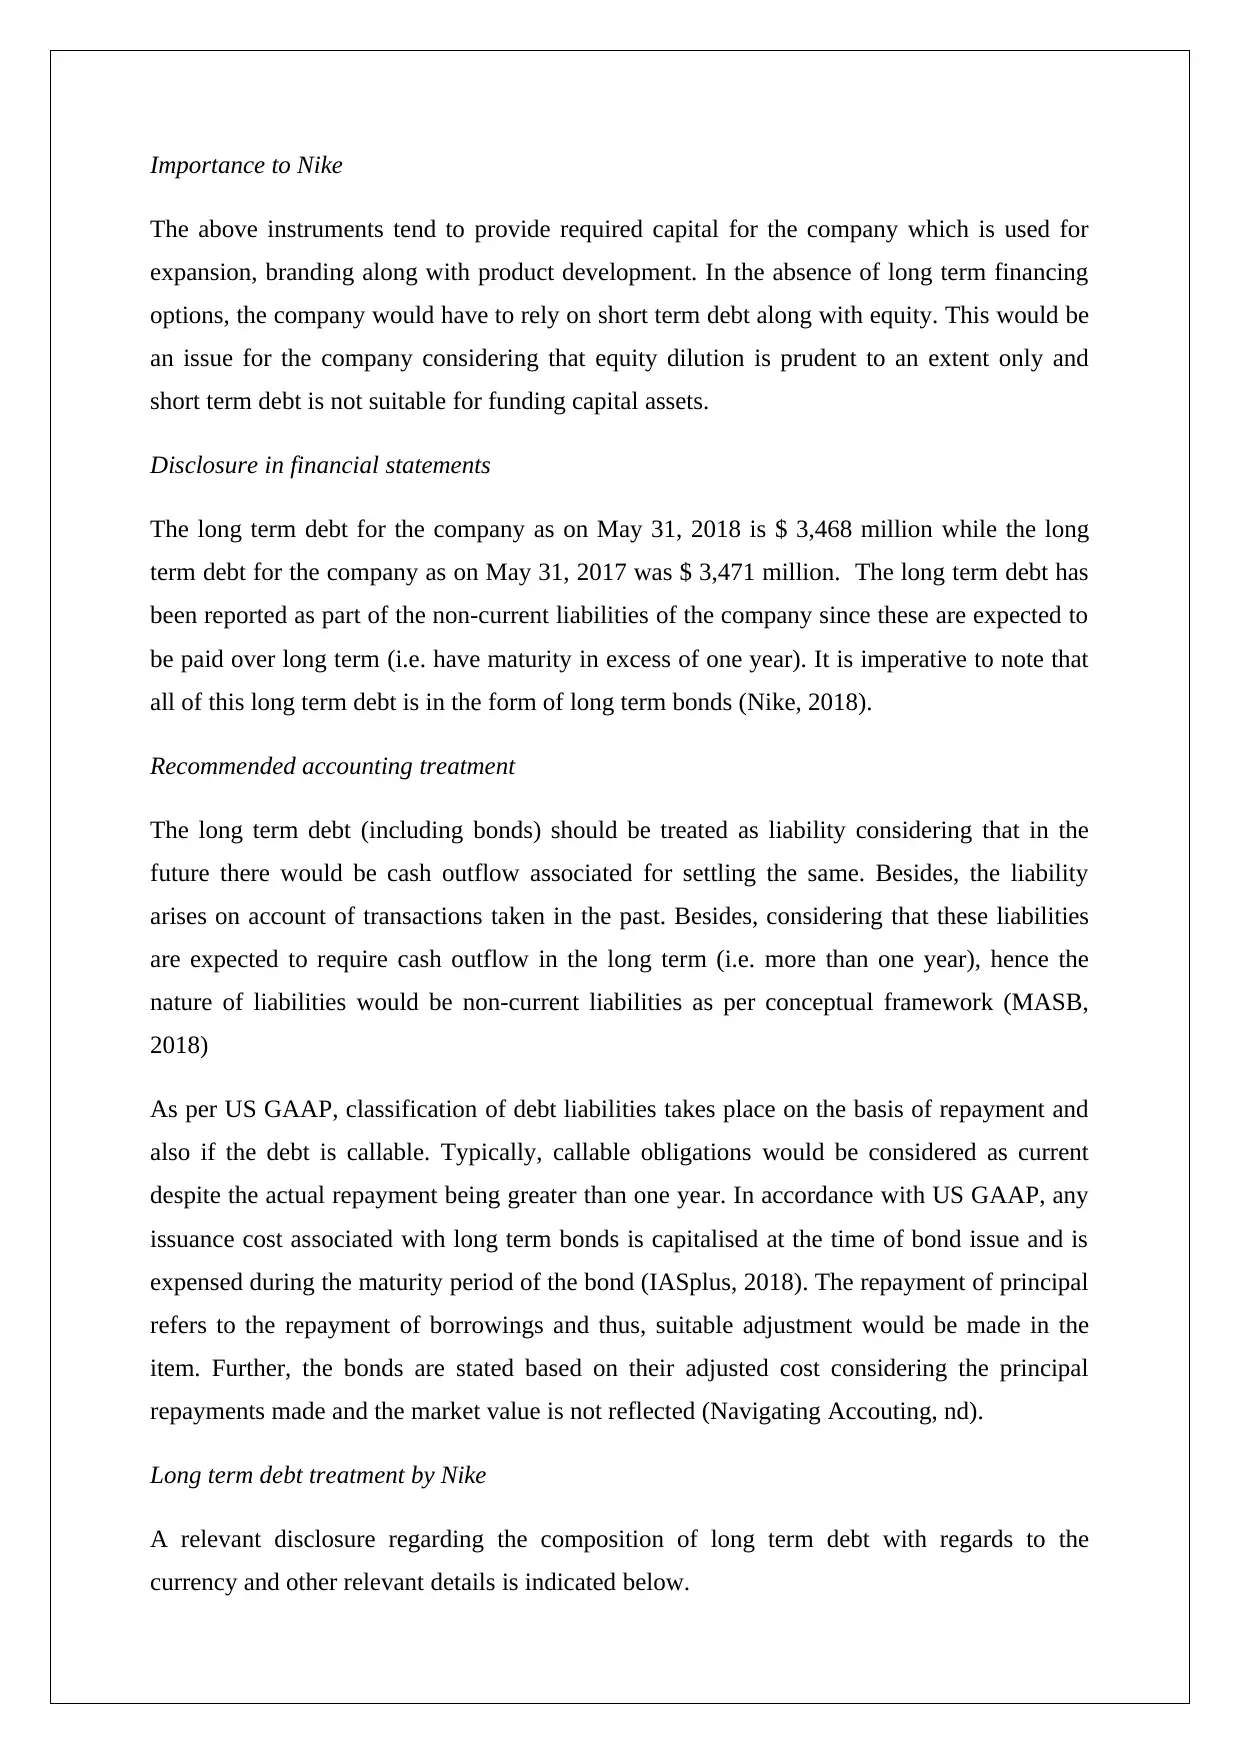
From the above, it is evident that the issuance costs are capitalised and expensed during bond
maturity. Besides, since the bonds are not callable, hence these have been classified as non-
current liabilities. Also, the amount reported as long term debt is after adjustment for any
repayment made for the outstanding bonds (Nike, 2018).
Compliance with Standards
The company is in compliance with the relevant accounting standards applicable for long
term debt. The initial recognition is at cost and comprises the issuance costs that are
capitalised. Further, the long term debt is classified correctly as non-current liability and also
makes suitable adjustments to report the correct carrying value based on the outstanding
payments still to be made.
PART D
Introduction
The objective of this report is to critically analyse the financial performance of Nike with
reference to the current news flow so as to highlight if it is suitable choice for investment or
not. In order to facilitate the same, a general overview of the latest financial results would be
presented so as to highlight how the company is performing. Additionally, ratio analysis
would be also performed besides analysing the share price movement in the recent past.
Finally, relevant news flow would also be considered so as to offer prudent investment
advice.
Financial Results Analysis
The latest financial statements available for the company correspond to year ending on May
31, 2018. It is apparent that for FY2018, the company has witnessed about 6% topline
growth. Driven by higher revenues, the gross profit of the company has also increased in
FY2018. However, the net income of the company in FY2018 has taken a serious plunge in
excess of 50% owing to reduced gross margins coupled with higher income tax expense.
However, the dividend declared for the ordinary shareholders by the company has seen an
increase in excess of 10%. A positive aspect of the company’s financial performance is that
the cash flows generated from operations has jumped by about 30% in FY2018 over FY2017.
Also, the company is aggressively repurchasing stock which augers well for the shareholders.
The quantum of this purchase was $ 4.25 billion in FY2018 and $ 3.22 billion in FY2017
(Nike, 2018).
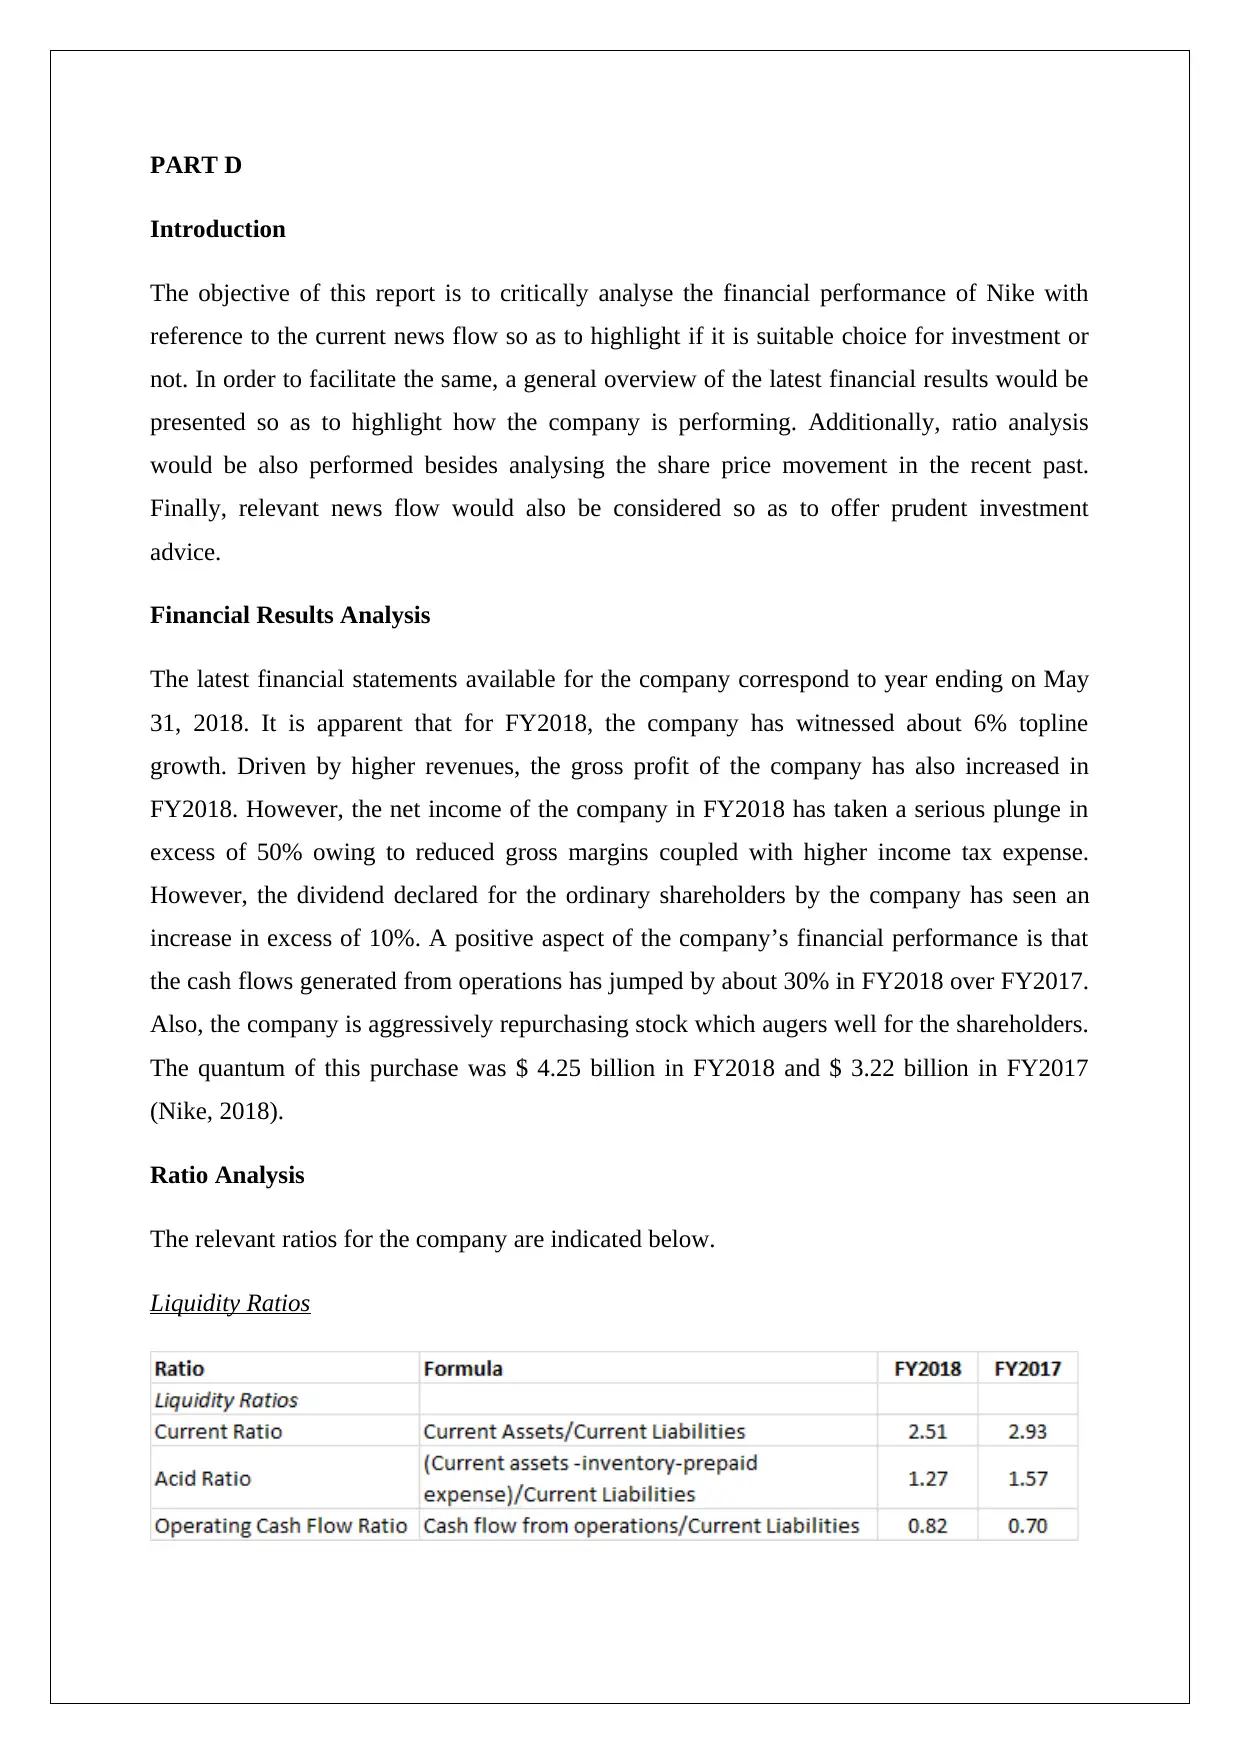
Ratio Analysis
The relevant ratios for the company are indicated below.
Liquidity Ratios
Introduction
The objective of this report is to critically analyse the financial performance of Nike with
reference to the current news flow so as to highlight if it is suitable choice for investment or
not. In order to facilitate the same, a general overview of the latest financial results would be
presented so as to highlight how the company is performing. Additionally, ratio analysis
would be also performed besides analysing the share price movement in the recent past.
Finally, relevant news flow would also be considered so as to offer prudent investment
advice.
Financial Results Analysis
The latest financial statements available for the company correspond to year ending on May
31, 2018. It is apparent that for FY2018, the company has witnessed about 6% topline
growth. Driven by higher revenues, the gross profit of the company has also increased in
FY2018. However, the net income of the company in FY2018 has taken a serious plunge in
excess of 50% owing to reduced gross margins coupled with higher income tax expense.
However, the dividend declared for the ordinary shareholders by the company has seen an
increase in excess of 10%. A positive aspect of the company’s financial performance is that
the cash flows generated from operations has jumped by about 30% in FY2018 over FY2017.
Also, the company is aggressively repurchasing stock which augers well for the shareholders.
The quantum of this purchase was $ 4.25 billion in FY2018 and $ 3.22 billion in FY2017
(Nike, 2018).
Ratio Analysis
The relevant ratios for the company are indicated below.
Liquidity Ratios
⊘ This is a preview!⊘
Do you want full access?
Subscribe today to unlock all pages.
Trusted by 1+ million students worldwide
It is apparent from the above ratios analysis that liquidity ratios barring operating cash flow
ratio have witnessed a decline in FY2018 in comparison to FY2017. The operating cash flow
ratio has improved on account of robust increase in the cash flow generated from operations
in FY2018 in comparison to FY2017 (Nike, 2018). Even though, there is some decline in the
current ratios and acid ratios, but still the short term liquidity of the company remains quite
robust and no short term cash crunch seems imminent from the above analysis.
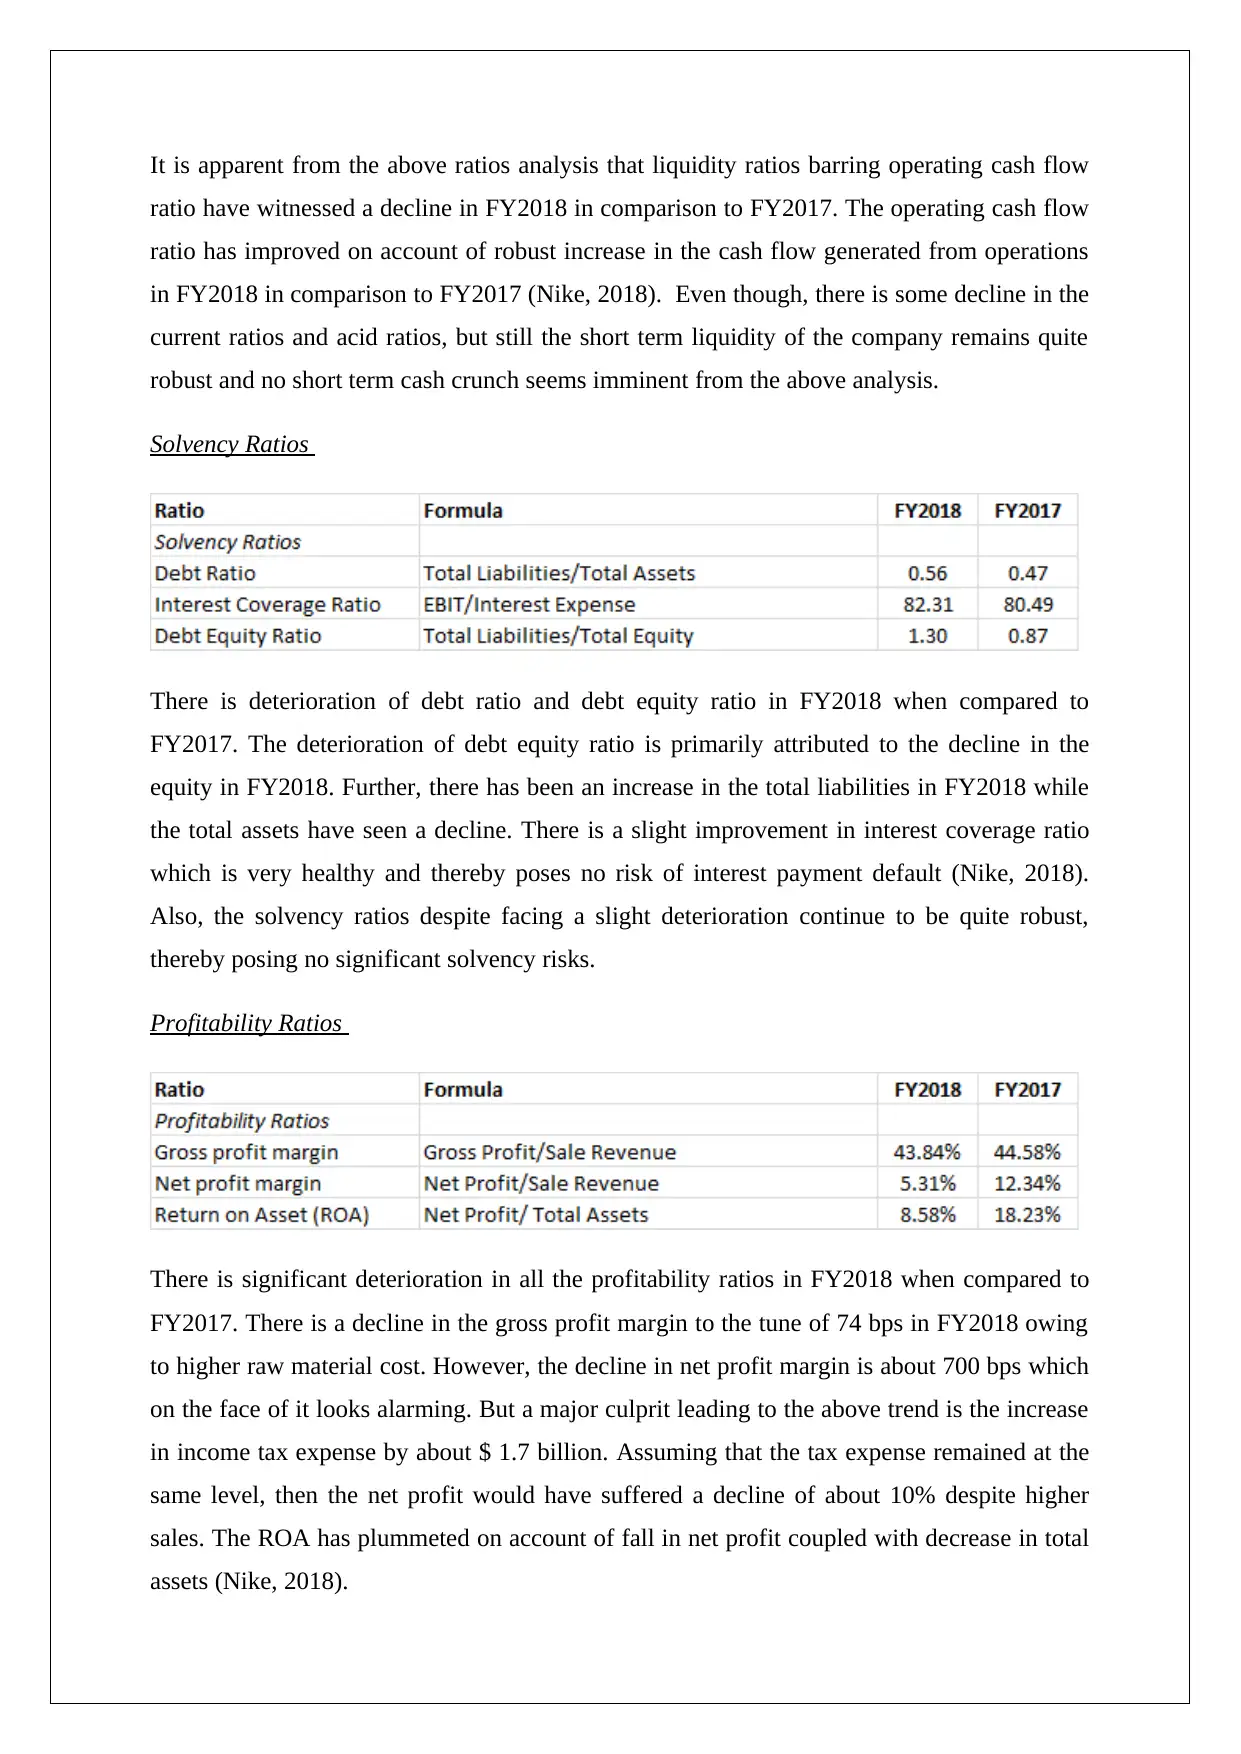
Solvency Ratios
There is deterioration of debt ratio and debt equity ratio in FY2018 when compared to
FY2017. The deterioration of debt equity ratio is primarily attributed to the decline in the
equity in FY2018. Further, there has been an increase in the total liabilities in FY2018 while
the total assets have seen a decline. There is a slight improvement in interest coverage ratio
which is very healthy and thereby poses no risk of interest payment default (Nike, 2018).
Also, the solvency ratios despite facing a slight deterioration continue to be quite robust,
thereby posing no significant solvency risks.
Profitability Ratios
There is significant deterioration in all the profitability ratios in FY2018 when compared to
FY2017. There is a decline in the gross profit margin to the tune of 74 bps in FY2018 owing
to higher raw material cost. However, the decline in net profit margin is about 700 bps which
on the face of it looks alarming. But a major culprit leading to the above trend is the increase
in income tax expense by about $ 1.7 billion. Assuming that the tax expense remained at the
same level, then the net profit would have suffered a decline of about 10% despite higher
sales. The ROA has plummeted on account of fall in net profit coupled with decrease in total
assets (Nike, 2018).
ratio have witnessed a decline in FY2018 in comparison to FY2017. The operating cash flow
ratio has improved on account of robust increase in the cash flow generated from operations
in FY2018 in comparison to FY2017 (Nike, 2018). Even though, there is some decline in the
current ratios and acid ratios, but still the short term liquidity of the company remains quite
robust and no short term cash crunch seems imminent from the above analysis.
Solvency Ratios
There is deterioration of debt ratio and debt equity ratio in FY2018 when compared to
FY2017. The deterioration of debt equity ratio is primarily attributed to the decline in the
equity in FY2018. Further, there has been an increase in the total liabilities in FY2018 while
the total assets have seen a decline. There is a slight improvement in interest coverage ratio
which is very healthy and thereby poses no risk of interest payment default (Nike, 2018).
Also, the solvency ratios despite facing a slight deterioration continue to be quite robust,
thereby posing no significant solvency risks.
Profitability Ratios
There is significant deterioration in all the profitability ratios in FY2018 when compared to
FY2017. There is a decline in the gross profit margin to the tune of 74 bps in FY2018 owing
to higher raw material cost. However, the decline in net profit margin is about 700 bps which
on the face of it looks alarming. But a major culprit leading to the above trend is the increase
in income tax expense by about $ 1.7 billion. Assuming that the tax expense remained at the
same level, then the net profit would have suffered a decline of about 10% despite higher
sales. The ROA has plummeted on account of fall in net profit coupled with decrease in total
assets (Nike, 2018).
Paraphrase This Document
Need a fresh take? Get an instant paraphrase of this document with our AI Paraphraser
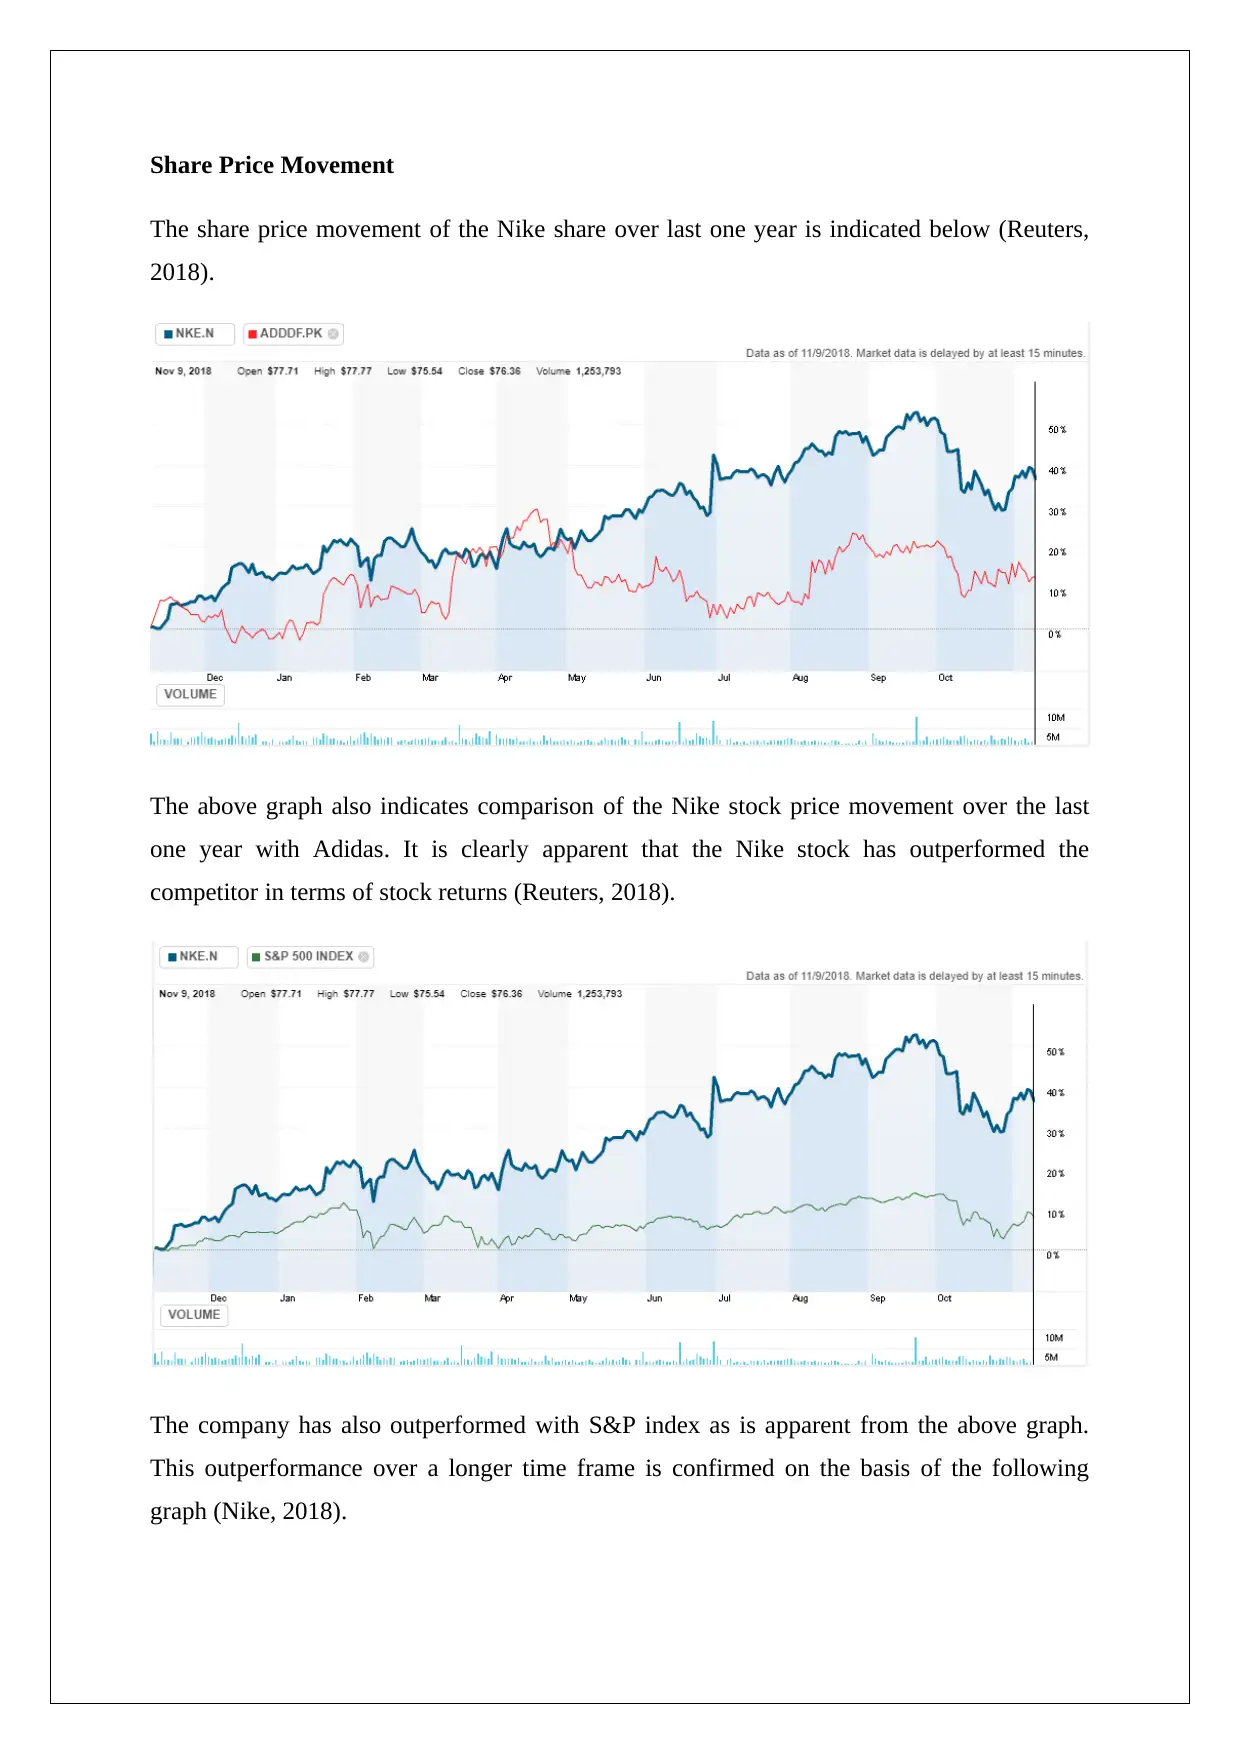
Share Price Movement
The share price movement of the Nike share over last one year is indicated below (Reuters,
2018).
The above graph also indicates comparison of the Nike stock price movement over the last
one year with Adidas. It is clearly apparent that the Nike stock has outperformed the
competitor in terms of stock returns (Reuters, 2018).
The company has also outperformed with S&P index as is apparent from the above graph.
This outperformance over a longer time frame is confirmed on the basis of the following
graph (Nike, 2018).
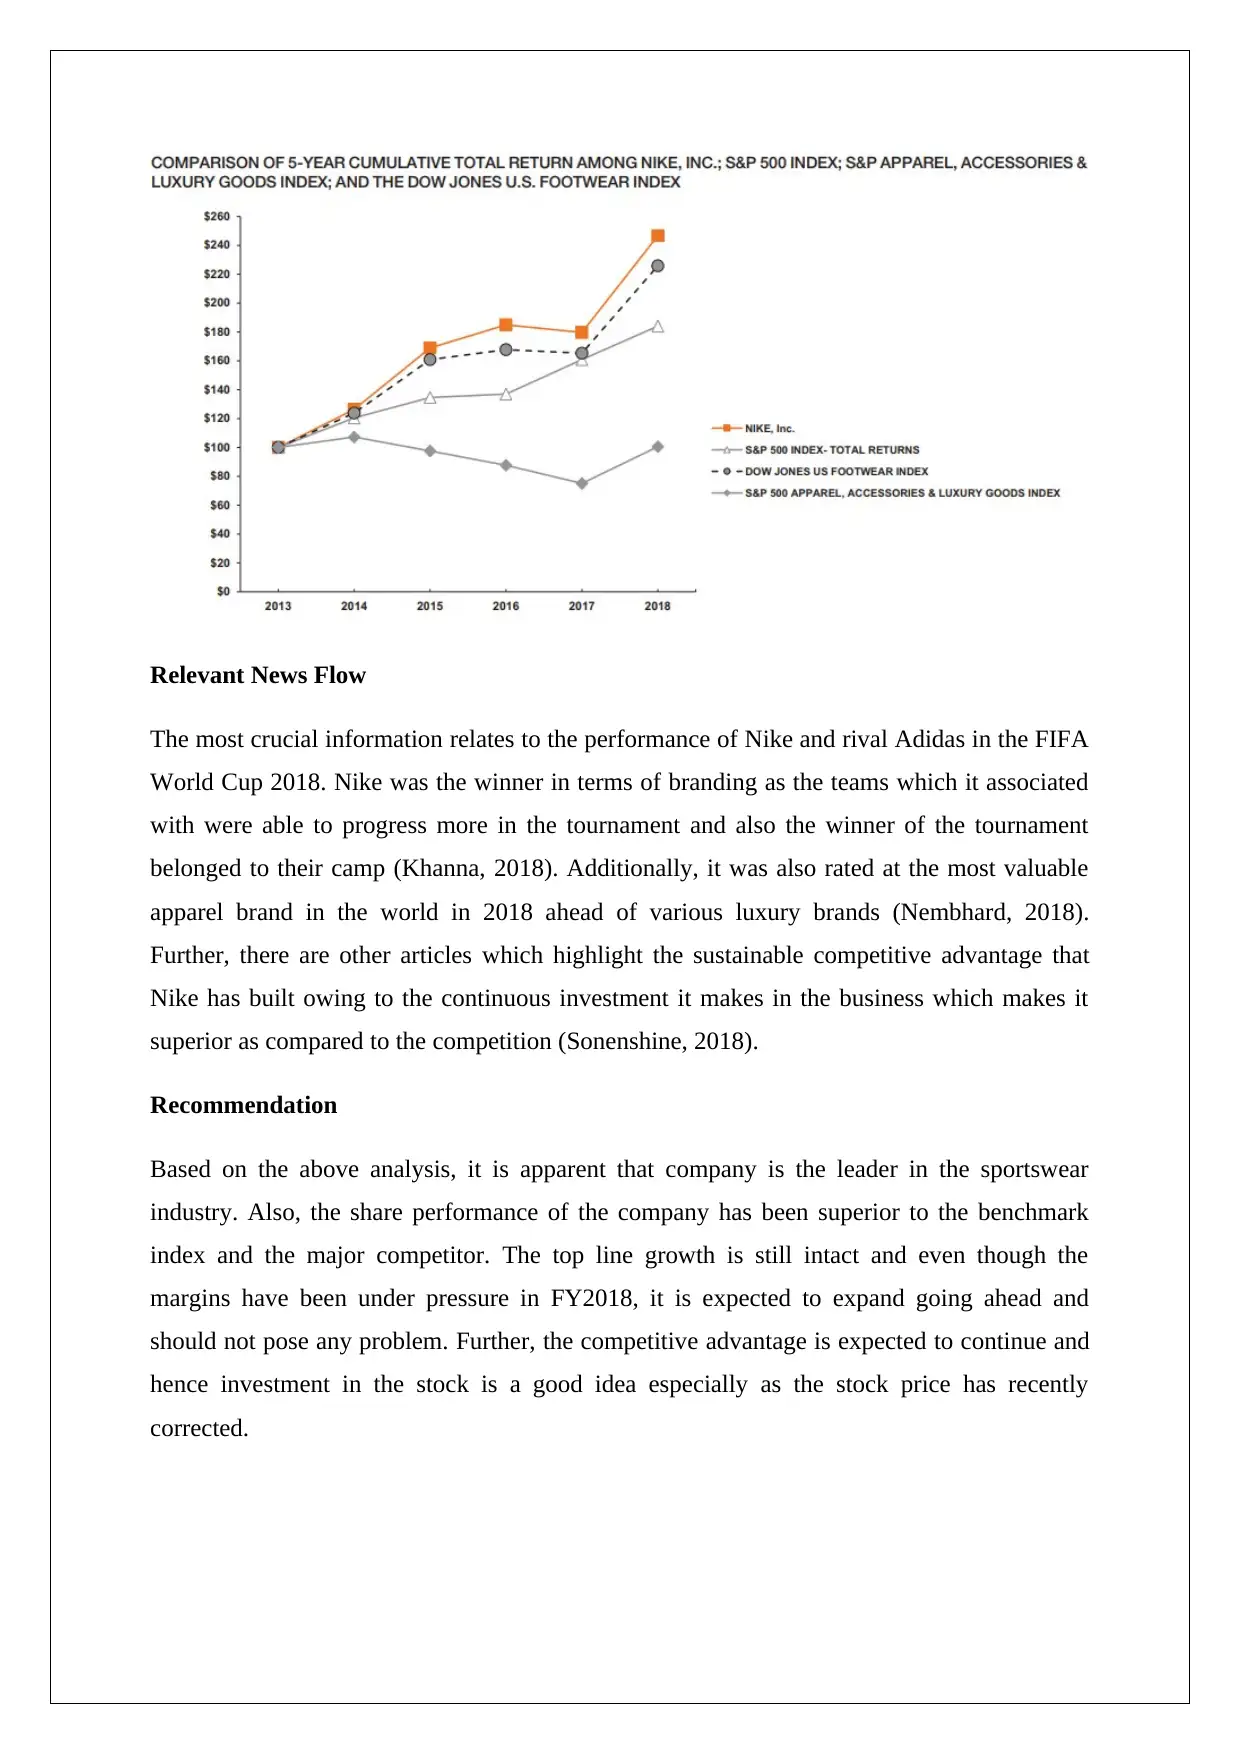
Relevant News Flow
The most crucial information relates to the performance of Nike and rival Adidas in the FIFA
World Cup 2018. Nike was the winner in terms of branding as the teams which it associated
with were able to progress more in the tournament and also the winner of the tournament
belonged to their camp (Khanna, 2018). Additionally, it was also rated at the most valuable
apparel brand in the world in 2018 ahead of various luxury brands (Nembhard, 2018).
Further, there are other articles which highlight the sustainable competitive advantage that
Nike has built owing to the continuous investment it makes in the business which makes it
superior as compared to the competition (Sonenshine, 2018).
Recommendation
Based on the above analysis, it is apparent that company is the leader in the sportswear
industry. Also, the share performance of the company has been superior to the benchmark
index and the major competitor. The top line growth is still intact and even though the
margins have been under pressure in FY2018, it is expected to expand going ahead and
should not pose any problem. Further, the competitive advantage is expected to continue and
hence investment in the stock is a good idea especially as the stock price has recently
corrected.
⊘ This is a preview!⊘
Do you want full access?
Subscribe today to unlock all pages.
Trusted by 1+ million students worldwide
References
IASplus (2018) Conceptual Framework for Financial Reporting 2018, Retrieved from
https://www.iasplus.com/en/standards/other/framework
IASplus (n.d.) Inventories: Key differences between U.S. GAAP and IFRSs, Retrieved from
https://www.iasplus.com/en-us/standards/ifrs-usgaap/inventories
Khanna, A. (2018) Nike beats Adidas to win FIFA World Cup 2018, Retrieved from
https://www.insidesport.co/nike-beats-adidas-to-win-fifa-world-cup-2018/
MASB (2011) The Conceptual Framework for Financial Reporting, Retrieved from
http://www.masb.org.my/pdf.php?pdf=conceptual%20framework
%20042015t.pdf&file_path=pdf
Navigating accounting (nd) Accounting for Long-term Assets, Long-term Debt and Leases,
Retrieved from
http://www.navigatingaccounting.com/sites/default/files/Posted/Chapters/Ch_10_db/
3%20Wbn/6_txt/Documents/Acrobat/Long-term_assets_long-term_debt_leases.pdf
Nembhard, C. (2018) Nike remains the most valuable apparel brand in 2018, Retrieved from
https://www.highsnobiety.com/p/nike-most-valuable-apparel-brand-2018/
Nike (2018) 2018 Form 10-K, Retrieved from
https://s1.q4cdn.com/806093406/files/doc_financials/2018/ar/docs/nike-2018-form-
10K.pdf
Reuters (2018) Nike Inc (NKE.N), Retrieved from
https://www.reuters.com/finance/stocks/chart/NKE.N
Sonenshine, J. (2018) Nike's competitive advantage is a lot like Amazon's, Retrieved from
https://www.businessinsider.in/Nikes-competitive-advantage-is-a-lot-like-Amazons/
articleshow/64798603.cms
Paraphrase This Document
Need a fresh take? Get an instant paraphrase of this document with our AI Paraphraser

1 out of 11
Related Documents


Your All-in-One AI-Powered Toolkit for Academic Success.
+13062052269
info@desklib.com
Available 24*7 on WhatsApp / Email
![[object Object]](/_next/static/media/star-bottom.7253800d.svg)
Unlock your academic potential
Copyright © 2020–2026 A2Z Services. All Rights Reserved. Developed and managed by ZUCOL.