Comparative Financial Ratio Analysis of Nike and Adidas Companies
VerifiedAdded on 2022/11/22
|13
|2617
|191
Report
AI Summary
This report presents a comparative financial analysis of Nike and Adidas, two leading companies in the sportswear industry, examining their financial performance from 2016 to 2018. The analysis focuses on solvency ratios (current ratio, quick ratio, working capital, and net liquid balance), liquidity ratios (operating cash flow ratio, cash conversion efficiency, cash conversion period, and liquidity index), and financial flexibility ratios (sustainable growth rate). The report includes detailed calculations, tables, and trend analyses to assess each company's financial health, efficiency, and growth potential. The findings indicate that while Nike maintains a strong solvency position, Adidas has shown improvements in liquidity and financial flexibility during the analyzed period. The report highlights key insights into each company's ability to manage its operations, meet its obligations, and sustain growth, providing valuable information for investors and stakeholders. The data and ratios are calculated and presented based on the provided financial statements of the companies. The report concludes by summarizing the key findings, comparing the performance of both companies across different financial metrics.
Running head: FINANCIAL ANALYSIS
Financial Analysis
Name of the Student:
Name of the University:
Author’s Note:
Financial Analysis
Name of the Student:
Name of the University:
Author’s Note:
Paraphrase This Document
Need a fresh take? Get an instant paraphrase of this document with our AI Paraphraser
1
Table of Contents
Introduction......................................................................................................................................2
Discussion........................................................................................................................................2
Solvency Ratio.............................................................................................................................2
Liquidity Ratio.............................................................................................................................5
Financial Flexibility Ratio...........................................................................................................8
Conclusion.......................................................................................................................................9
References......................................................................................................................................10
2
Introduction
Financial Analysis helps an investors and stakeholders understand and analyze the
various aspects in terms of performance and activities undertaken for increasing the business
operations. The financial analysis of the Nike and Adidas Company was undertaken for a period
of three year time frame where the relevant changes in the financial performance and position of
the companies were taken into consideration. The analysis for the companies have been done on
the basis of solvency ratio, liquidity ratio and financial flexibility ratio of the company. The trend
period taken into consideration is from the time period of 2016-2018. Adidas is a multinational
corporation based in Germany that is operating in the clothes and accessories services. The
company is the largest sportswear manufacturer in world after Nike1. On the other hand, Nike
Inc. is an American Multinational Corporation that is currently into designing, manufacturing,
developing and marketing of various footwear, apparel, equipment, accessories and services2.
Discussion
Solvency Ratio
In terms of solvency the Nike Company is having an adequate coverage of current assets
with respect to the current liabilities of the company but if the same is seen from the trend
analysis comparison the same has been falling consistently for the company in the trend period
for the company3. On the other hand, for the Adidas Company the liquidity ratio has increased
1 "Adidas Financial Statement Analysis." Rstudio-pubs-static.s3.amazonaws.com. N. p., 2019. Web. 14 Sept. 2019.
2 "NIKE, Inc. 2018 Annual Report." Materials.proxyvote.com. N. p., 2019. Web. 14 Sept. 2019
3 "Nike Inc. (NKE) | Financial Analysis And Stock Valuation." Stock Analysis on Net. N. p., 2019. Web. 14 Sept.
2019.
⊘ This is a preview!⊘
Do you want full access?
Subscribe today to unlock all pages.
Trusted by 1+ million students worldwide
3
consistently for the company in the trend period indicating that the company may be taking
several of the initiatives in covering up the current liabilities of the company.
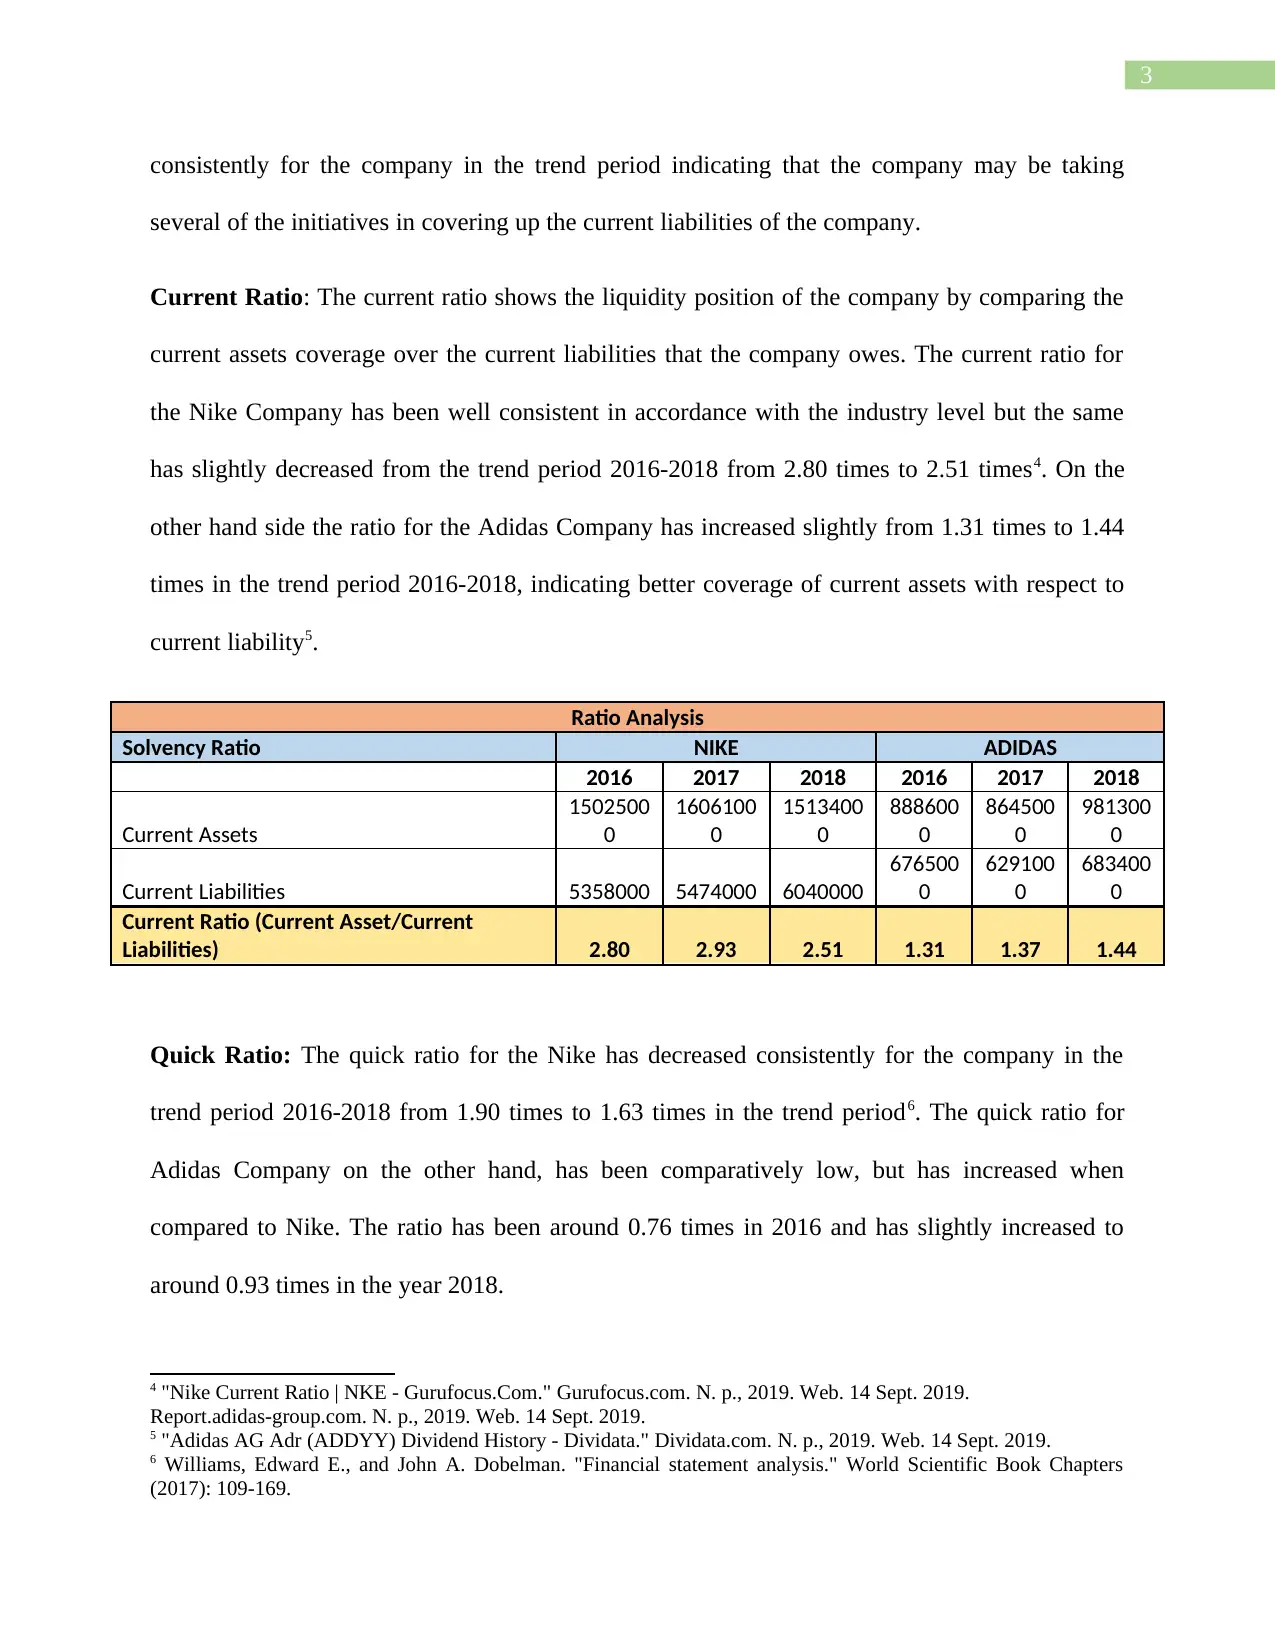
Current Ratio: The current ratio shows the liquidity position of the company by comparing the
current assets coverage over the current liabilities that the company owes. The current ratio for
the Nike Company has been well consistent in accordance with the industry level but the same
has slightly decreased from the trend period 2016-2018 from 2.80 times to 2.51 times4. On the
other hand side the ratio for the Adidas Company has increased slightly from 1.31 times to 1.44
times in the trend period 2016-2018, indicating better coverage of current assets with respect to
current liability5.
Ratio Analysis
Solvency Ratio NIKE ADIDAS
2016 2017 2018 2016 2017 2018
Current Assets
1502500
0
1606100
0
1513400
0
888600
0
864500
0
981300
0
Current Liabilities 5358000 5474000 6040000
676500
0
629100
0
683400
0
Current Ratio (Current Asset/Current
Liabilities) 2.80 2.93 2.51 1.31 1.37 1.44
Quick Ratio: The quick ratio for the Nike has decreased consistently for the company in the
trend period 2016-2018 from 1.90 times to 1.63 times in the trend period6. The quick ratio for
Adidas Company on the other hand, has been comparatively low, but has increased when
compared to Nike. The ratio has been around 0.76 times in 2016 and has slightly increased to
around 0.93 times in the year 2018.
4 "Nike Current Ratio | NKE - Gurufocus.Com." Gurufocus.com. N. p., 2019. Web. 14 Sept. 2019.
Report.adidas-group.com. N. p., 2019. Web. 14 Sept. 2019.
5 "Adidas AG Adr (ADDYY) Dividend History - Dividata." Dividata.com. N. p., 2019. Web. 14 Sept. 2019.
6 Williams, Edward E., and John A. Dobelman. "Financial statement analysis." World Scientific Book Chapters
(2017): 109-169.
consistently for the company in the trend period indicating that the company may be taking
several of the initiatives in covering up the current liabilities of the company.
Current Ratio: The current ratio shows the liquidity position of the company by comparing the
current assets coverage over the current liabilities that the company owes. The current ratio for
the Nike Company has been well consistent in accordance with the industry level but the same
has slightly decreased from the trend period 2016-2018 from 2.80 times to 2.51 times4. On the
other hand side the ratio for the Adidas Company has increased slightly from 1.31 times to 1.44
times in the trend period 2016-2018, indicating better coverage of current assets with respect to
current liability5.
Ratio Analysis
Solvency Ratio NIKE ADIDAS
2016 2017 2018 2016 2017 2018
Current Assets
1502500
0
1606100
0
1513400
0
888600
0
864500
0
981300
0
Current Liabilities 5358000 5474000 6040000
676500
0
629100
0
683400
0
Current Ratio (Current Asset/Current
Liabilities) 2.80 2.93 2.51 1.31 1.37 1.44
Quick Ratio: The quick ratio for the Nike has decreased consistently for the company in the
trend period 2016-2018 from 1.90 times to 1.63 times in the trend period6. The quick ratio for
Adidas Company on the other hand, has been comparatively low, but has increased when
compared to Nike. The ratio has been around 0.76 times in 2016 and has slightly increased to
around 0.93 times in the year 2018.
4 "Nike Current Ratio | NKE - Gurufocus.Com." Gurufocus.com. N. p., 2019. Web. 14 Sept. 2019.
Report.adidas-group.com. N. p., 2019. Web. 14 Sept. 2019.
5 "Adidas AG Adr (ADDYY) Dividend History - Dividata." Dividata.com. N. p., 2019. Web. 14 Sept. 2019.
6 Williams, Edward E., and John A. Dobelman. "Financial statement analysis." World Scientific Book Chapters
(2017): 109-169.
Paraphrase This Document
Need a fresh take? Get an instant paraphrase of this document with our AI Paraphraser
4
Solvency Ratio NIKE ADIDAS
2016 2017 2018 2016 2017 2018
Current Asset-Inventory 10187000 11006000 9873000 5123000 4953000 6368000
Current Liabilities 5358000 5474000 6040000 6765000 6291000 6834000
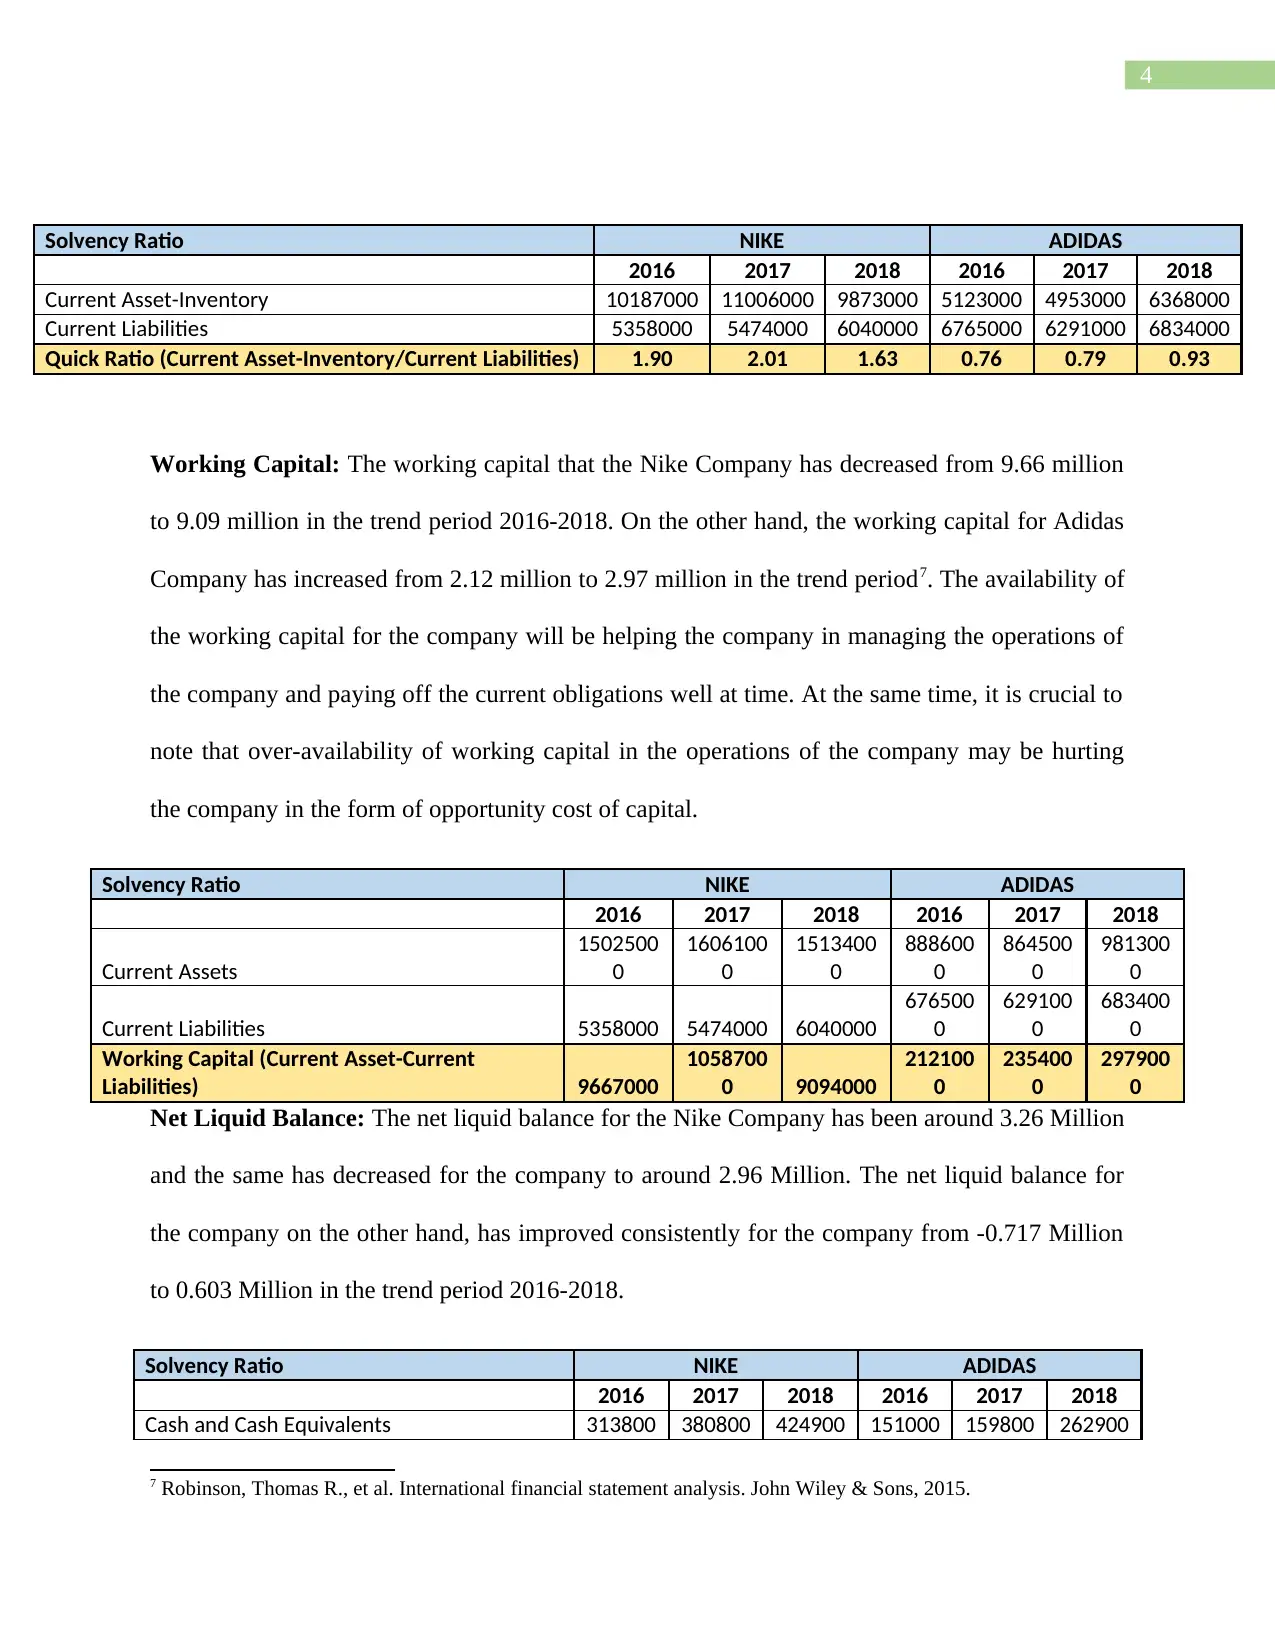
Quick Ratio (Current Asset-Inventory/Current Liabilities) 1.90 2.01 1.63 0.76 0.79 0.93
Working Capital: The working capital that the Nike Company has decreased from 9.66 million
to 9.09 million in the trend period 2016-2018. On the other hand, the working capital for Adidas
Company has increased from 2.12 million to 2.97 million in the trend period7. The availability of
the working capital for the company will be helping the company in managing the operations of
the company and paying off the current obligations well at time. At the same time, it is crucial to
note that over-availability of working capital in the operations of the company may be hurting
the company in the form of opportunity cost of capital.
Solvency Ratio NIKE ADIDAS
2016 2017 2018 2016 2017 2018
Current Assets
1502500
0
1606100
0
1513400
0
888600
0
864500
0
981300
0
Current Liabilities 5358000 5474000 6040000
676500
0
629100
0
683400
0
Working Capital (Current Asset-Current
Liabilities) 9667000
1058700
0 9094000
212100
0
235400
0
297900
0
Net Liquid Balance: The net liquid balance for the Nike Company has been around 3.26 Million
and the same has decreased for the company to around 2.96 Million. The net liquid balance for
the company on the other hand, has improved consistently for the company from -0.717 Million
to 0.603 Million in the trend period 2016-2018.
Solvency Ratio NIKE ADIDAS
2016 2017 2018 2016 2017 2018
Cash and Cash Equivalents 313800 380800 424900 151000 159800 262900
7 Robinson, Thomas R., et al. International financial statement analysis. John Wiley & Sons, 2015.
Solvency Ratio NIKE ADIDAS
2016 2017 2018 2016 2017 2018
Current Asset-Inventory 10187000 11006000 9873000 5123000 4953000 6368000
Current Liabilities 5358000 5474000 6040000 6765000 6291000 6834000
Quick Ratio (Current Asset-Inventory/Current Liabilities) 1.90 2.01 1.63 0.76 0.79 0.93
Working Capital: The working capital that the Nike Company has decreased from 9.66 million
to 9.09 million in the trend period 2016-2018. On the other hand, the working capital for Adidas
Company has increased from 2.12 million to 2.97 million in the trend period7. The availability of
the working capital for the company will be helping the company in managing the operations of
the company and paying off the current obligations well at time. At the same time, it is crucial to
note that over-availability of working capital in the operations of the company may be hurting
the company in the form of opportunity cost of capital.
Solvency Ratio NIKE ADIDAS
2016 2017 2018 2016 2017 2018
Current Assets
1502500
0
1606100
0
1513400
0
888600
0
864500
0
981300
0
Current Liabilities 5358000 5474000 6040000
676500
0
629100
0
683400
0
Working Capital (Current Asset-Current
Liabilities) 9667000
1058700
0 9094000
212100
0
235400
0
297900
0
Net Liquid Balance: The net liquid balance for the Nike Company has been around 3.26 Million
and the same has decreased for the company to around 2.96 Million. The net liquid balance for
the company on the other hand, has improved consistently for the company from -0.717 Million
to 0.603 Million in the trend period 2016-2018.
Solvency Ratio NIKE ADIDAS
2016 2017 2018 2016 2017 2018
Cash and Cash Equivalents 313800 380800 424900 151000 159800 262900
7 Robinson, Thomas R., et al. International financial statement analysis. John Wiley & Sons, 2015.
5
0 0 0 0 0 0
Short Term Investments
231900
0
237100
0 996000 269000 244000 274000
Notes Payable
219100
0
204800
0
227900
0
249600
0
197500
0
230000
0
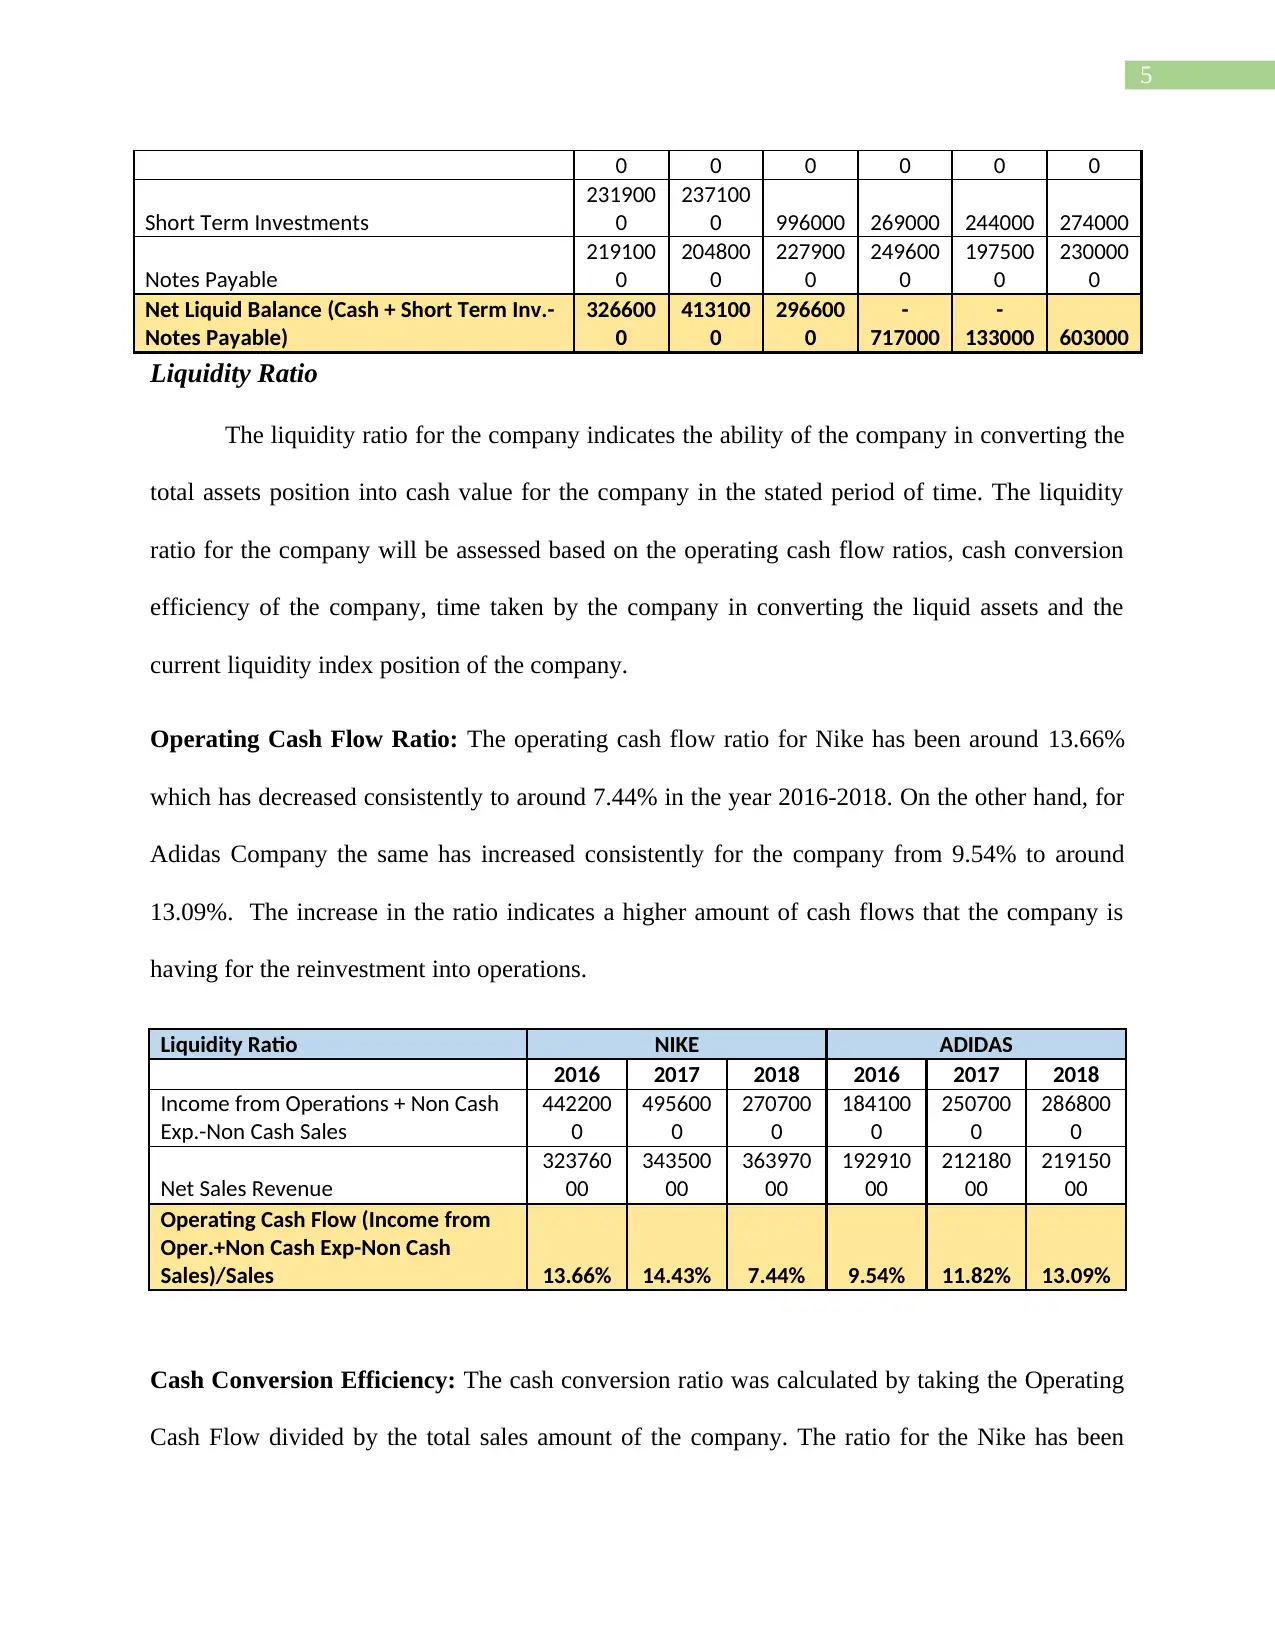
Net Liquid Balance (Cash + Short Term Inv.-
Notes Payable)
326600
0
413100
0
296600
0
-
717000
-
133000 603000
Liquidity Ratio
The liquidity ratio for the company indicates the ability of the company in converting the
total assets position into cash value for the company in the stated period of time. The liquidity
ratio for the company will be assessed based on the operating cash flow ratios, cash conversion
efficiency of the company, time taken by the company in converting the liquid assets and the
current liquidity index position of the company.
Operating Cash Flow Ratio: The operating cash flow ratio for Nike has been around 13.66%
which has decreased consistently to around 7.44% in the year 2016-2018. On the other hand, for
Adidas Company the same has increased consistently for the company from 9.54% to around
13.09%. The increase in the ratio indicates a higher amount of cash flows that the company is
having for the reinvestment into operations.
Liquidity Ratio NIKE ADIDAS
2016 2017 2018 2016 2017 2018
Income from Operations + Non Cash
Exp.-Non Cash Sales
442200
0
495600
0
270700
0
184100
0
250700
0
286800
0
Net Sales Revenue
323760
00
343500
00
363970
00
192910
00
212180
00
219150
00
Operating Cash Flow (Income from
Oper.+Non Cash Exp-Non Cash
Sales)/Sales 13.66% 14.43% 7.44% 9.54% 11.82% 13.09%
Cash Conversion Efficiency: The cash conversion ratio was calculated by taking the Operating
Cash Flow divided by the total sales amount of the company. The ratio for the Nike has been
0 0 0 0 0 0
Short Term Investments
231900
0
237100
0 996000 269000 244000 274000
Notes Payable
219100
0
204800
0
227900
0
249600
0
197500
0
230000
0
Net Liquid Balance (Cash + Short Term Inv.-
Notes Payable)
326600
0
413100
0
296600
0
-
717000
-
133000 603000
Liquidity Ratio
The liquidity ratio for the company indicates the ability of the company in converting the
total assets position into cash value for the company in the stated period of time. The liquidity
ratio for the company will be assessed based on the operating cash flow ratios, cash conversion
efficiency of the company, time taken by the company in converting the liquid assets and the
current liquidity index position of the company.
Operating Cash Flow Ratio: The operating cash flow ratio for Nike has been around 13.66%
which has decreased consistently to around 7.44% in the year 2016-2018. On the other hand, for
Adidas Company the same has increased consistently for the company from 9.54% to around
13.09%. The increase in the ratio indicates a higher amount of cash flows that the company is
having for the reinvestment into operations.
Liquidity Ratio NIKE ADIDAS
2016 2017 2018 2016 2017 2018
Income from Operations + Non Cash
Exp.-Non Cash Sales
442200
0
495600
0
270700
0
184100
0
250700
0
286800
0
Net Sales Revenue
323760
00
343500
00
363970
00
192910
00
212180
00
219150
00
Operating Cash Flow (Income from
Oper.+Non Cash Exp-Non Cash
Sales)/Sales 13.66% 14.43% 7.44% 9.54% 11.82% 13.09%
Cash Conversion Efficiency: The cash conversion ratio was calculated by taking the Operating
Cash Flow divided by the total sales amount of the company. The ratio for the Nike has been
⊘ This is a preview!⊘
Do you want full access?
Subscribe today to unlock all pages.
Trusted by 1+ million students worldwide
6
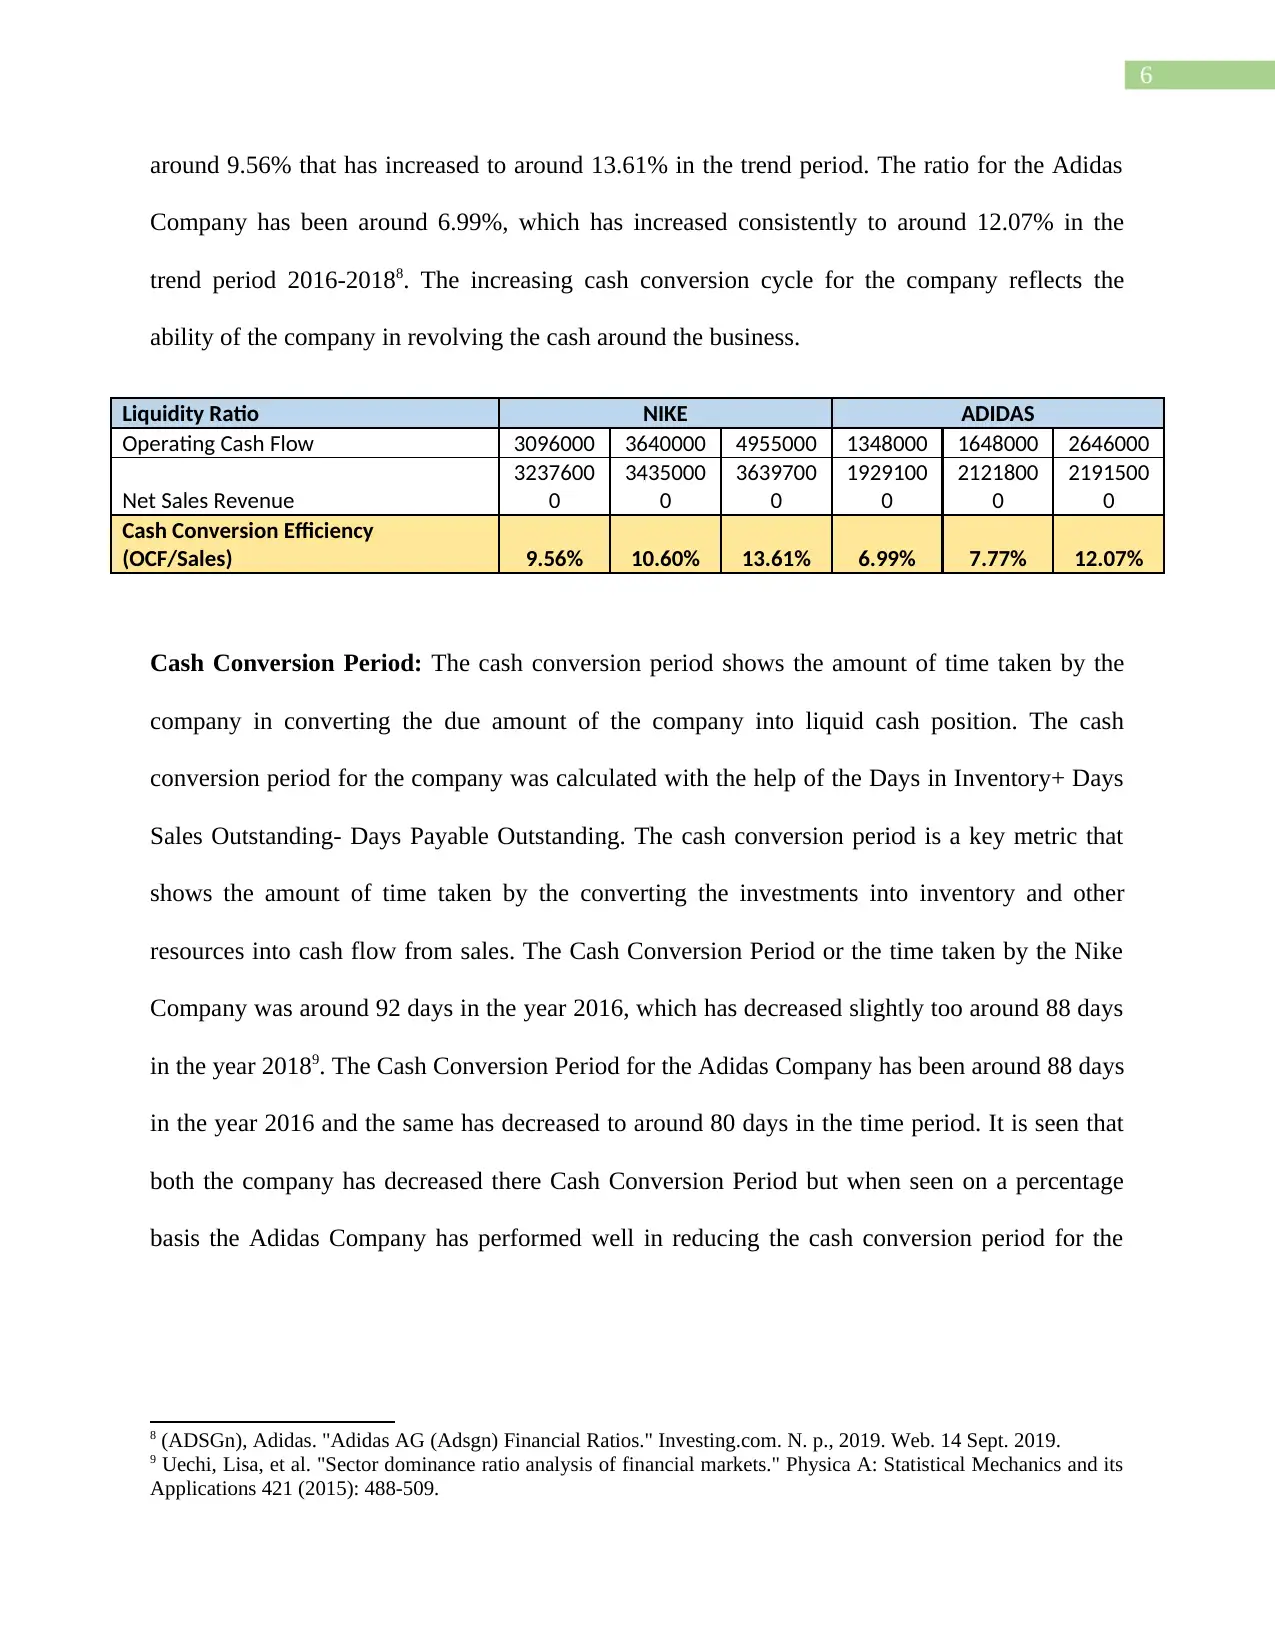
around 9.56% that has increased to around 13.61% in the trend period. The ratio for the Adidas
Company has been around 6.99%, which has increased consistently to around 12.07% in the
trend period 2016-20188. The increasing cash conversion cycle for the company reflects the
ability of the company in revolving the cash around the business.
Liquidity Ratio NIKE ADIDAS
Operating Cash Flow 3096000 3640000 4955000 1348000 1648000 2646000
Net Sales Revenue
3237600
0
3435000
0
3639700
0
1929100
0
2121800
0
2191500
0
Cash Conversion Efficiency
(OCF/Sales) 9.56% 10.60% 13.61% 6.99% 7.77% 12.07%
Cash Conversion Period: The cash conversion period shows the amount of time taken by the
company in converting the due amount of the company into liquid cash position. The cash
conversion period for the company was calculated with the help of the Days in Inventory+ Days
Sales Outstanding- Days Payable Outstanding. The cash conversion period is a key metric that
shows the amount of time taken by the converting the investments into inventory and other
resources into cash flow from sales. The Cash Conversion Period or the time taken by the Nike
Company was around 92 days in the year 2016, which has decreased slightly too around 88 days
in the year 20189. The Cash Conversion Period for the Adidas Company has been around 88 days
in the year 2016 and the same has decreased to around 80 days in the time period. It is seen that
both the company has decreased there Cash Conversion Period but when seen on a percentage
basis the Adidas Company has performed well in reducing the cash conversion period for the
8 (ADSGn), Adidas. "Adidas AG (Adsgn) Financial Ratios." Investing.com. N. p., 2019. Web. 14 Sept. 2019.
9 Uechi, Lisa, et al. "Sector dominance ratio analysis of financial markets." Physica A: Statistical Mechanics and its
Applications 421 (2015): 488-509.
Paraphrase This Document
Need a fresh take? Get an instant paraphrase of this document with our AI Paraphraser
7
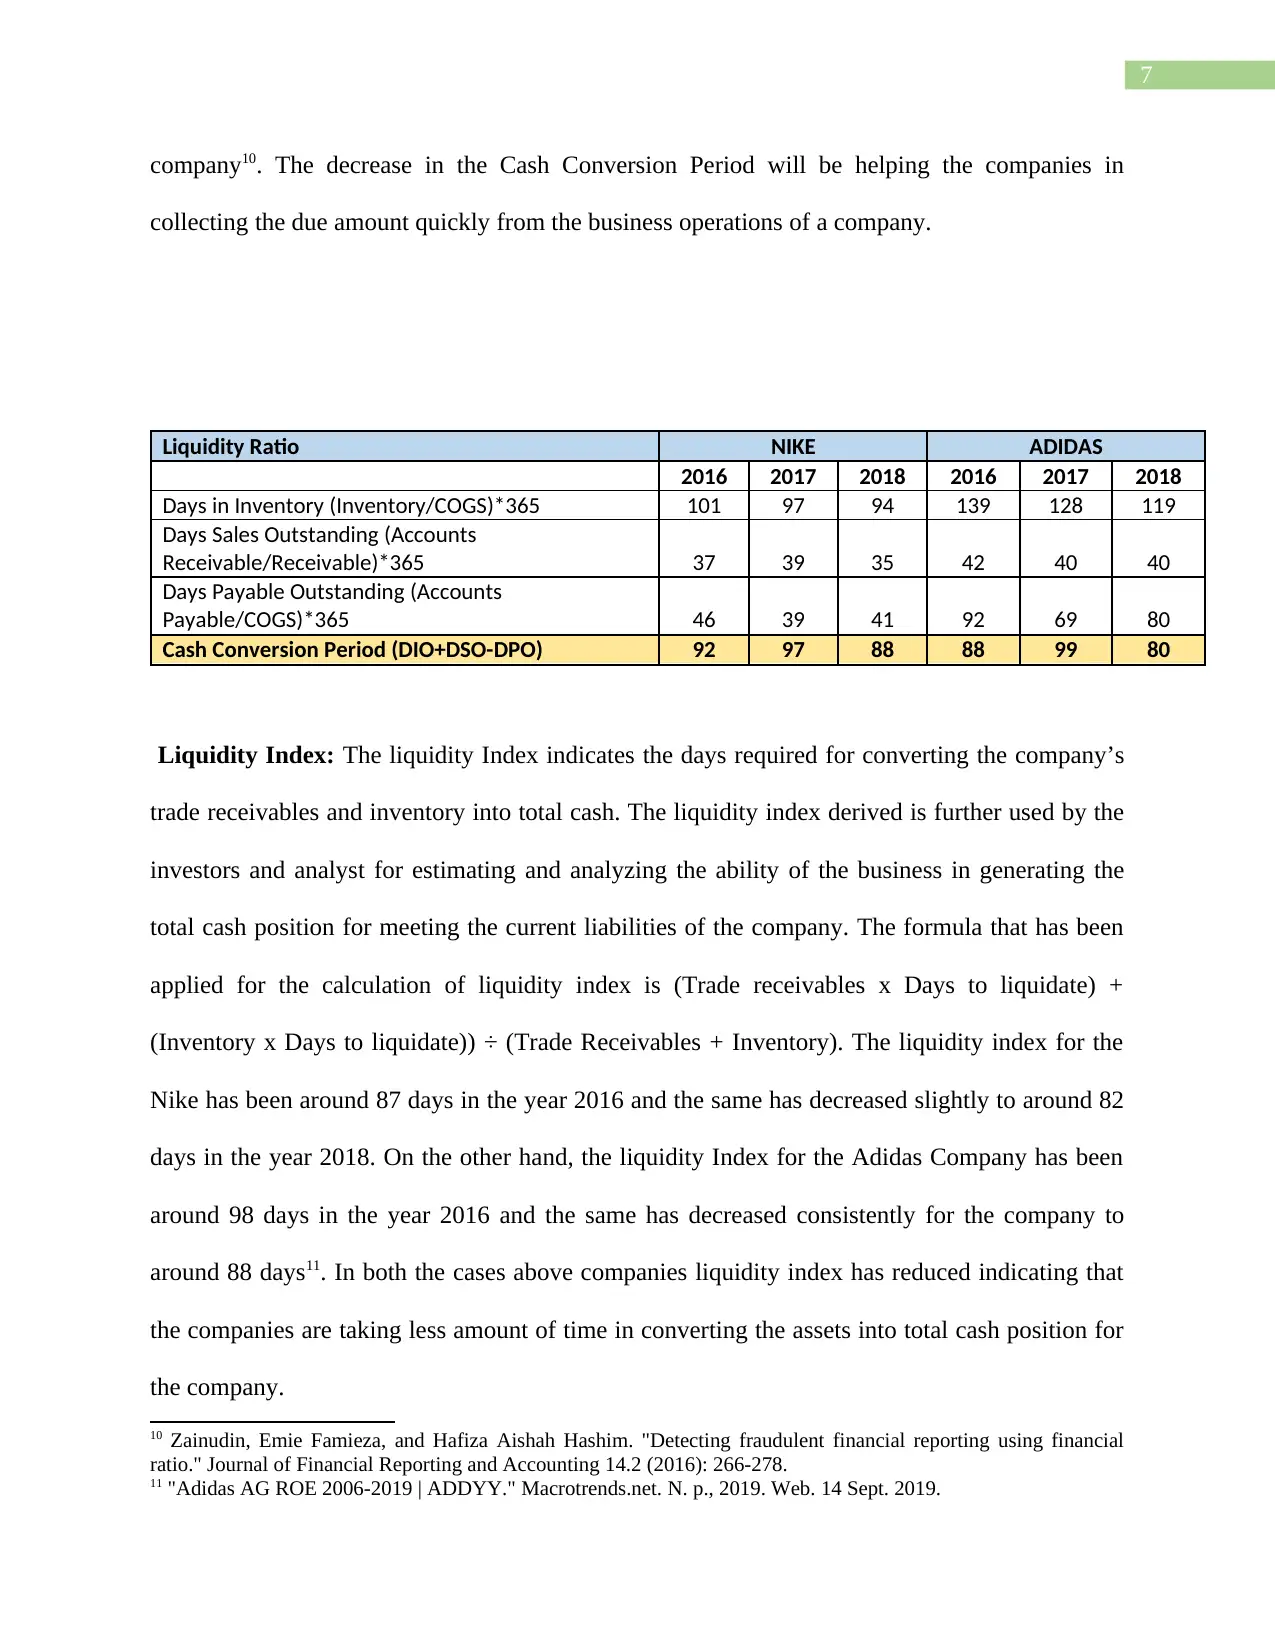
company10. The decrease in the Cash Conversion Period will be helping the companies in
collecting the due amount quickly from the business operations of a company.
Liquidity Ratio NIKE ADIDAS
2016 2017 2018 2016 2017 2018
Days in Inventory (Inventory/COGS)*365 101 97 94 139 128 119
Days Sales Outstanding (Accounts
Receivable/Receivable)*365 37 39 35 42 40 40
Days Payable Outstanding (Accounts
Payable/COGS)*365 46 39 41 92 69 80
Cash Conversion Period (DIO+DSO-DPO) 92 97 88 88 99 80
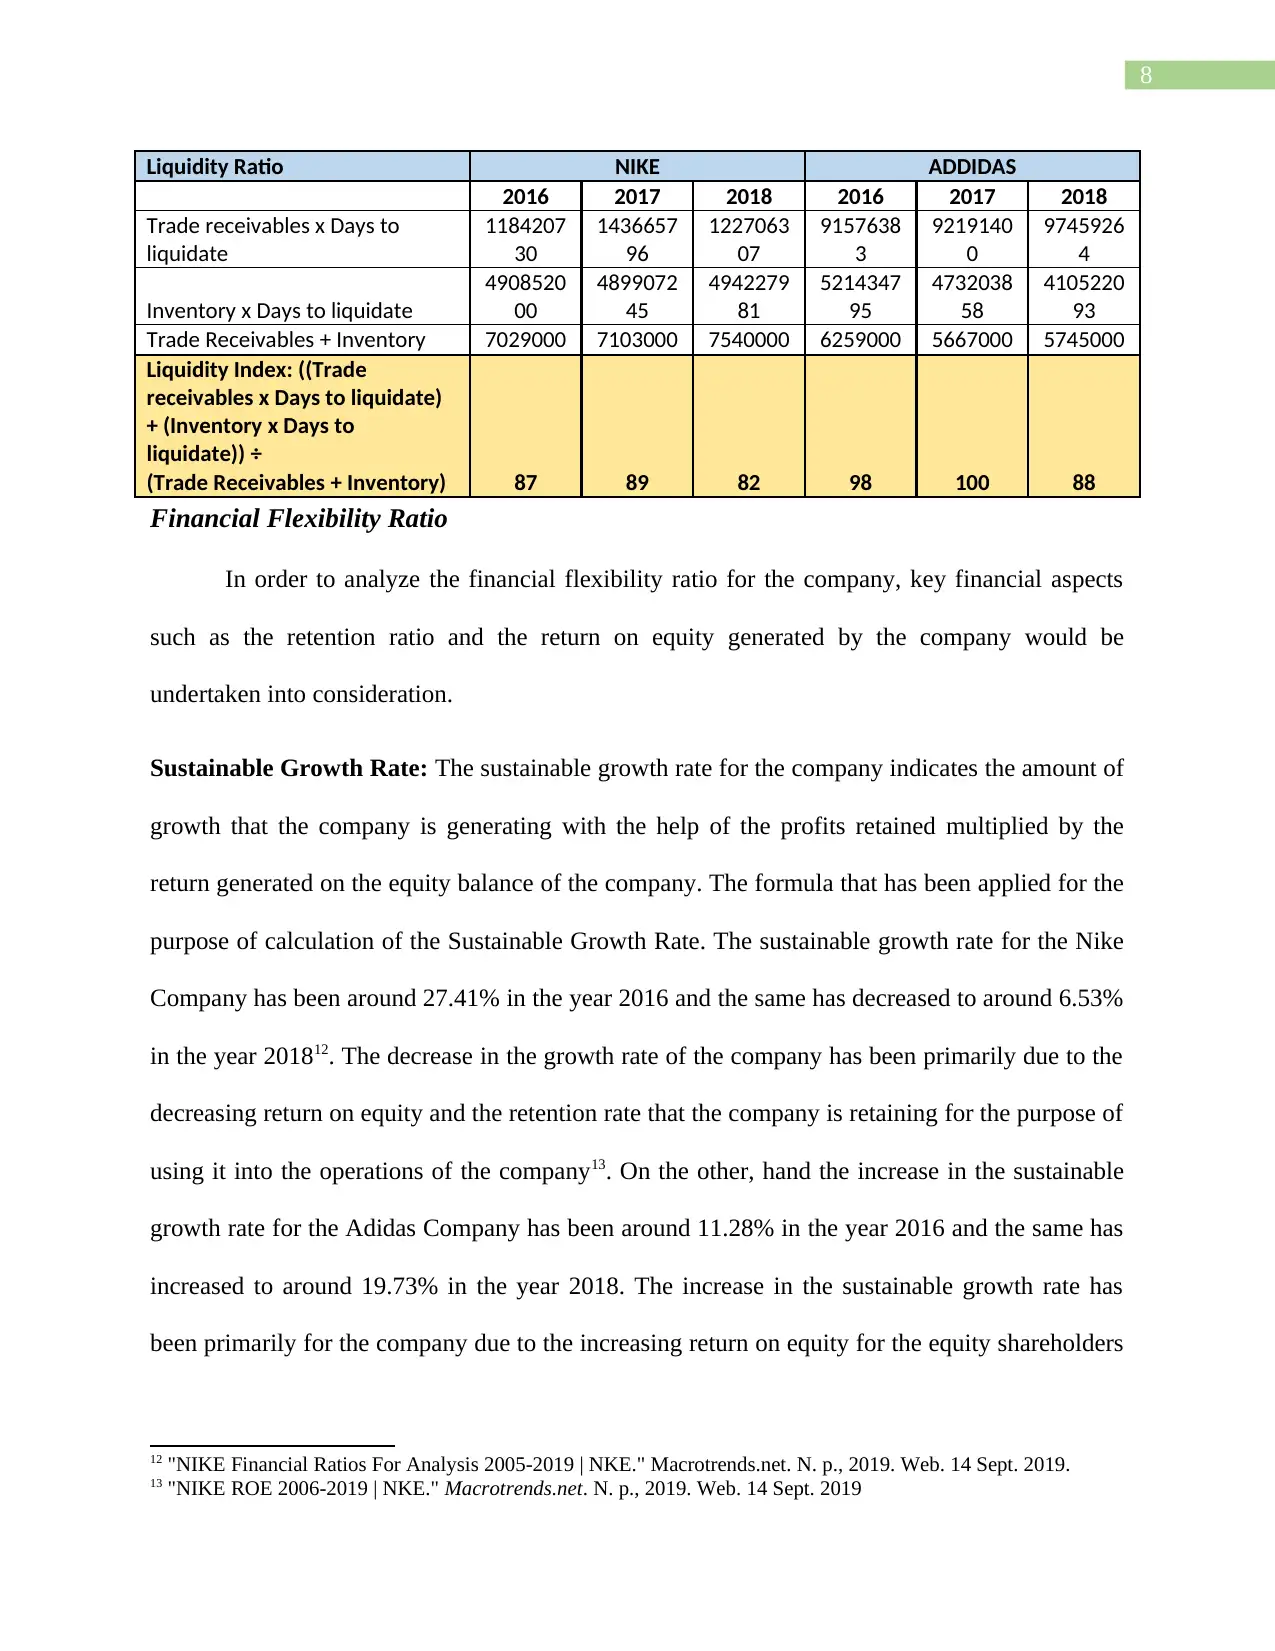
Liquidity Index: The liquidity Index indicates the days required for converting the company’s
trade receivables and inventory into total cash. The liquidity index derived is further used by the
investors and analyst for estimating and analyzing the ability of the business in generating the
total cash position for meeting the current liabilities of the company. The formula that has been
applied for the calculation of liquidity index is (Trade receivables x Days to liquidate) +
(Inventory x Days to liquidate)) ÷ (Trade Receivables + Inventory). The liquidity index for the
Nike has been around 87 days in the year 2016 and the same has decreased slightly to around 82
days in the year 2018. On the other hand, the liquidity Index for the Adidas Company has been
around 98 days in the year 2016 and the same has decreased consistently for the company to
around 88 days11. In both the cases above companies liquidity index has reduced indicating that
the companies are taking less amount of time in converting the assets into total cash position for
the company.
10 Zainudin, Emie Famieza, and Hafiza Aishah Hashim. "Detecting fraudulent financial reporting using financial
ratio." Journal of Financial Reporting and Accounting 14.2 (2016): 266-278.
11 "Adidas AG ROE 2006-2019 | ADDYY." Macrotrends.net. N. p., 2019. Web. 14 Sept. 2019.
company10. The decrease in the Cash Conversion Period will be helping the companies in
collecting the due amount quickly from the business operations of a company.
Liquidity Ratio NIKE ADIDAS
2016 2017 2018 2016 2017 2018
Days in Inventory (Inventory/COGS)*365 101 97 94 139 128 119
Days Sales Outstanding (Accounts
Receivable/Receivable)*365 37 39 35 42 40 40
Days Payable Outstanding (Accounts
Payable/COGS)*365 46 39 41 92 69 80
Cash Conversion Period (DIO+DSO-DPO) 92 97 88 88 99 80
Liquidity Index: The liquidity Index indicates the days required for converting the company’s
trade receivables and inventory into total cash. The liquidity index derived is further used by the
investors and analyst for estimating and analyzing the ability of the business in generating the
total cash position for meeting the current liabilities of the company. The formula that has been
applied for the calculation of liquidity index is (Trade receivables x Days to liquidate) +
(Inventory x Days to liquidate)) ÷ (Trade Receivables + Inventory). The liquidity index for the
Nike has been around 87 days in the year 2016 and the same has decreased slightly to around 82
days in the year 2018. On the other hand, the liquidity Index for the Adidas Company has been
around 98 days in the year 2016 and the same has decreased consistently for the company to
around 88 days11. In both the cases above companies liquidity index has reduced indicating that
the companies are taking less amount of time in converting the assets into total cash position for
the company.
10 Zainudin, Emie Famieza, and Hafiza Aishah Hashim. "Detecting fraudulent financial reporting using financial
ratio." Journal of Financial Reporting and Accounting 14.2 (2016): 266-278.
11 "Adidas AG ROE 2006-2019 | ADDYY." Macrotrends.net. N. p., 2019. Web. 14 Sept. 2019.
8
Liquidity Ratio NIKE ADDIDAS
2016 2017 2018 2016 2017 2018
Trade receivables x Days to
liquidate
1184207
30
1436657
96
1227063
07
9157638
3
9219140
0
9745926
4
Inventory x Days to liquidate
4908520
00
4899072
45
4942279
81
5214347
95
4732038
58
4105220
93
Trade Receivables + Inventory 7029000 7103000 7540000 6259000 5667000 5745000
Liquidity Index: ((Trade
receivables x Days to liquidate)
+ (Inventory x Days to
liquidate)) ÷
(Trade Receivables + Inventory) 87 89 82 98 100 88
Financial Flexibility Ratio
In order to analyze the financial flexibility ratio for the company, key financial aspects
such as the retention ratio and the return on equity generated by the company would be
undertaken into consideration.
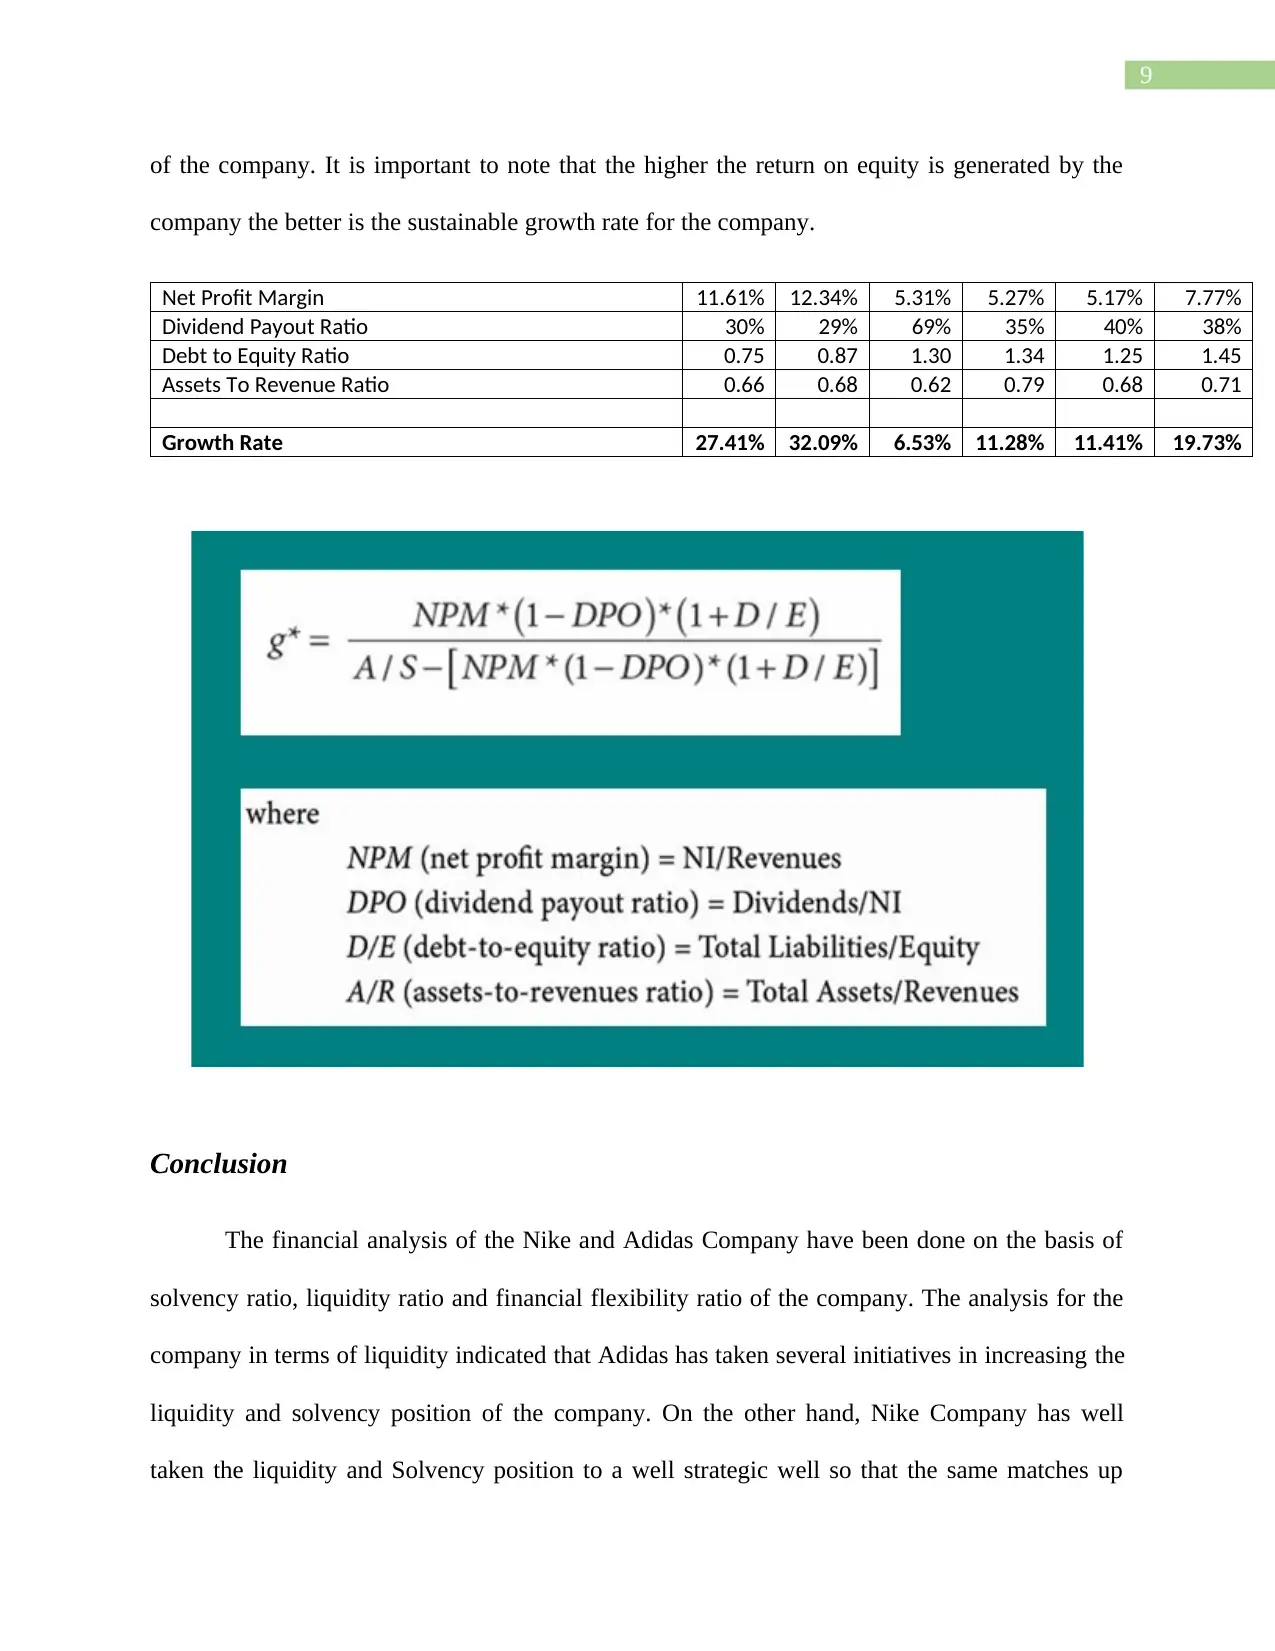
Sustainable Growth Rate: The sustainable growth rate for the company indicates the amount of
growth that the company is generating with the help of the profits retained multiplied by the
return generated on the equity balance of the company. The formula that has been applied for the
purpose of calculation of the Sustainable Growth Rate. The sustainable growth rate for the Nike
Company has been around 27.41% in the year 2016 and the same has decreased to around 6.53%
in the year 201812. The decrease in the growth rate of the company has been primarily due to the
decreasing return on equity and the retention rate that the company is retaining for the purpose of
using it into the operations of the company13. On the other, hand the increase in the sustainable
growth rate for the Adidas Company has been around 11.28% in the year 2016 and the same has
increased to around 19.73% in the year 2018. The increase in the sustainable growth rate has
been primarily for the company due to the increasing return on equity for the equity shareholders
12 "NIKE Financial Ratios For Analysis 2005-2019 | NKE." Macrotrends.net. N. p., 2019. Web. 14 Sept. 2019.
13 "NIKE ROE 2006-2019 | NKE." Macrotrends.net. N. p., 2019. Web. 14 Sept. 2019
Liquidity Ratio NIKE ADDIDAS
2016 2017 2018 2016 2017 2018
Trade receivables x Days to
liquidate
1184207
30
1436657
96
1227063
07
9157638
3
9219140
0
9745926
4
Inventory x Days to liquidate
4908520
00
4899072
45
4942279
81
5214347
95
4732038
58
4105220
93
Trade Receivables + Inventory 7029000 7103000 7540000 6259000 5667000 5745000
Liquidity Index: ((Trade
receivables x Days to liquidate)
+ (Inventory x Days to
liquidate)) ÷
(Trade Receivables + Inventory) 87 89 82 98 100 88
Financial Flexibility Ratio
In order to analyze the financial flexibility ratio for the company, key financial aspects
such as the retention ratio and the return on equity generated by the company would be
undertaken into consideration.
Sustainable Growth Rate: The sustainable growth rate for the company indicates the amount of
growth that the company is generating with the help of the profits retained multiplied by the
return generated on the equity balance of the company. The formula that has been applied for the
purpose of calculation of the Sustainable Growth Rate. The sustainable growth rate for the Nike
Company has been around 27.41% in the year 2016 and the same has decreased to around 6.53%
in the year 201812. The decrease in the growth rate of the company has been primarily due to the
decreasing return on equity and the retention rate that the company is retaining for the purpose of
using it into the operations of the company13. On the other, hand the increase in the sustainable
growth rate for the Adidas Company has been around 11.28% in the year 2016 and the same has
increased to around 19.73% in the year 2018. The increase in the sustainable growth rate has
been primarily for the company due to the increasing return on equity for the equity shareholders
12 "NIKE Financial Ratios For Analysis 2005-2019 | NKE." Macrotrends.net. N. p., 2019. Web. 14 Sept. 2019.
13 "NIKE ROE 2006-2019 | NKE." Macrotrends.net. N. p., 2019. Web. 14 Sept. 2019
⊘ This is a preview!⊘
Do you want full access?
Subscribe today to unlock all pages.
Trusted by 1+ million students worldwide
9
of the company. It is important to note that the higher the return on equity is generated by the
company the better is the sustainable growth rate for the company.
Net Profit Margin 11.61% 12.34% 5.31% 5.27% 5.17% 7.77%
Dividend Payout Ratio 30% 29% 69% 35% 40% 38%
Debt to Equity Ratio 0.75 0.87 1.30 1.34 1.25 1.45
Assets To Revenue Ratio 0.66 0.68 0.62 0.79 0.68 0.71
Growth Rate 27.41% 32.09% 6.53% 11.28% 11.41% 19.73%
Conclusion
The financial analysis of the Nike and Adidas Company have been done on the basis of
solvency ratio, liquidity ratio and financial flexibility ratio of the company. The analysis for the
company in terms of liquidity indicated that Adidas has taken several initiatives in increasing the
liquidity and solvency position of the company. On the other hand, Nike Company has well
taken the liquidity and Solvency position to a well strategic well so that the same matches up
Paraphrase This Document
Need a fresh take? Get an instant paraphrase of this document with our AI Paraphraser
10
with the industry level position for the company. In terms of financial flexibility indicating the
sustainable growth of the company, the same has been well consistent for the Adidas Company
as the return on equity for the company has grown considerably well in the trend period 2016-
2018. On the other hand, the same has declined for the Nike Company in the stated period
because of the falling return on equity for the company in the trend period analyzed. It can be
concluded from the above analysis that both the company is having a sound financial position in
maintain the operations efficient. However, if seen from the point of improvement Adidas
Company has shown a much more consistent improvement in the financial aspects.
11
References
"Adidas AG Adr (ADDYY) Dividend History - Dividata." Dividata.com. N. p., 2019. Web. 14
Sept. 2019.
"Adidas AG ROE 2006-2019 | ADDYY." Macrotrends.net. N. p., 2019. Web. 14 Sept. 2019.
"Adidas Financial Statement Analysis." Rstudio-pubs-static.s3.amazonaws.com. N. p., 2019.
Web. 14 Sept. 2019.
"Nike Current Ratio | NKE - Gurufocus.Com." Gurufocus.com. N. p., 2019. Web. 14 Sept. 2019.
"NIKE Financial Ratios For Analysis 2005-2019 | NKE." Macrotrends.net. N. p., 2019. Web. 14
Sept. 2019.
"Nike Inc. (NKE) | Financial Analysis And Stock Valuation." Stock Analysis on Net. N. p., 2019.
Web. 14 Sept. 2019.
"NIKE ROE 2006-2019 | NKE." Macrotrends.net. N. p., 2019. Web. 14 Sept. 2019.
"NIKE, Inc. 2018 Annual Report." Materials.proxyvote.com. N. p., 2019. Web. 14 Sept. 2019.
(ADSGn), Adidas. "Adidas AG (Adsgn) Financial Ratios." Investing.com. N. p., 2019. Web. 14
Sept. 2019.
Report.adidas-group.com. N. p., 2019. Web. 14 Sept. 2019.
Robinson, Thomas R., et al. International financial statement analysis. John Wiley & Sons,
2015.
⊘ This is a preview!⊘
Do you want full access?
Subscribe today to unlock all pages.
Trusted by 1+ million students worldwide
1 out of 13
Related Documents


Your All-in-One AI-Powered Toolkit for Academic Success.
+13062052269
info@desklib.com
Available 24*7 on WhatsApp / Email
![[object Object]](/_next/static/media/star-bottom.7253800d.svg)
Unlock your academic potential
Copyright © 2020–2026 A2Z Services. All Rights Reserved. Developed and managed by ZUCOL.