Nike: Comprehensive Profit and Customer Satisfaction Analysis Report
VerifiedAdded on 2021/05/30
|29
|4014
|250
Report
AI Summary
This report presents a detailed profit and customer satisfaction analysis for Nike, examining various aspects of the company's performance. The analysis investigates customer characteristics, including preferences and satisfaction levels across different user groups and genders. It explores the best and worst-selling product categories, identifies significant differences in payment methods (PayPal vs. Credit Card), and analyzes the relationship between Cost of Goods Sold (COGS) and net revenue. The study also examines how profit patterns change on a monthly and sex basis, providing insights into sales trends and customer behavior. The report utilizes statistical methods such as ANOVA, t-tests, and Chi-square tests to draw conclusions and offers recommendations based on the findings. The report also includes tables and figures to support the analysis.
1
A Detailed Profit Analysis with Customer
Satisfaction for Nike
Student Name: Student ID:
Unit Name: Unit ID:
Date Due: Professor Name:
Word Limit:
A Detailed Profit Analysis with Customer
Satisfaction for Nike
Student Name: Student ID:
Unit Name: Unit ID:
Date Due: Professor Name:
Word Limit:
Paraphrase This Document
Need a fresh take? Get an instant paraphrase of this document with our AI Paraphraser
2
Contents
Table of Tables............................................................................................................................................2
Table of Figures...........................................................................................................................................2
1.0 Introduction of the Problem..................................................................................................................4
2.0 Classification of Business Problems of Nike...........................................................................................4
3.0 Results of Analytical and Technical analysis..........................................................................................6
3.1 Customer Characteristic Investigation...............................................................................................6
3.11 Do the customer states of mind demonstrate a differentiation for three user factions..............6
3.12 Do the customer states of mind demonstrate a distinction for two sexes..................................7
3.2 Profit and COGS Analysis...................................................................................................................9
3.21 Which are the best and the worst selling product........................................................................9
3.22 Is there any significant difference in payment methods............................................................12
3.23 How COGS score was related product category........................................................................13
3.24 How the two payment methods are different for product wise payment.................................15
3.25 What is the level of association between COGS and net revenue levels...................................16
3.26 How profit pattern changes on monthly basis...........................................................................16
3.27 How profit pattern changes on sex basis...................................................................................18
4.0 Discussion and Recommendations......................................................................................................20
5.0 References...........................................................................................................................................20
6.0 Appendix..............................................................................................................................................22
Table of Tables
Table 1: Descriptive statistics for different personality traits......................................................................7
Table 2: Sex based descriptive value for customer attributes.....................................................................8
Table 3: Website User Group * Gender * Awareness of Nike Cross Tabulation..........................................9
Table 4: Post Hoc results for customer attributes.....................................................................................23
Table 5: Sex * Product Class Cross tabulation............................................................................................24
Table 6: One-Sample Test for two payment options.................................................................................25
Table 7: One way Descriptive values for usage groups..............................................................................26
Table 8: ANOVA for attributes of customers.............................................................................................27
Table 9: Paired Samples t-Test for payment methods..............................................................27
Table 10: Correlation between Cost of goods and Profit Total..................................................................28
Table 11: Chi-Square Tests for customer attributes..................................................................................28
3
Table of Figures
Figure 1: Gender frequency based on usage group.....................................................................................9
Figure 2: Annual total profit based on product category...........................................................................10
Figure 3: Identification of best and worst product....................................................................................11
Figure 4: Best and worst selling product category.....................................................................................12
Figure 5: Classification tree for entire product segments..........................................................................12
Figure 6: Box Plot for Credit card payment................................................................................................13
Figure 7: Box Plot for Pay Pal payment......................................................................................................14
Figure 8: Classification tree describing entire product segments on COGS...............................................15
Figure 9: Product lines on Pay Pal payment...............................................................................................16
Figure 10: Product lines on Credit Card payment......................................................................................17
Figure 11: Monthly total_ profit distribution bar diagram........................................................................18
Figure 12: Month wise total profit distribution.........................................................................................19
Figure 13: Sex wise profit distribution.......................................................................................................19
Figure 14: Classification tree for profit based on broadly considered sex.................................................20
Figure 15: Average profit product item wise.............................................................................................25
⊘ This is a preview!⊘
Do you want full access?
Subscribe today to unlock all pages.
Trusted by 1+ million students worldwide
4
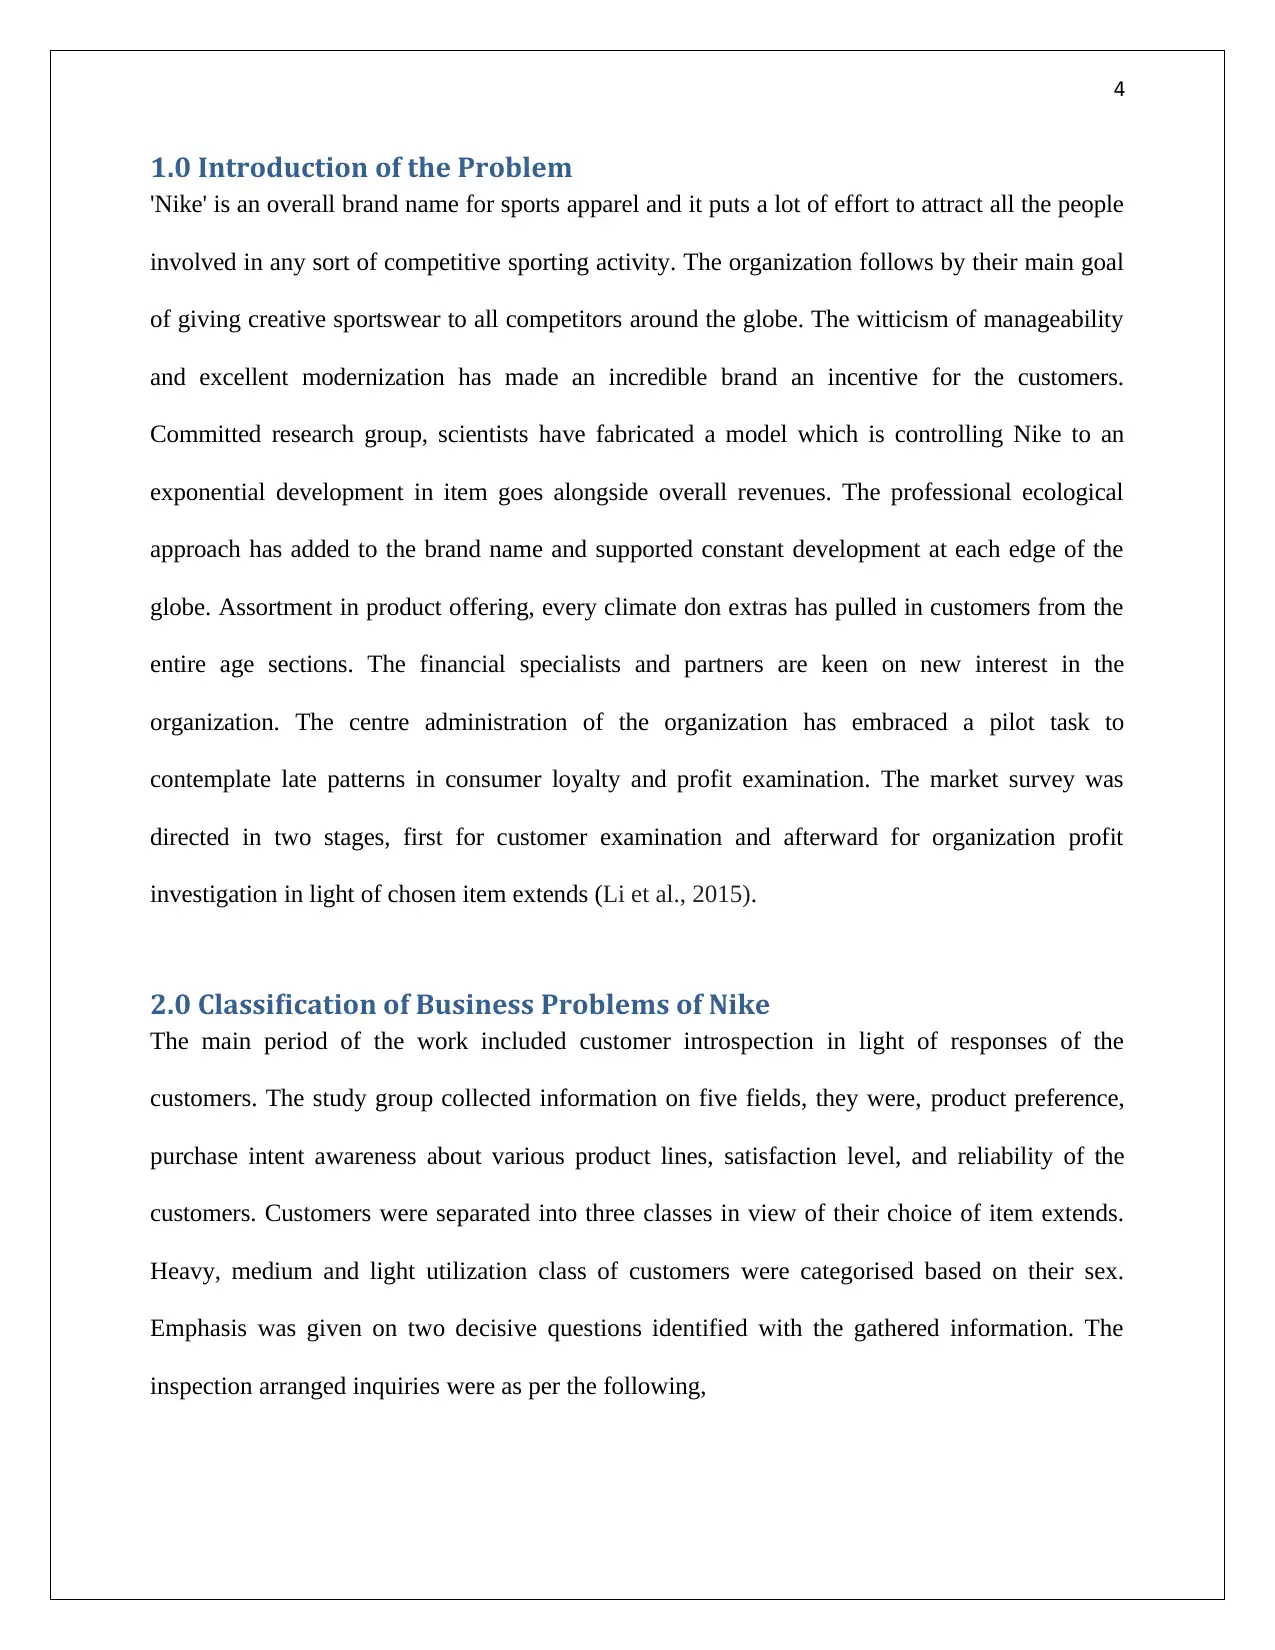
1.0 Introduction of the Problem
'Nike' is an overall brand name for sports apparel and it puts a lot of effort to attract all the people
involved in any sort of competitive sporting activity. The organization follows by their main goal
of giving creative sportswear to all competitors around the globe. The witticism of manageability
and excellent modernization has made an incredible brand an incentive for the customers.
Committed research group, scientists have fabricated a model which is controlling Nike to an
exponential development in item goes alongside overall revenues. The professional ecological
approach has added to the brand name and supported constant development at each edge of the
globe. Assortment in product offering, every climate don extras has pulled in customers from the
entire age sections. The financial specialists and partners are keen on new interest in the
organization. The centre administration of the organization has embraced a pilot task to
contemplate late patterns in consumer loyalty and profit examination. The market survey was
directed in two stages, first for customer examination and afterward for organization profit
investigation in light of chosen item extends (Li et al., 2015).
2.0 Classification of Business Problems of Nike
The main period of the work included customer introspection in light of responses of the
customers. The study group collected information on five fields, they were, product preference,
purchase intent awareness about various product lines, satisfaction level, and reliability of the
customers. Customers were separated into three classes in view of their choice of item extends.
Heavy, medium and light utilization class of customers were categorised based on their sex.
Emphasis was given on two decisive questions identified with the gathered information. The
inspection arranged inquiries were as per the following,
Paraphrase This Document
Need a fresh take? Get an instant paraphrase of this document with our AI Paraphraser
5
Do the customer states of mind demonstrate a differentiation for three user factions?
Do the customer states of mind demonstrate a distinction for two sexes?
Three user class and sex of the users were two ordinal factors. Examination of five customer
identity qualities, which were ordinal in nature, was performed for the user class and their sex.
The proper decision of explanatory technique for correlation was considered as Cross-
Tabulation. The inferential conclusion was drawn from Chi-square test (Mikulić et al., 2017).
Profit analysis was completed in the second stage which included COGS data of one year with
nine distinctive product offerings. Edge of cost of items (COGS) and aggregate profit, alongside
payment modes were examined. As the primary concern of each industry is profit, the
administration chose to centre on the profit figures, related with item classifications. For
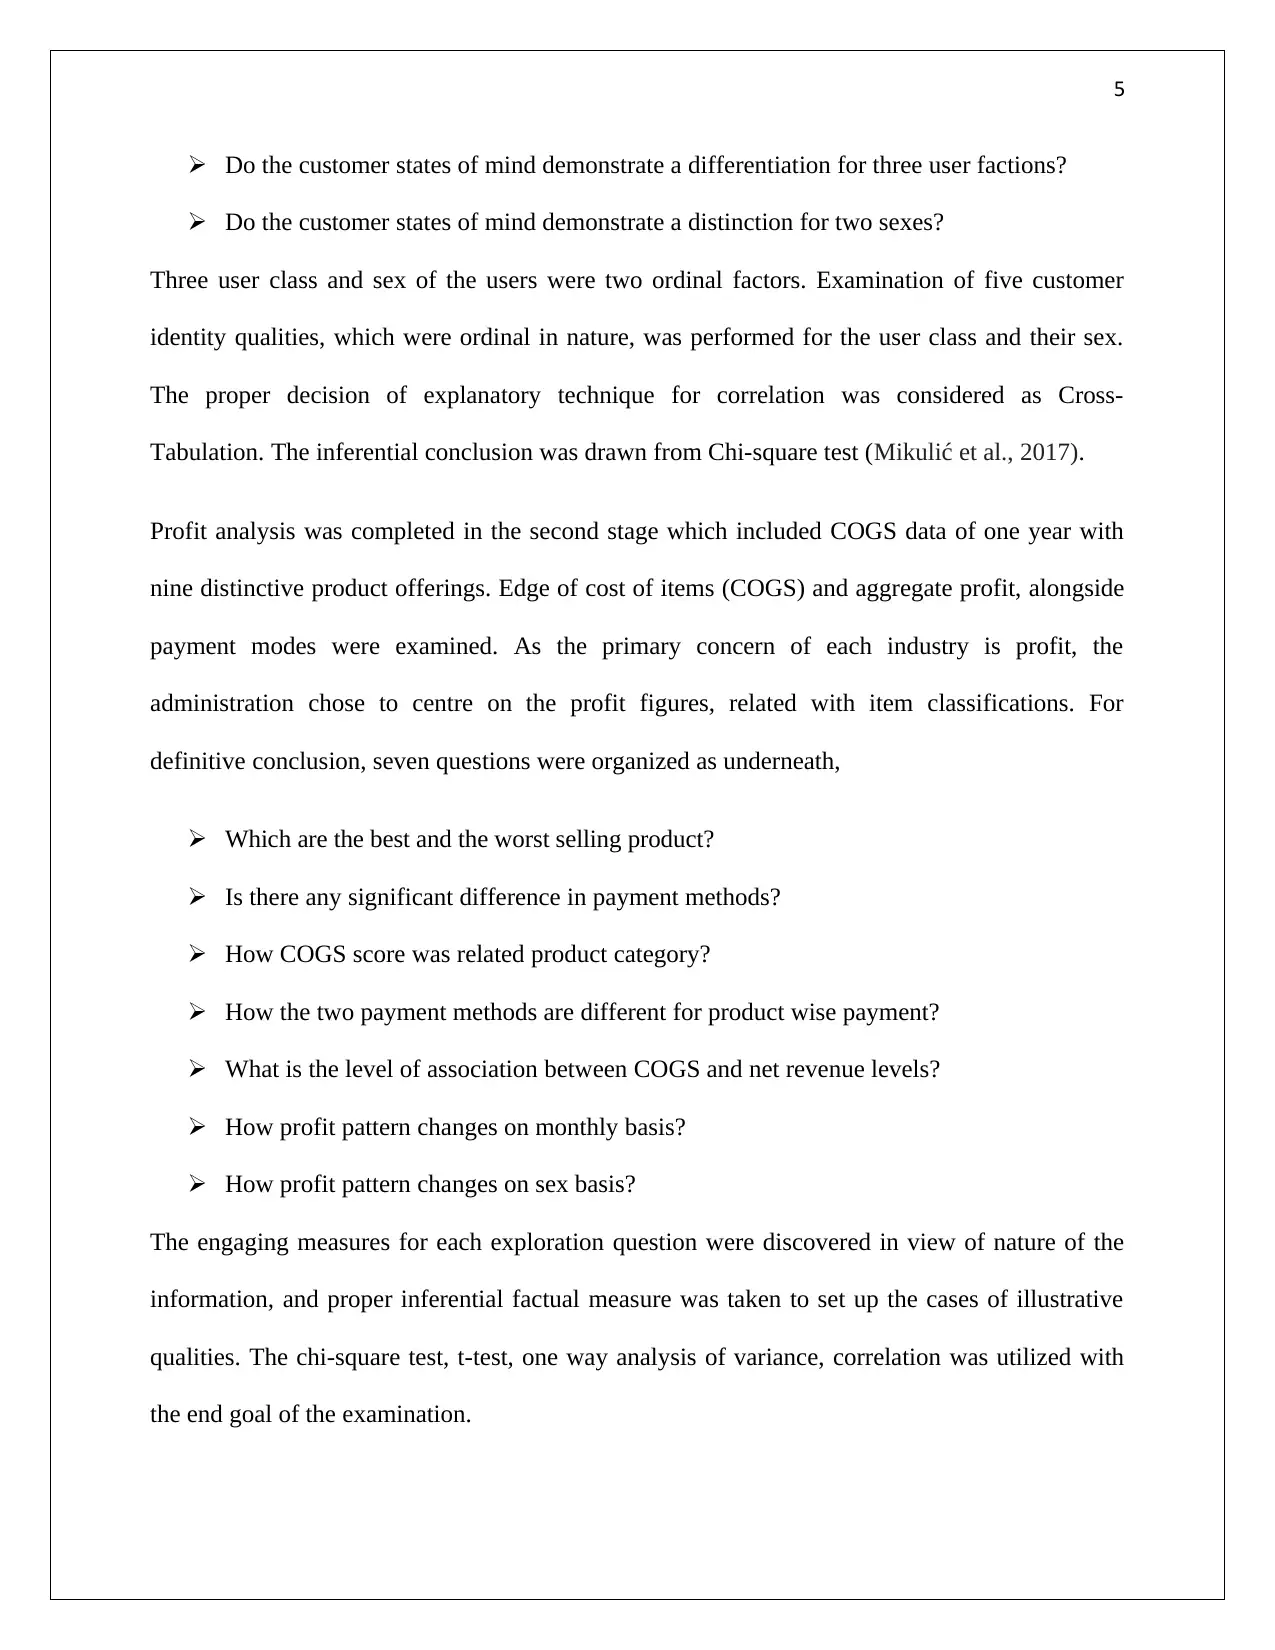
definitive conclusion, seven questions were organized as underneath,
Which are the best and the worst selling product?
Is there any significant difference in payment methods?
How COGS score was related product category?
How the two payment methods are different for product wise payment?
What is the level of association between COGS and net revenue levels?
How profit pattern changes on monthly basis?
How profit pattern changes on sex basis?
The engaging measures for each exploration question were discovered in view of nature of the
information, and proper inferential factual measure was taken to set up the cases of illustrative
qualities. The chi-square test, t-test, one way analysis of variance, correlation was utilized with
the end goal of the examination.
Do the customer states of mind demonstrate a differentiation for three user factions?
Do the customer states of mind demonstrate a distinction for two sexes?
Three user class and sex of the users were two ordinal factors. Examination of five customer
identity qualities, which were ordinal in nature, was performed for the user class and their sex.
The proper decision of explanatory technique for correlation was considered as Cross-
Tabulation. The inferential conclusion was drawn from Chi-square test (Mikulić et al., 2017).
Profit analysis was completed in the second stage which included COGS data of one year with
nine distinctive product offerings. Edge of cost of items (COGS) and aggregate profit, alongside
payment modes were examined. As the primary concern of each industry is profit, the
administration chose to centre on the profit figures, related with item classifications. For
definitive conclusion, seven questions were organized as underneath,
Which are the best and the worst selling product?
Is there any significant difference in payment methods?
How COGS score was related product category?
How the two payment methods are different for product wise payment?
What is the level of association between COGS and net revenue levels?
How profit pattern changes on monthly basis?
How profit pattern changes on sex basis?
The engaging measures for each exploration question were discovered in view of nature of the
information, and proper inferential factual measure was taken to set up the cases of illustrative
qualities. The chi-square test, t-test, one way analysis of variance, correlation was utilized with
the end goal of the examination.
6
3.0 Results of Analytical and Technical analysis
3.1 Customer Characteristic Investigation
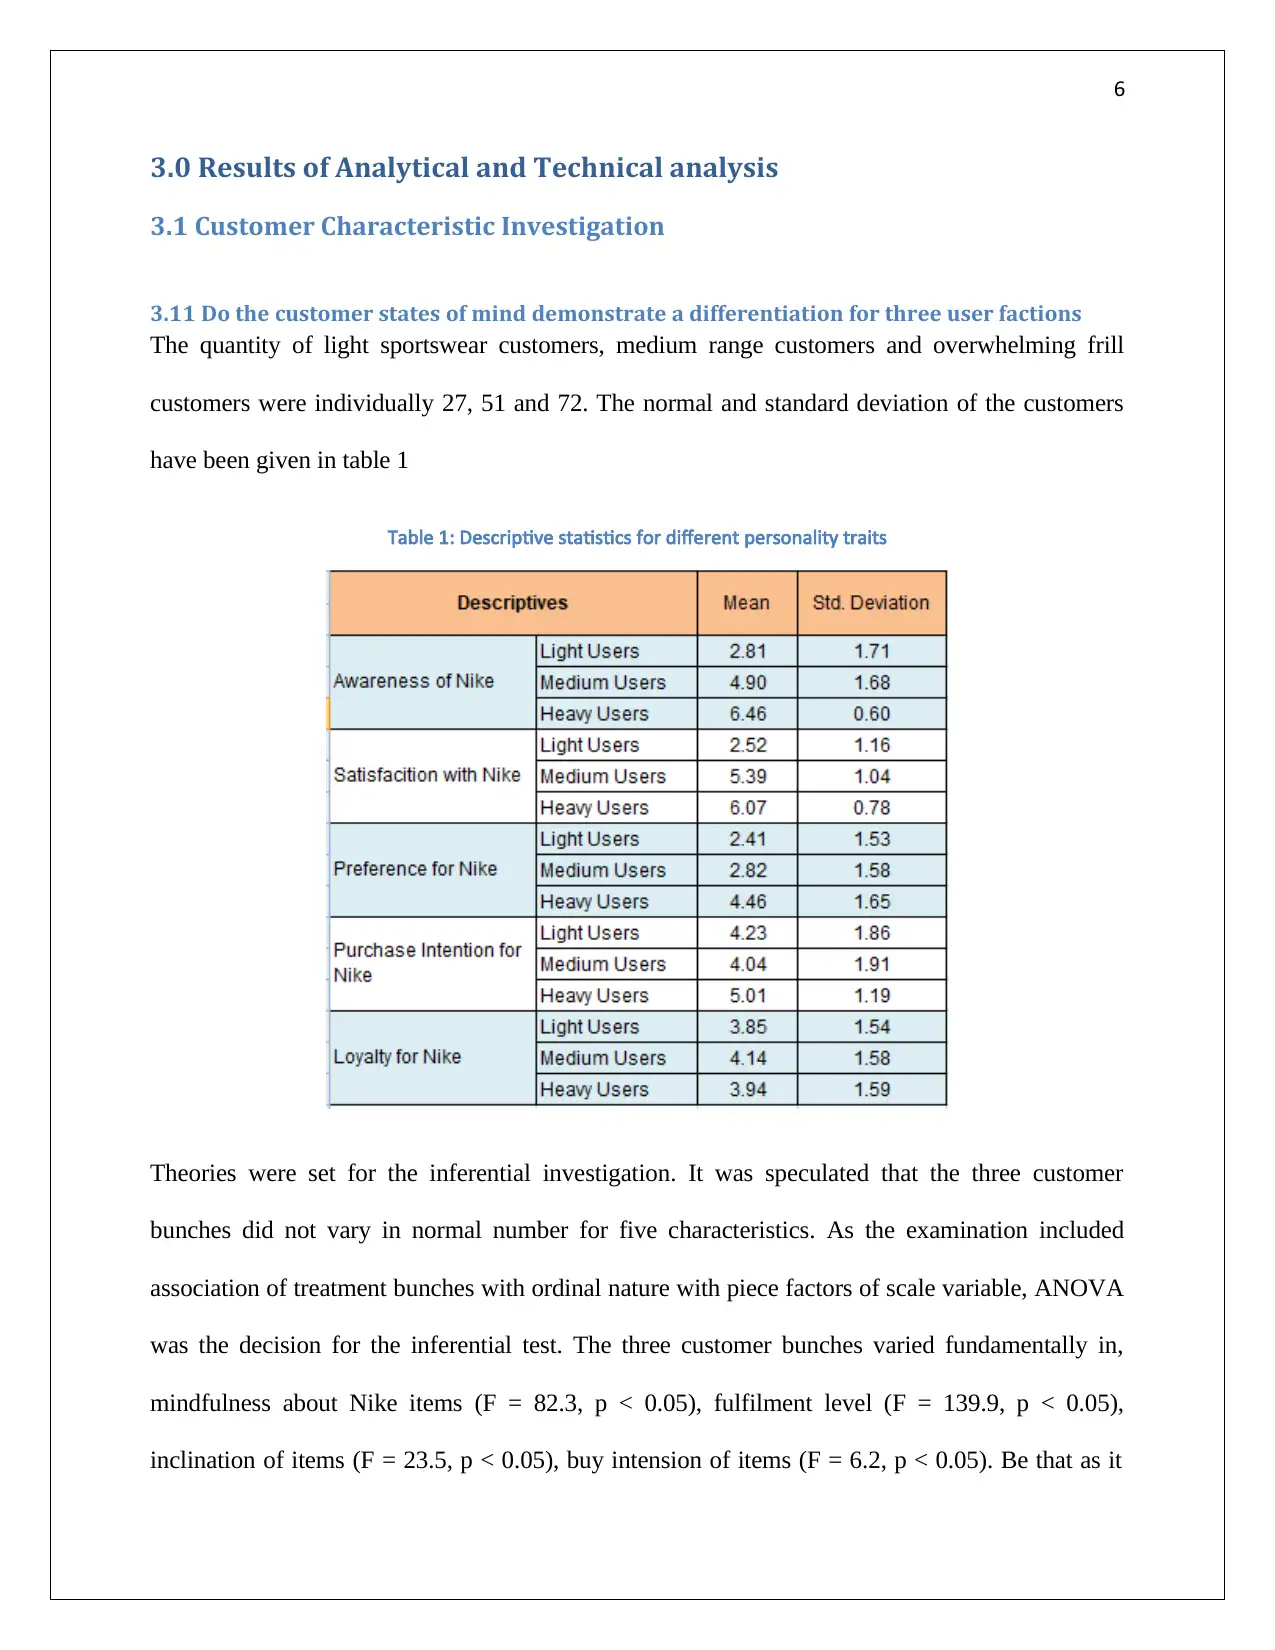
3.11 Do the customer states of mind demonstrate a differentiation for three user factions
The quantity of light sportswear customers, medium range customers and overwhelming frill
customers were individually 27, 51 and 72. The normal and standard deviation of the customers
have been given in table 1
Table 1: Descriptive statistics for different personality traits
Theories were set for the inferential investigation. It was speculated that the three customer
bunches did not vary in normal number for five characteristics. As the examination included
association of treatment bunches with ordinal nature with piece factors of scale variable, ANOVA
was the decision for the inferential test. The three customer bunches varied fundamentally in,
mindfulness about Nike items (F = 82.3, p < 0.05), fulfilment level (F = 139.9, p < 0.05),
inclination of items (F = 23.5, p < 0.05), buy intension of items (F = 6.2, p < 0.05). Be that as it
3.0 Results of Analytical and Technical analysis
3.1 Customer Characteristic Investigation
3.11 Do the customer states of mind demonstrate a differentiation for three user factions
The quantity of light sportswear customers, medium range customers and overwhelming frill
customers were individually 27, 51 and 72. The normal and standard deviation of the customers
have been given in table 1
Table 1: Descriptive statistics for different personality traits
Theories were set for the inferential investigation. It was speculated that the three customer
bunches did not vary in normal number for five characteristics. As the examination included
association of treatment bunches with ordinal nature with piece factors of scale variable, ANOVA
was the decision for the inferential test. The three customer bunches varied fundamentally in,
mindfulness about Nike items (F = 82.3, p < 0.05), fulfilment level (F = 139.9, p < 0.05),
inclination of items (F = 23.5, p < 0.05), buy intension of items (F = 6.2, p < 0.05). Be that as it
⊘ This is a preview!⊘
Do you want full access?
Subscribe today to unlock all pages.
Trusted by 1+ million students worldwide
7
may, with a lovely amazement, the sections were similarly faithful to Nike items (F = 0.4, p >
0.05). Tukey HSD test built up the interrelation of customer sections; they varied essentially (p
esteem < 0.05) in mindfulness and fulfilment scores, however likeness was seen for buy intension,
inclination and unwaveringness for 'Nike' items (Table 3 in Appendix).
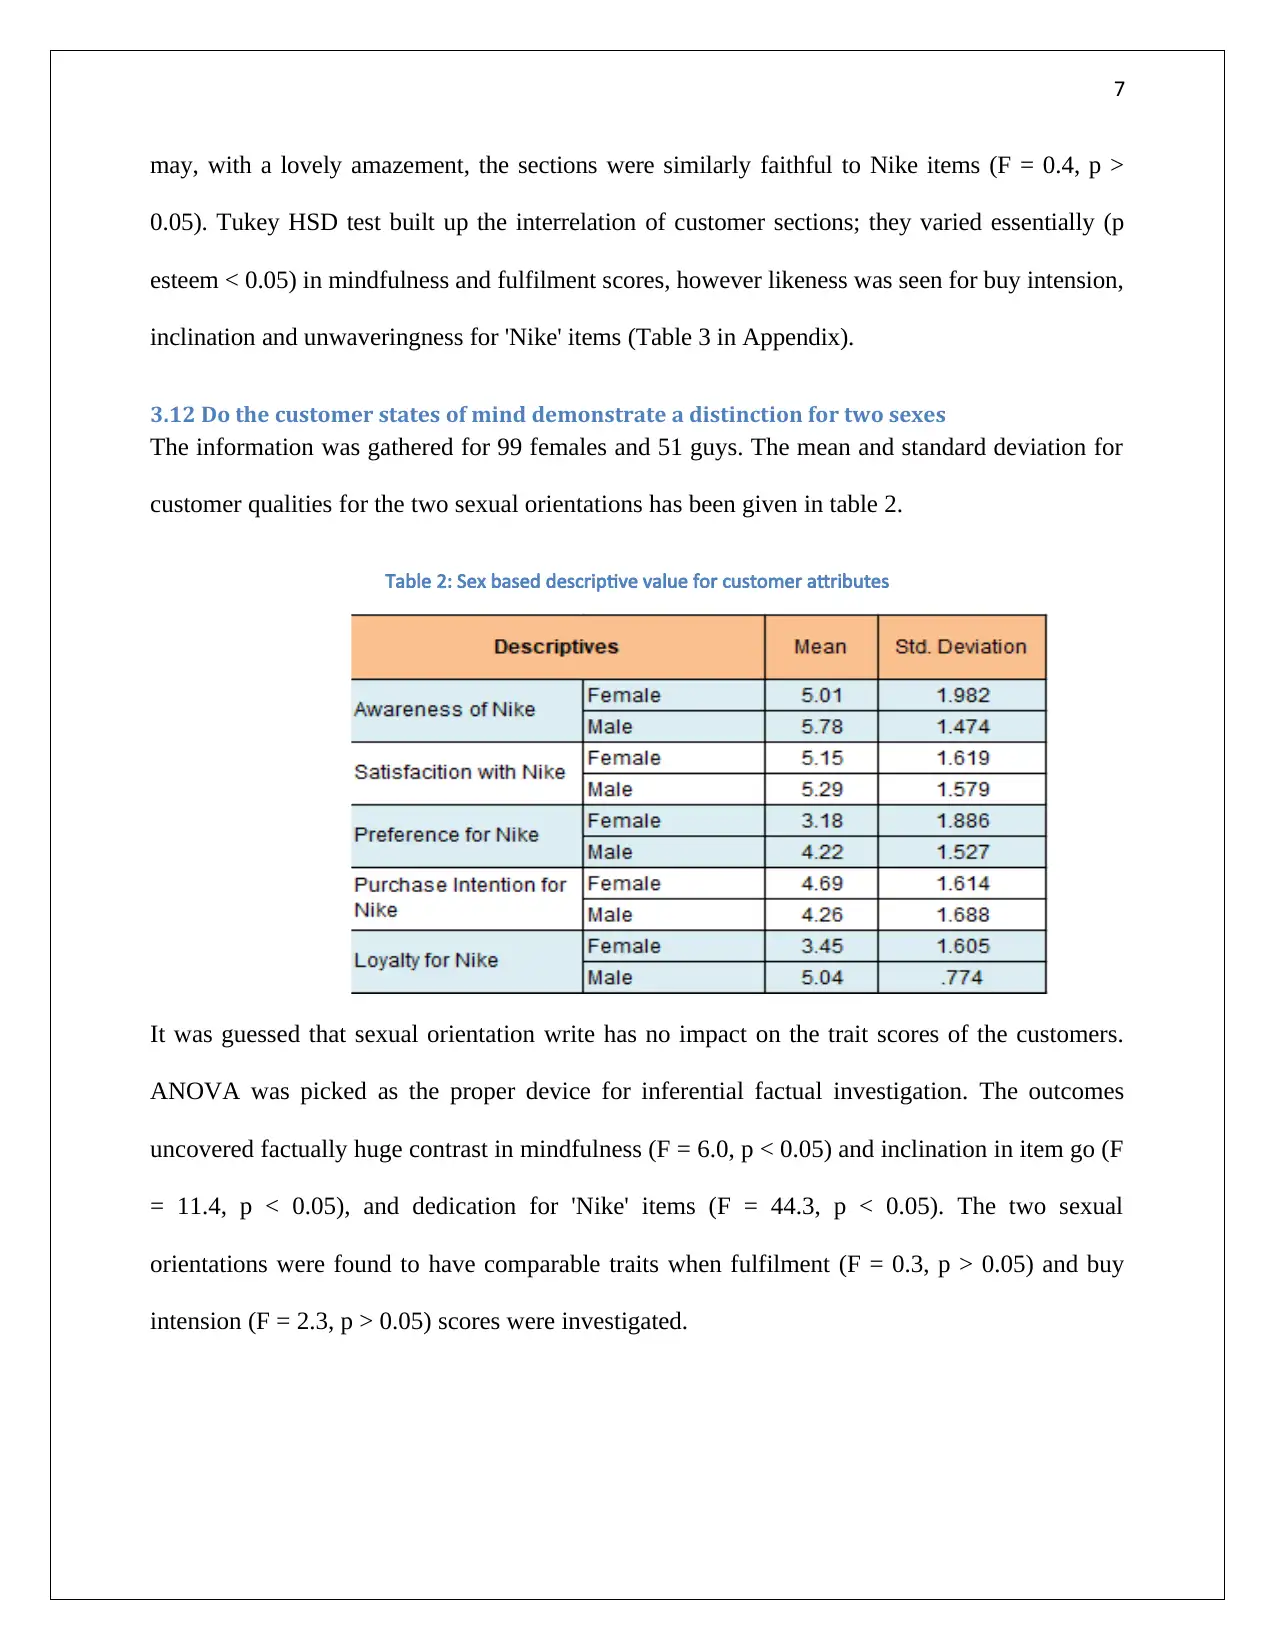
3.12 Do the customer states of mind demonstrate a distinction for two sexes
The information was gathered for 99 females and 51 guys. The mean and standard deviation for
customer qualities for the two sexual orientations has been given in table 2.
Table 2: Sex based descriptive value for customer attributes
It was guessed that sexual orientation write has no impact on the trait scores of the customers.
ANOVA was picked as the proper device for inferential factual investigation. The outcomes
uncovered factually huge contrast in mindfulness (F = 6.0, p < 0.05) and inclination in item go (F
= 11.4, p < 0.05), and dedication for 'Nike' items (F = 44.3, p < 0.05). The two sexual
orientations were found to have comparable traits when fulfilment (F = 0.3, p > 0.05) and buy
intension (F = 2.3, p > 0.05) scores were investigated.
may, with a lovely amazement, the sections were similarly faithful to Nike items (F = 0.4, p >
0.05). Tukey HSD test built up the interrelation of customer sections; they varied essentially (p
esteem < 0.05) in mindfulness and fulfilment scores, however likeness was seen for buy intension,
inclination and unwaveringness for 'Nike' items (Table 3 in Appendix).
3.12 Do the customer states of mind demonstrate a distinction for two sexes
The information was gathered for 99 females and 51 guys. The mean and standard deviation for
customer qualities for the two sexual orientations has been given in table 2.
Table 2: Sex based descriptive value for customer attributes
It was guessed that sexual orientation write has no impact on the trait scores of the customers.
ANOVA was picked as the proper device for inferential factual investigation. The outcomes
uncovered factually huge contrast in mindfulness (F = 6.0, p < 0.05) and inclination in item go (F
= 11.4, p < 0.05), and dedication for 'Nike' items (F = 44.3, p < 0.05). The two sexual
orientations were found to have comparable traits when fulfilment (F = 0.3, p > 0.05) and buy
intension (F = 2.3, p > 0.05) scores were investigated.
Paraphrase This Document
Need a fresh take? Get an instant paraphrase of this document with our AI Paraphraser
8
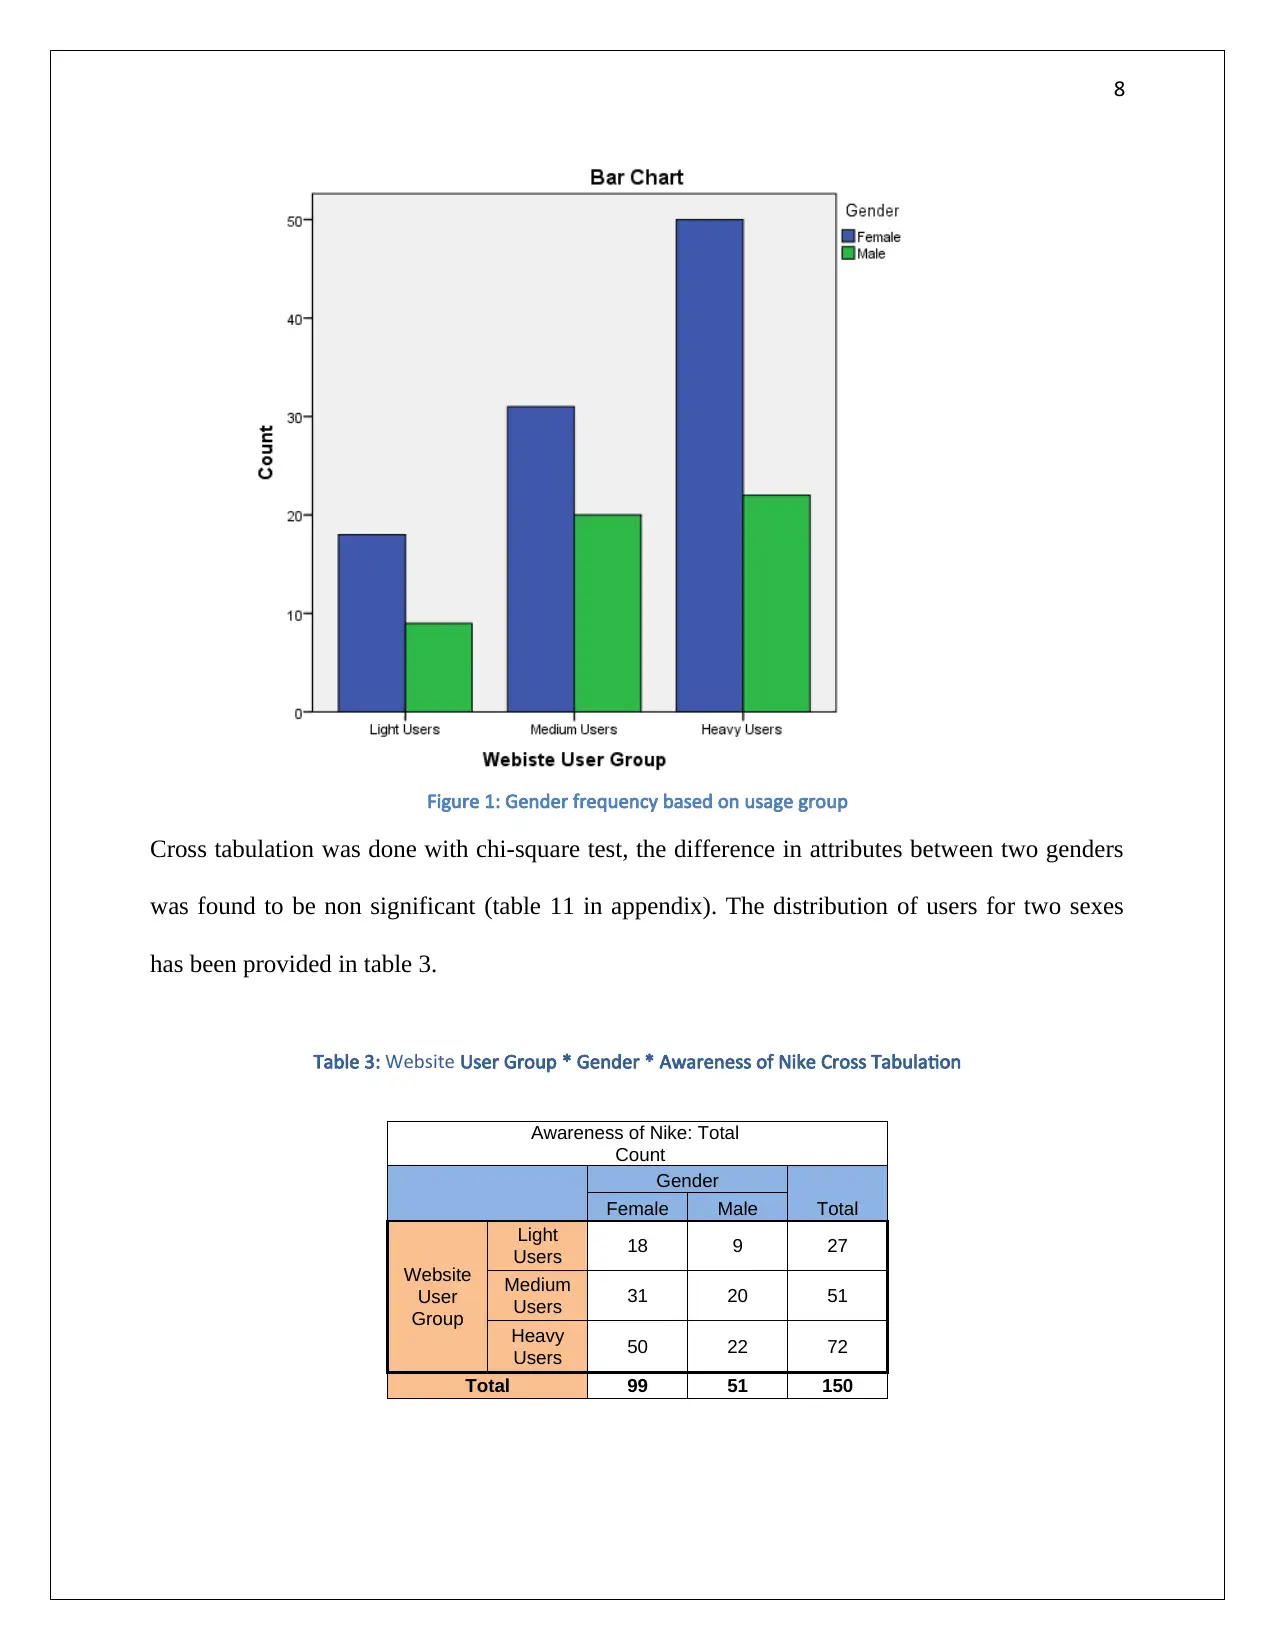
Figure 1: Gender frequency based on usage group
Cross tabulation was done with chi-square test, the difference in attributes between two genders
was found to be non significant (table 11 in appendix). The distribution of users for two sexes
has been provided in table 3.
Table 3: Website User Group * Gender * Awareness of Nike Cross Tabulation
Awareness of Nike: Total
Count
Gender
TotalFemale Male
Website
User
Group
Light
Users 18 9 27
Medium
Users 31 20 51
Heavy
Users 50 22 72
Total 99 51 150
9
3.2 Profit and COGS Analysis
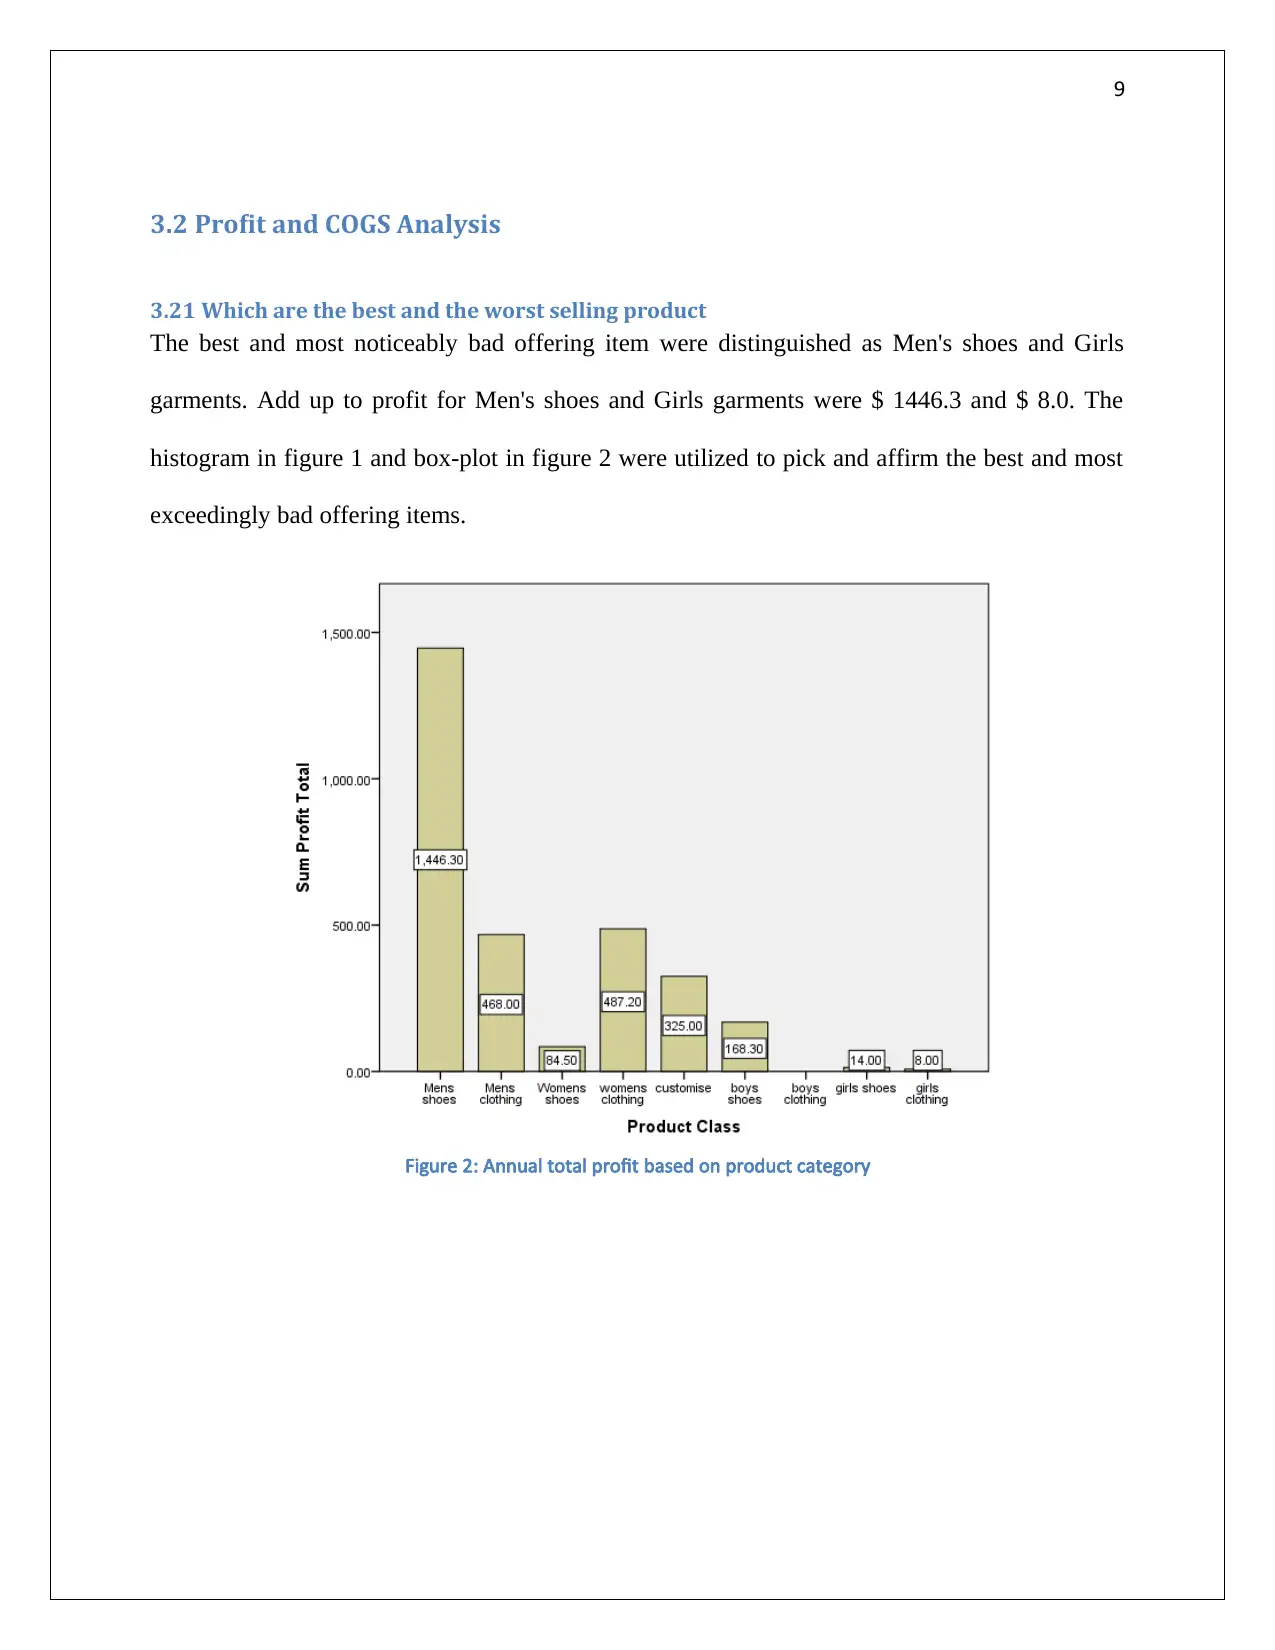
3.21 Which are the best and the worst selling product
The best and most noticeably bad offering item were distinguished as Men's shoes and Girls
garments. Add up to profit for Men's shoes and Girls garments were $ 1446.3 and $ 8.0. The
histogram in figure 1 and box-plot in figure 2 were utilized to pick and affirm the best and most
exceedingly bad offering items.
Figure 2: Annual total profit based on product category
3.2 Profit and COGS Analysis
3.21 Which are the best and the worst selling product
The best and most noticeably bad offering item were distinguished as Men's shoes and Girls
garments. Add up to profit for Men's shoes and Girls garments were $ 1446.3 and $ 8.0. The
histogram in figure 1 and box-plot in figure 2 were utilized to pick and affirm the best and most
exceedingly bad offering items.
Figure 2: Annual total profit based on product category
⊘ This is a preview!⊘
Do you want full access?
Subscribe today to unlock all pages.
Trusted by 1+ million students worldwide
10
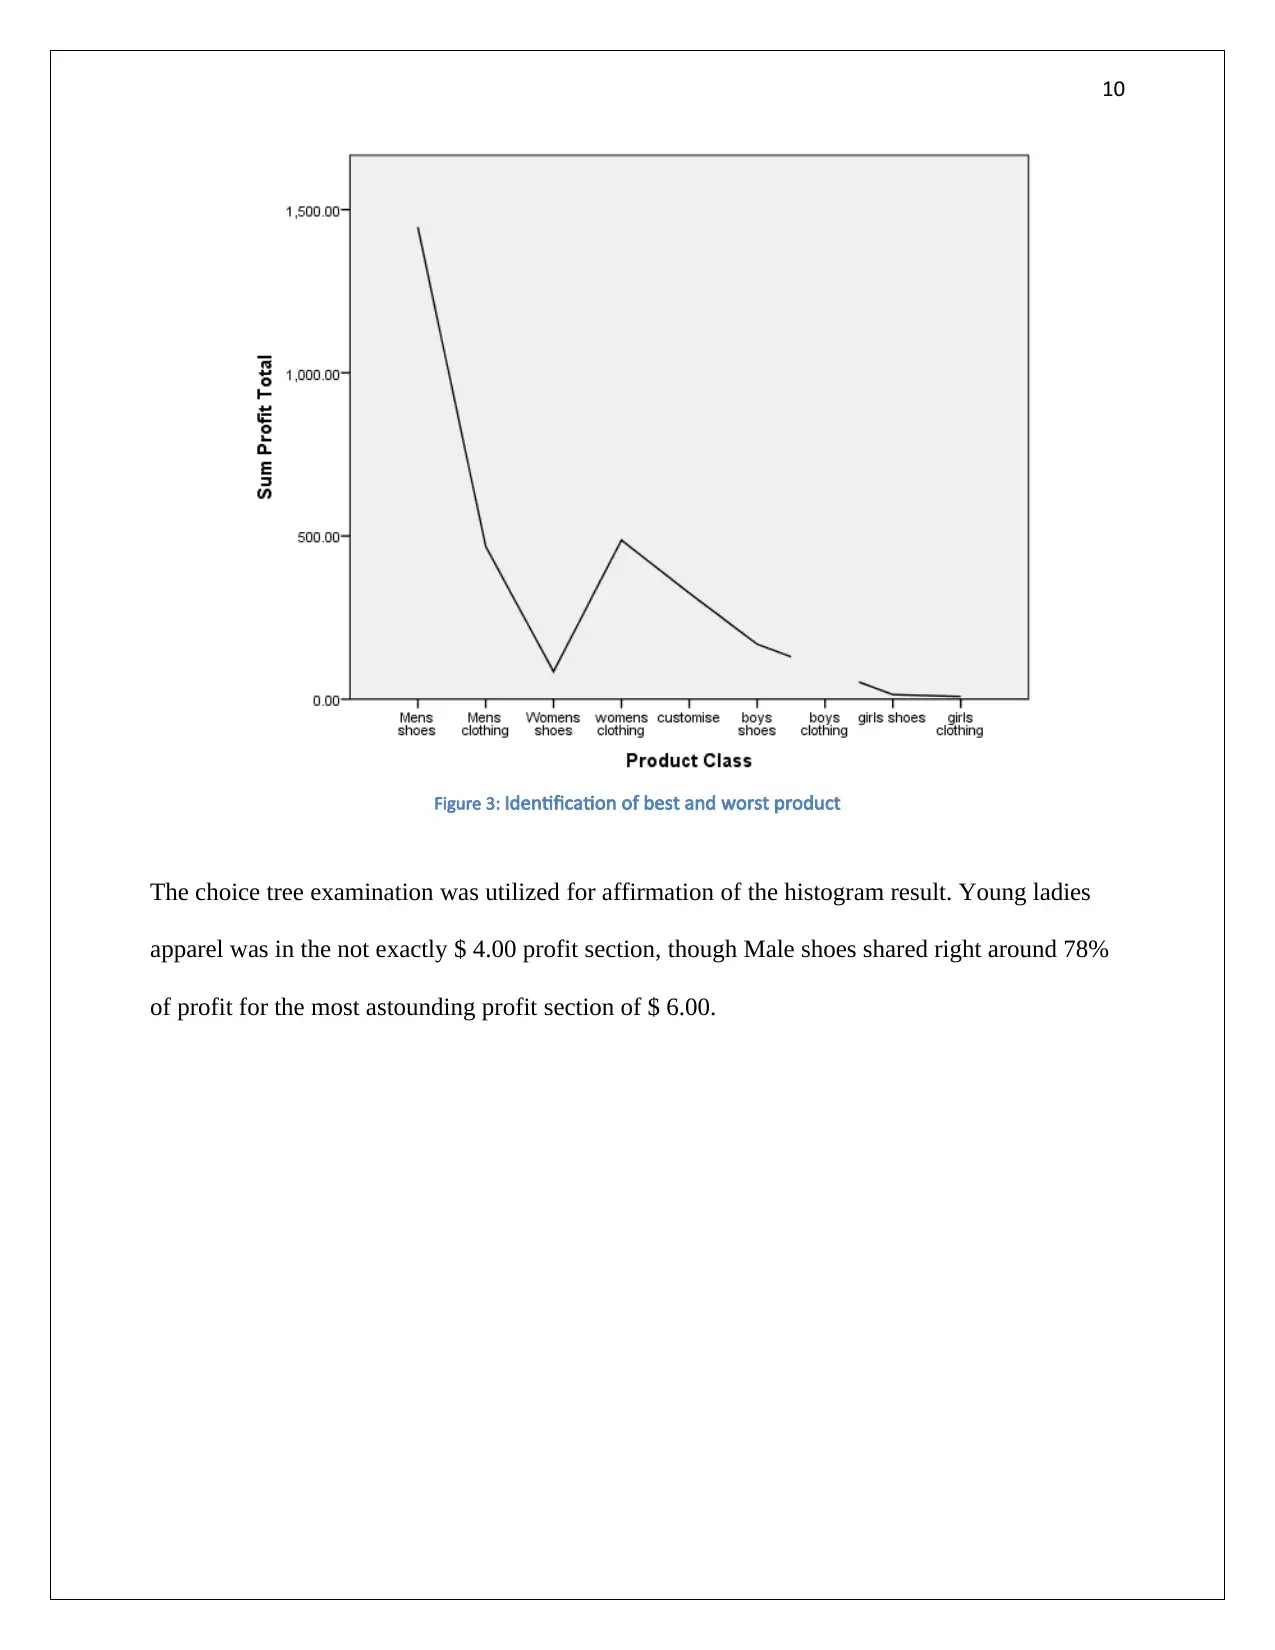
Figure 3: Identification of best and worst product
The choice tree examination was utilized for affirmation of the histogram result. Young ladies
apparel was in the not exactly $ 4.00 profit section, though Male shoes shared right around 78%
of profit for the most astounding profit section of $ 6.00.
Paraphrase This Document
Need a fresh take? Get an instant paraphrase of this document with our AI Paraphraser
11
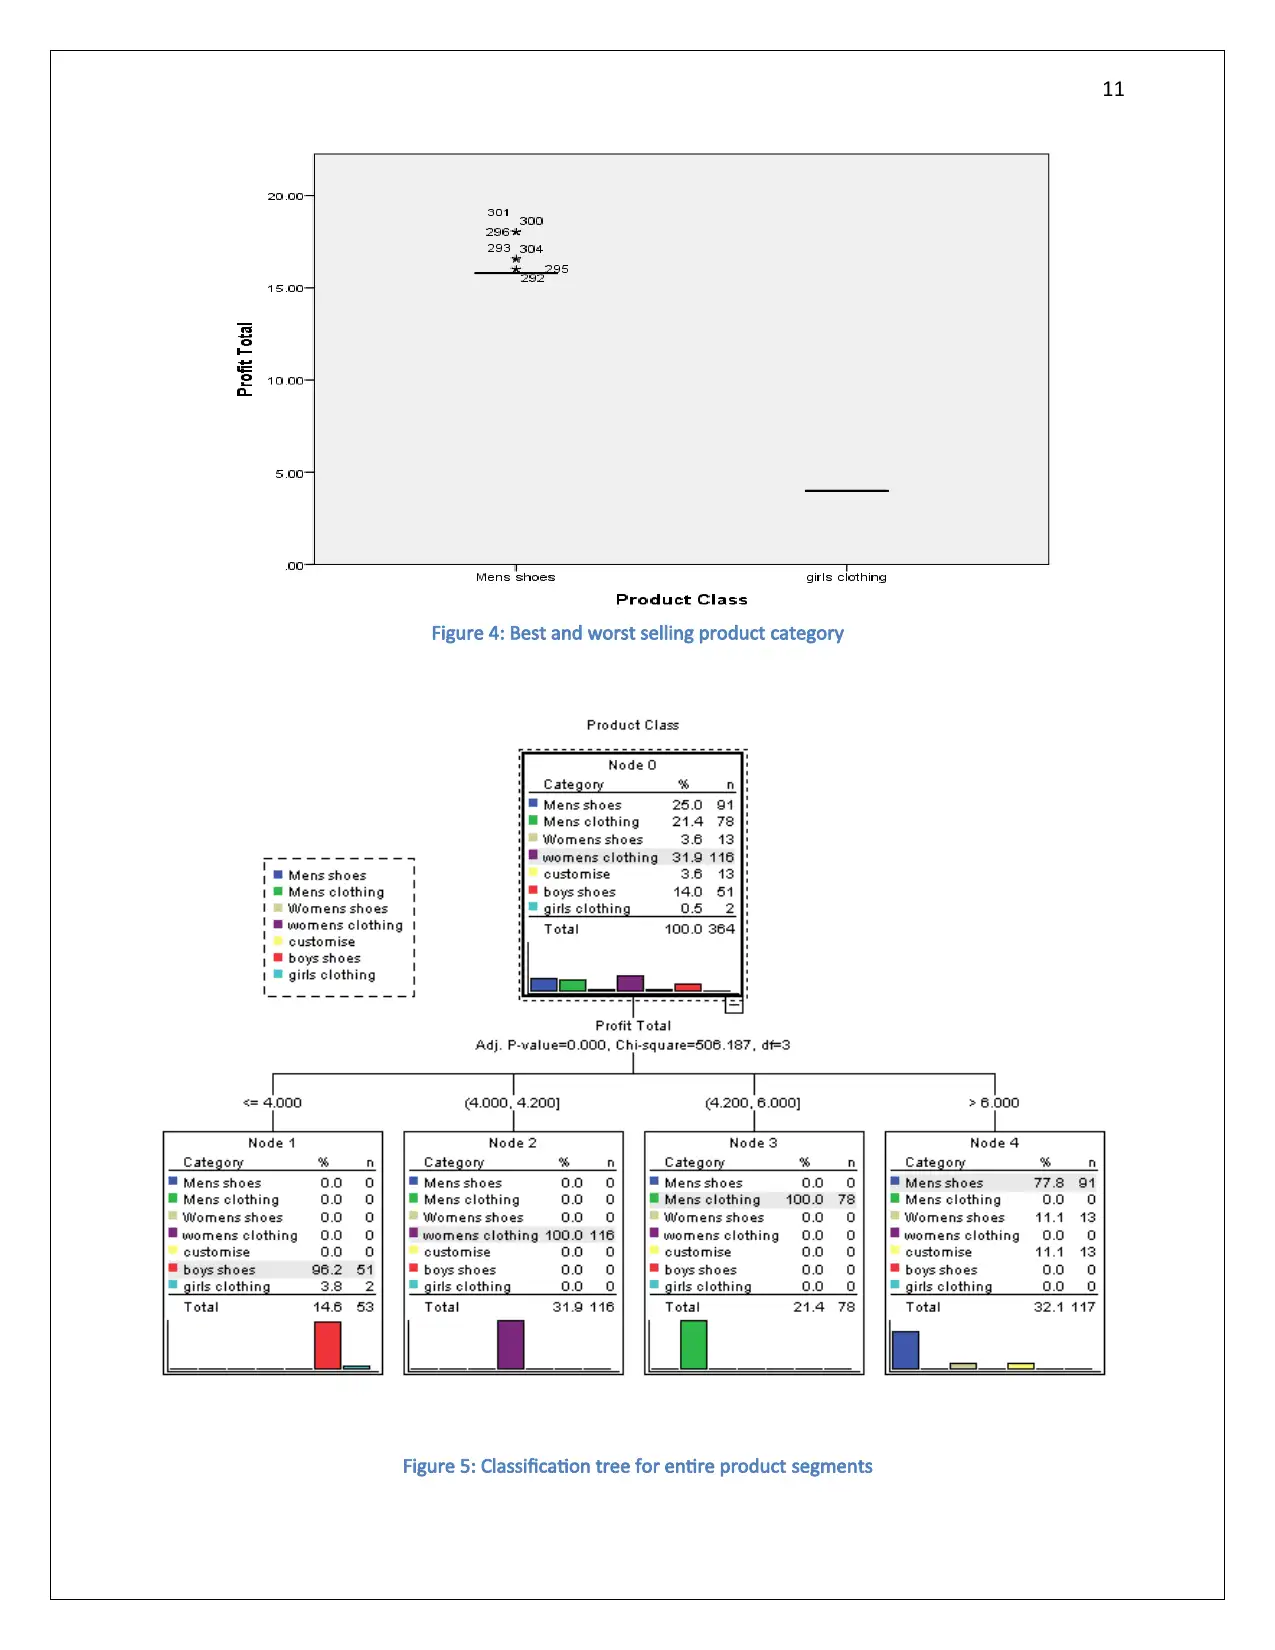
Figure 4: Best and worst selling product category
Figure 5: Classification tree for entire product segments
Figure 4: Best and worst selling product category
Figure 5: Classification tree for entire product segments
12
The invalid speculation was developed with accepting equivalent profit for all the item goes. The
cooperation amongst ordinal and scale factors was cross checked by ANOVA and there was
measurably critical (F = 43106.4, P < 0.05) contrast in the product offerings. The ANOVA
between the best and most exceedingly bad offering items uncovered (F = 1686.6, p < 0.05)
noteworthy distinction in total profit. The invalid theory was rejected in light of the outcomes.
The Chi-square test for the classification tree ( χ2=506 .2 , p < 0.05) finished the inferential
examination for measurably huge distinction in the profit add up to for various level of profits.
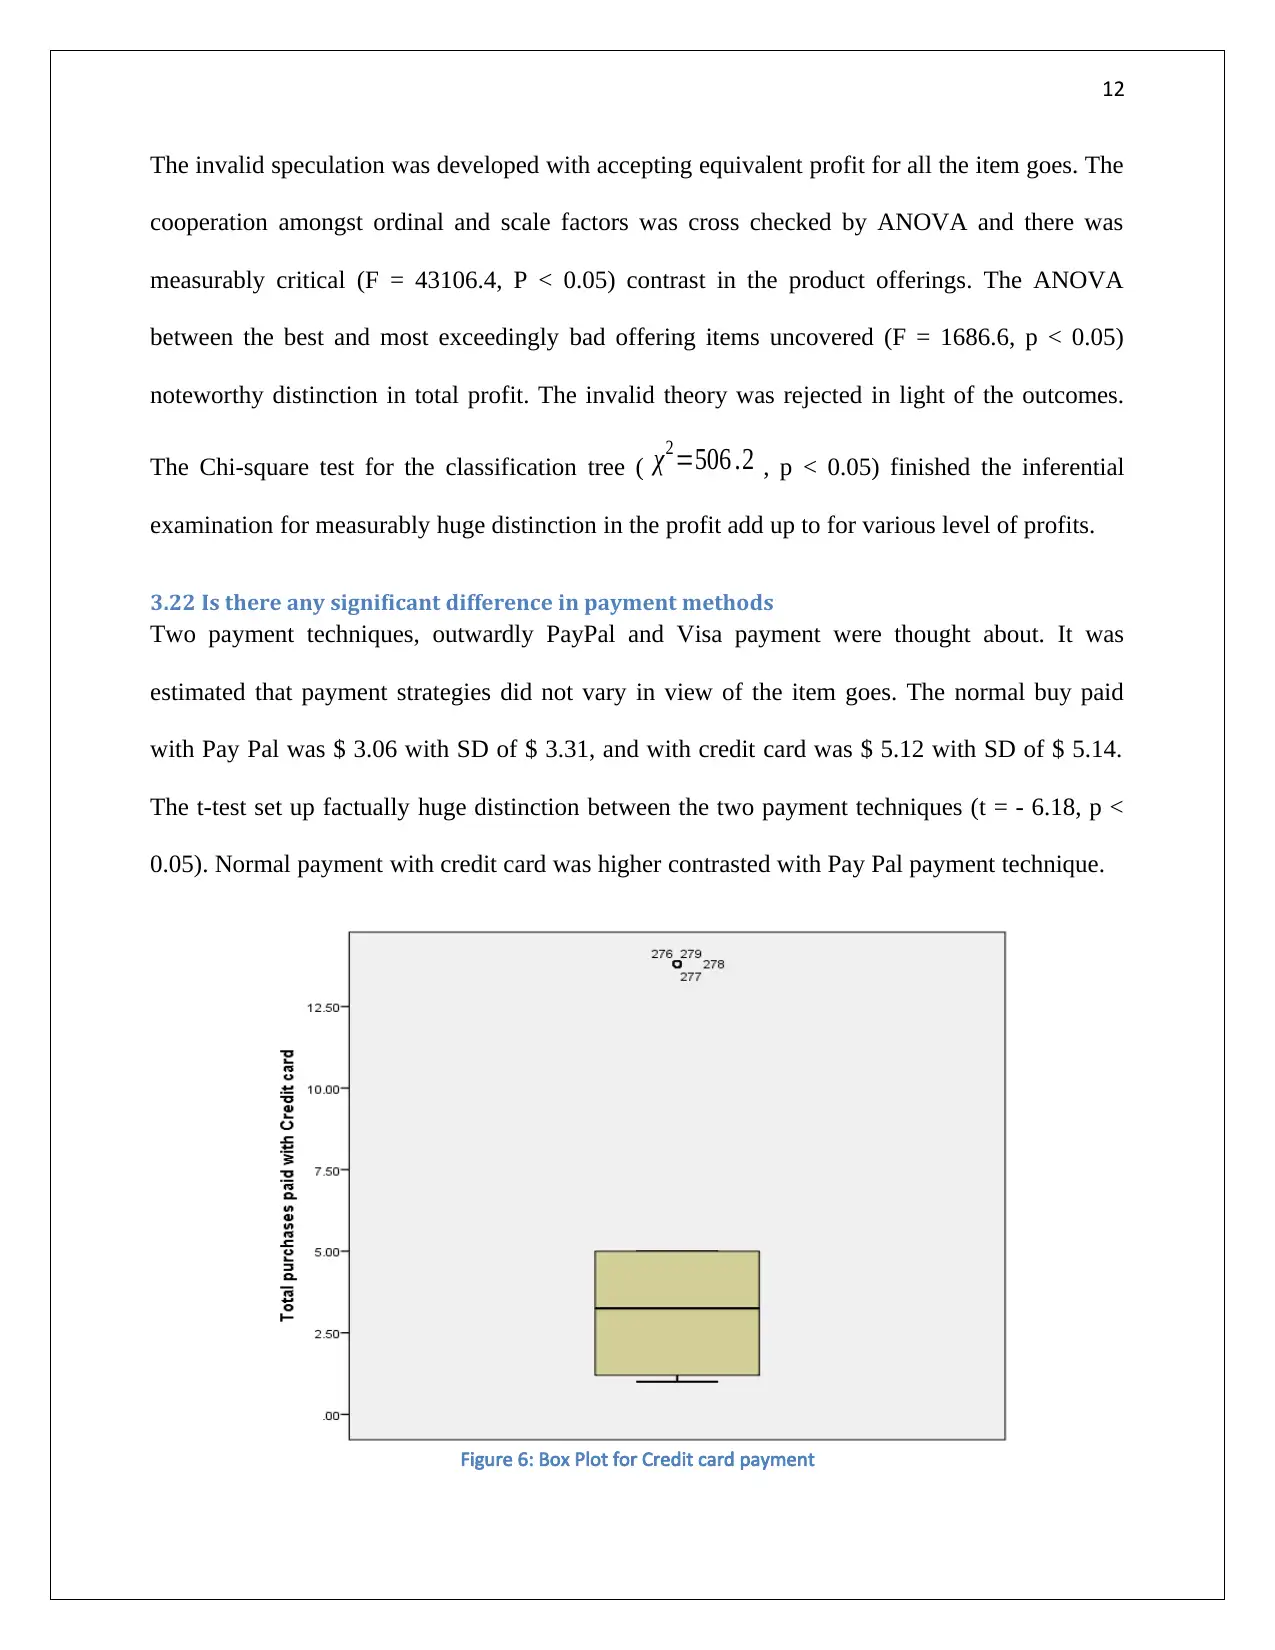
3.22 Is there any significant difference in payment methods
Two payment techniques, outwardly PayPal and Visa payment were thought about. It was
estimated that payment strategies did not vary in view of the item goes. The normal buy paid
with Pay Pal was $ 3.06 with SD of $ 3.31, and with credit card was $ 5.12 with SD of $ 5.14.
The t-test set up factually huge distinction between the two payment techniques (t = - 6.18, p <
0.05). Normal payment with credit card was higher contrasted with Pay Pal payment technique.
Figure 6: Box Plot for Credit card payment
The invalid speculation was developed with accepting equivalent profit for all the item goes. The
cooperation amongst ordinal and scale factors was cross checked by ANOVA and there was
measurably critical (F = 43106.4, P < 0.05) contrast in the product offerings. The ANOVA
between the best and most exceedingly bad offering items uncovered (F = 1686.6, p < 0.05)
noteworthy distinction in total profit. The invalid theory was rejected in light of the outcomes.
The Chi-square test for the classification tree ( χ2=506 .2 , p < 0.05) finished the inferential
examination for measurably huge distinction in the profit add up to for various level of profits.
3.22 Is there any significant difference in payment methods
Two payment techniques, outwardly PayPal and Visa payment were thought about. It was
estimated that payment strategies did not vary in view of the item goes. The normal buy paid
with Pay Pal was $ 3.06 with SD of $ 3.31, and with credit card was $ 5.12 with SD of $ 5.14.
The t-test set up factually huge distinction between the two payment techniques (t = - 6.18, p <
0.05). Normal payment with credit card was higher contrasted with Pay Pal payment technique.
Figure 6: Box Plot for Credit card payment
⊘ This is a preview!⊘
Do you want full access?
Subscribe today to unlock all pages.
Trusted by 1+ million students worldwide
1 out of 29
Related Documents


Your All-in-One AI-Powered Toolkit for Academic Success.
+13062052269
info@desklib.com
Available 24*7 on WhatsApp / Email
![[object Object]](/_next/static/media/star-bottom.7253800d.svg)
Unlock your academic potential
Copyright © 2020–2026 A2Z Services. All Rights Reserved. Developed and managed by ZUCOL.