BCO115 Financial Markets: Nike Stock Price Trend Analysis Report
VerifiedAdded on 2022/08/20
|15
|2940
|30
Report
AI Summary
This report provides a comprehensive analysis of Nike Inc.'s stock performance, focusing on trends observed over the last four months, with a more detailed examination of the preceding three weeks. The analysis includes graphical representations of stock price fluctuations, explanations of the observed trends, and their relation to relevant contextual information. The report begins with an executive memo summarizing the findings, followed by a detailed exploration of the stock's historical performance, including its initial public offering and subsequent stock splits. The core of the analysis involves examining the stock's behavior from December 2019 to March 2020, with a particular emphasis on the decline in share price and its potential causes, such as sales reports and broader market conditions. The report also provides a long-term perspective by assessing the stock's performance over the last year and the past decade, highlighting the impact of the company's financial performance on its stock price. The report concludes with an income statement analysis to support the growth in share prices. The report is a response to an assignment brief that required an analysis of a publicly traded stock, including a presentation and an executive memo of the findings.
Running head: FINANCIAL MARKETS AND INSTITUTES
Financial Markets and Institutes
Name of the Student:
Name of the University:
Authors Note:
Financial Markets and Institutes
Name of the Student:
Name of the University:
Authors Note:
Paraphrase This Document
Need a fresh take? Get an instant paraphrase of this document with our AI Paraphraser

1
Contents
Executive Memo:.............................................................................................................................2
References:....................................................................................................................................13
Contents
Executive Memo:.............................................................................................................................2
References:....................................................................................................................................13
2
Executive Memo:
Nike Inc. is the largest supplier of athletic shoes and sporting apparel in all across the globe. It is
also involved in designing and marketing of footwear and apparel in all over the world. With
more than 50000 employees employed in all across the globe, Nike is easily one of the largest
company in the world. In fact by the end of 2014 the brand of Nike alone valued at $19 billion to
be one of the most valuable sporting brand in the entire sporting business across the globe.
Though the company was formed and created in 1971 but it waited for 9 years since then before
going to the public with its initial public offering (IPO) was made in 1980.
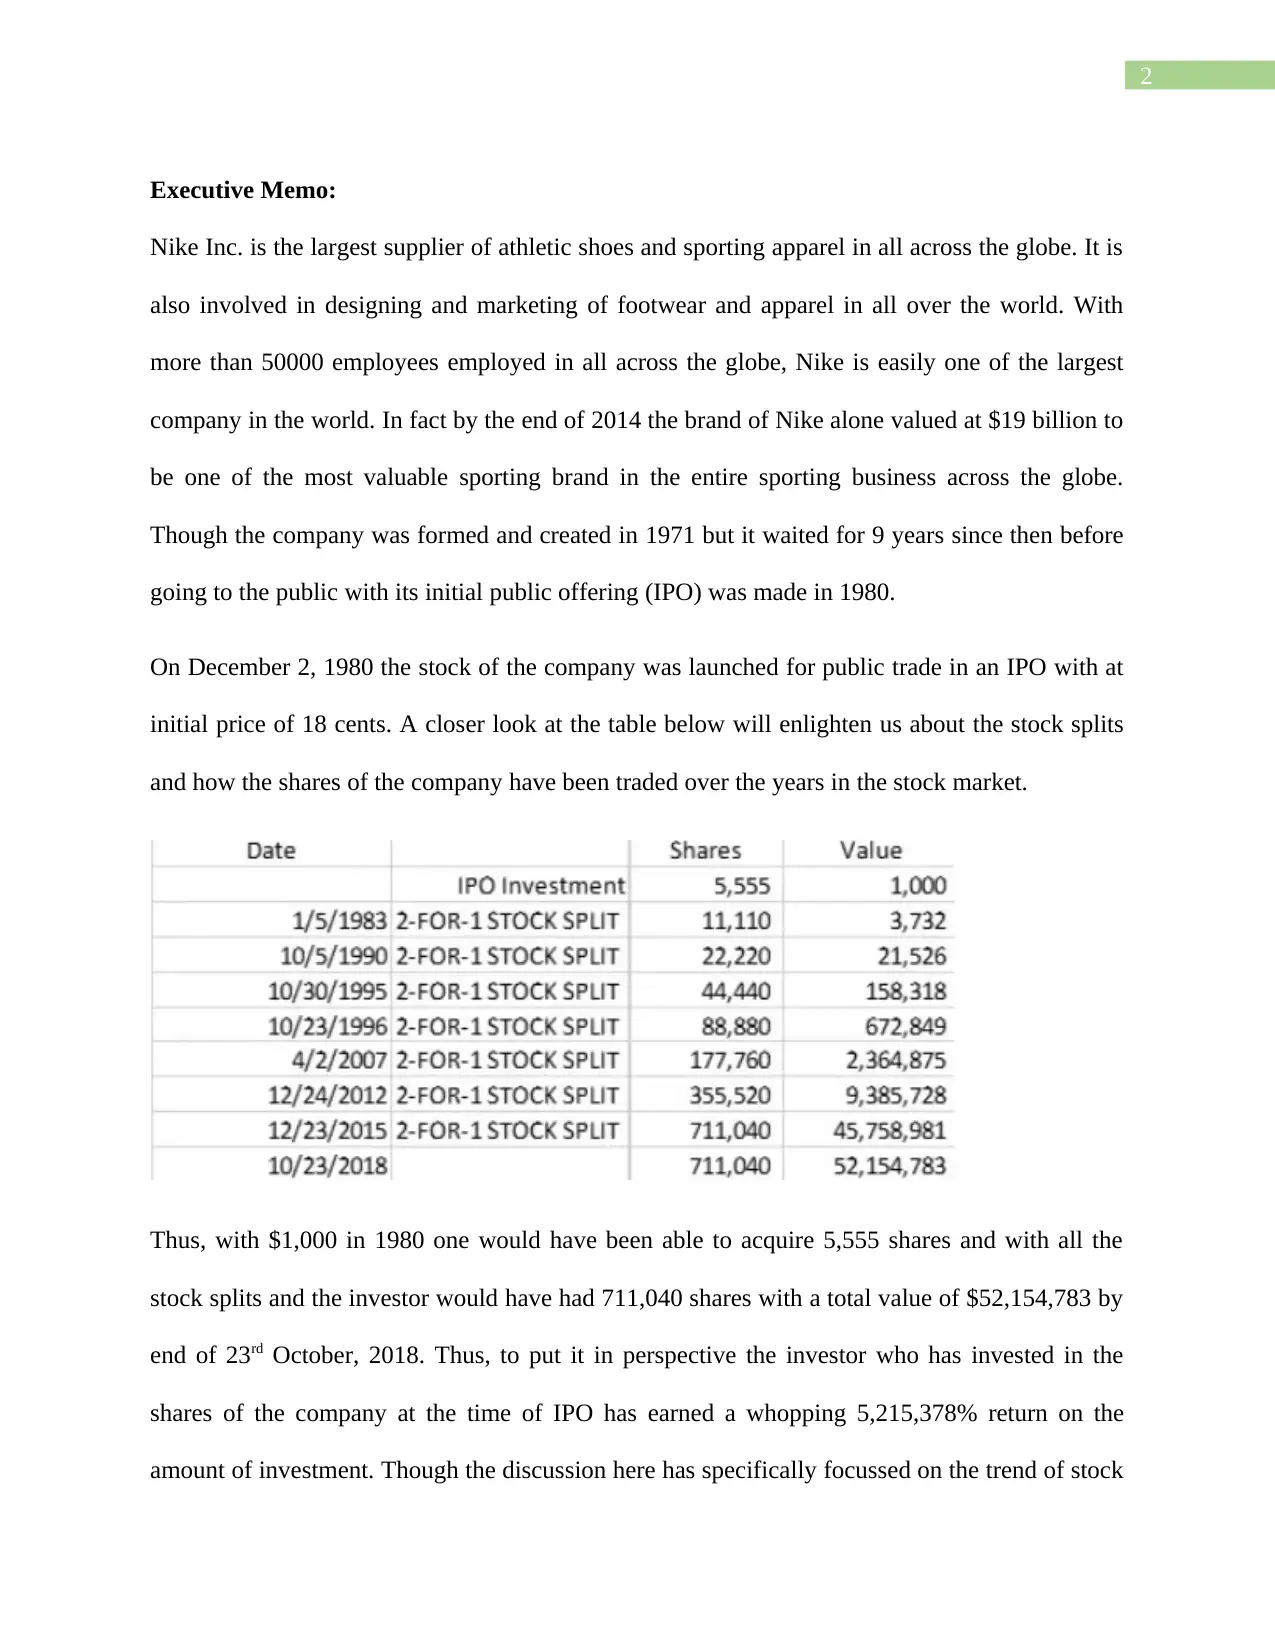
On December 2, 1980 the stock of the company was launched for public trade in an IPO with at
initial price of 18 cents. A closer look at the table below will enlighten us about the stock splits
and how the shares of the company have been traded over the years in the stock market.
Thus, with $1,000 in 1980 one would have been able to acquire 5,555 shares and with all the
stock splits and the investor would have had 711,040 shares with a total value of $52,154,783 by
end of 23rd October, 2018. Thus, to put it in perspective the investor who has invested in the
shares of the company at the time of IPO has earned a whopping 5,215,378% return on the
amount of investment. Though the discussion here has specifically focussed on the trend of stock
Executive Memo:
Nike Inc. is the largest supplier of athletic shoes and sporting apparel in all across the globe. It is
also involved in designing and marketing of footwear and apparel in all over the world. With
more than 50000 employees employed in all across the globe, Nike is easily one of the largest
company in the world. In fact by the end of 2014 the brand of Nike alone valued at $19 billion to
be one of the most valuable sporting brand in the entire sporting business across the globe.
Though the company was formed and created in 1971 but it waited for 9 years since then before
going to the public with its initial public offering (IPO) was made in 1980.
On December 2, 1980 the stock of the company was launched for public trade in an IPO with at
initial price of 18 cents. A closer look at the table below will enlighten us about the stock splits
and how the shares of the company have been traded over the years in the stock market.
Thus, with $1,000 in 1980 one would have been able to acquire 5,555 shares and with all the
stock splits and the investor would have had 711,040 shares with a total value of $52,154,783 by
end of 23rd October, 2018. Thus, to put it in perspective the investor who has invested in the
shares of the company at the time of IPO has earned a whopping 5,215,378% return on the
amount of investment. Though the discussion here has specifically focussed on the trend of stock
⊘ This is a preview!⊘
Do you want full access?
Subscribe today to unlock all pages.
Trusted by 1+ million students worldwide
3
prices during last four months and more specifically in last three weeks but in order to
understand the trend of the stock over the years it is important to take a closer look at the
changes in the stock price over the years, i.e. from the date of IPO till the present day.
Explanation of findings based on the presentation:
Nike Inc. stock trend over the last four months:
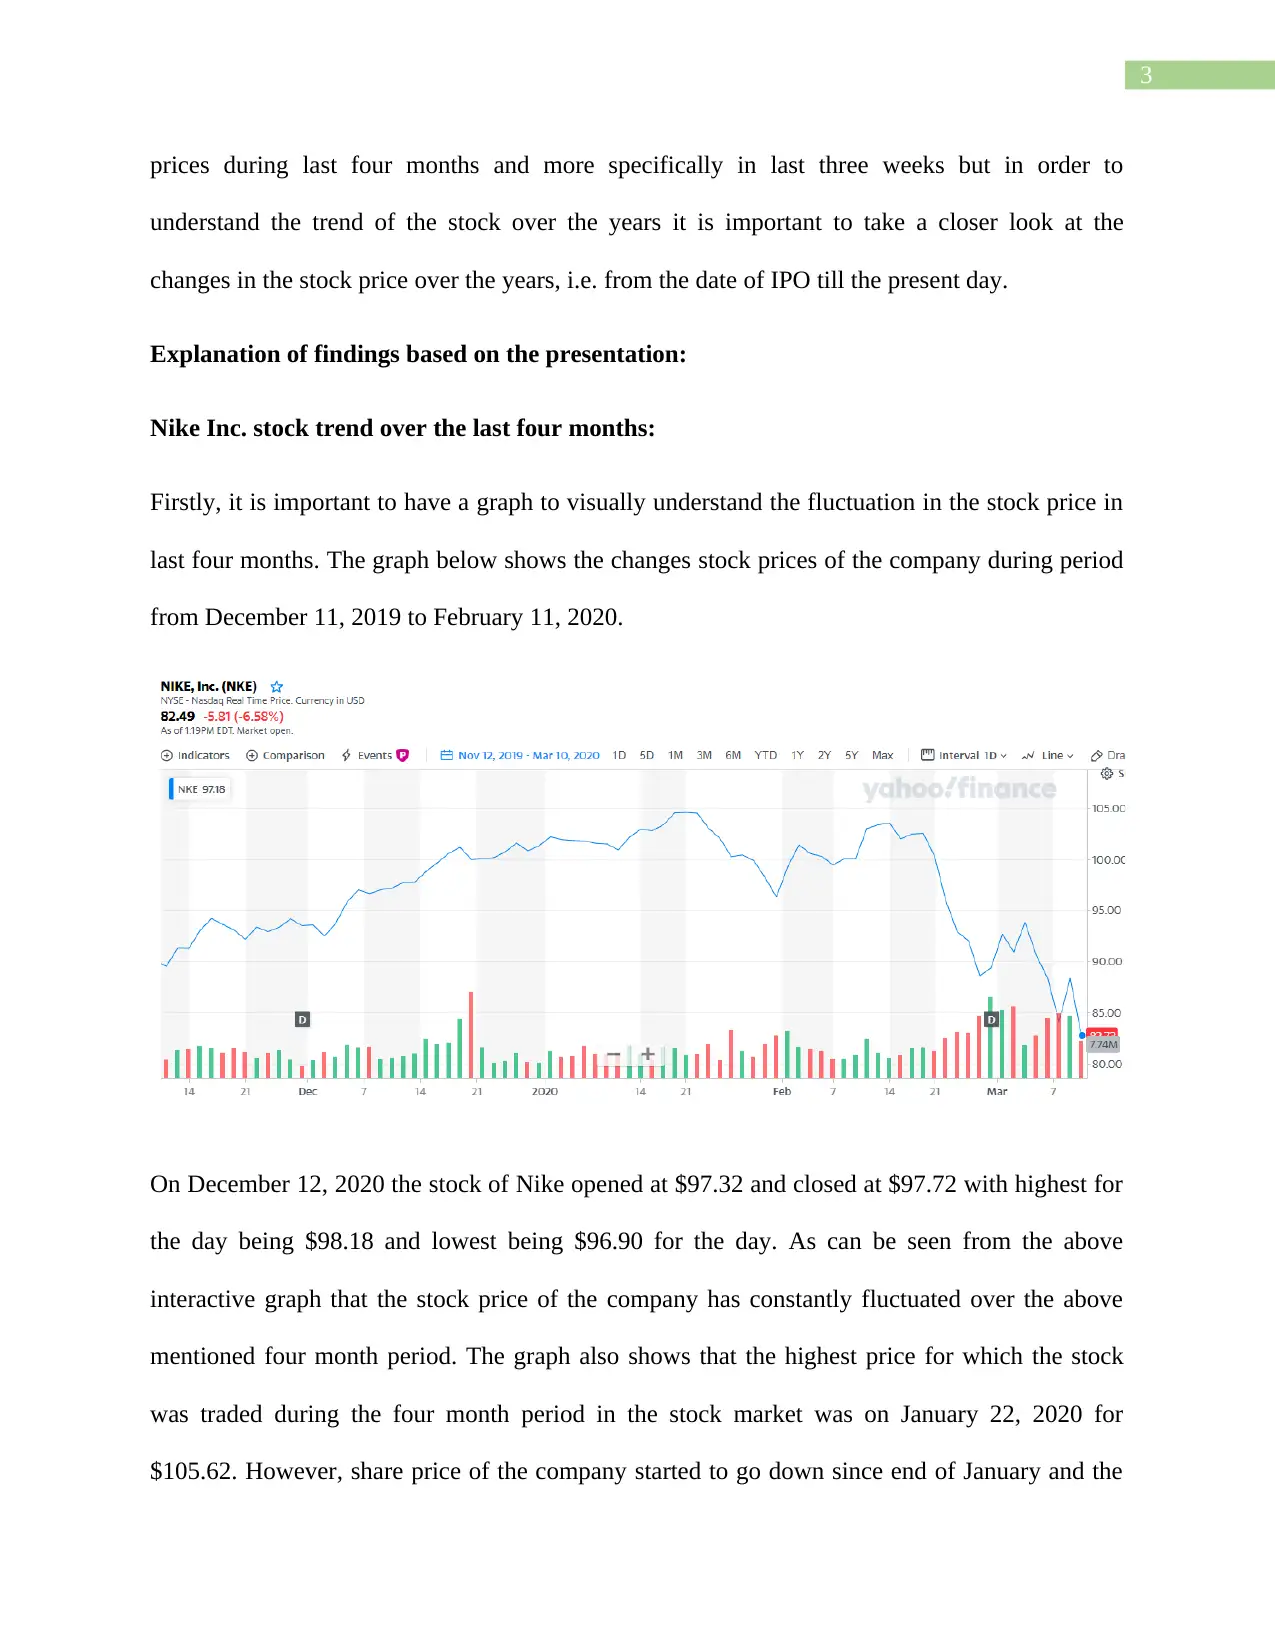
Firstly, it is important to have a graph to visually understand the fluctuation in the stock price in
last four months. The graph below shows the changes stock prices of the company during period
from December 11, 2019 to February 11, 2020.
On December 12, 2020 the stock of Nike opened at $97.32 and closed at $97.72 with highest for
the day being $98.18 and lowest being $96.90 for the day. As can be seen from the above
interactive graph that the stock price of the company has constantly fluctuated over the above
mentioned four month period. The graph also shows that the highest price for which the stock
was traded during the four month period in the stock market was on January 22, 2020 for
$105.62. However, share price of the company started to go down since end of January and the
prices during last four months and more specifically in last three weeks but in order to
understand the trend of the stock over the years it is important to take a closer look at the
changes in the stock price over the years, i.e. from the date of IPO till the present day.
Explanation of findings based on the presentation:
Nike Inc. stock trend over the last four months:
Firstly, it is important to have a graph to visually understand the fluctuation in the stock price in
last four months. The graph below shows the changes stock prices of the company during period
from December 11, 2019 to February 11, 2020.
On December 12, 2020 the stock of Nike opened at $97.32 and closed at $97.72 with highest for
the day being $98.18 and lowest being $96.90 for the day. As can be seen from the above
interactive graph that the stock price of the company has constantly fluctuated over the above
mentioned four month period. The graph also shows that the highest price for which the stock
was traded during the four month period in the stock market was on January 22, 2020 for
$105.62. However, share price of the company started to go down since end of January and the
Paraphrase This Document
Need a fresh take? Get an instant paraphrase of this document with our AI Paraphraser
4
decline has not stopped yet. Though the company experience the highest price of the share in
recent months on January 22, 2020 with $105.62 per share the share price stumbled to as low as
$95.92 on the very last day of January, 2020. However, as can be seen from the trend line that
the decline in the share price at the end of January was just a beginning as the share price
continued to drop to experience its lowest in recent months with $83.62 on March 12, 2020. In
fact the last four months period can be strategically divided into two halves, i.e. the first half and
second half. The first half is the period from December 12, 2019 to January 22, 2020 and the
second half is from January 23, 2020 to March 12, 2020. As can be seen from the above graph
that in the first half of the last four months the stock price of the company showed an upward
trend with the stock closing at its highest during the entire period of four months at $104.53 on
January 22, 2020. The second half of the above four months saw constant decline in the share
price of the company with the share price declined to as low as $83.62. The reason for dividing
the four months period into two separate periods is to understand the reason for upward and
downward trend in share prices during these two periods. As can be seen that subsequent to 22nd
January, 2020 Nike stock price has started declined in the market and it would not be incorrect to
state that the declining trend is yet not over as the share price currently stood at one of the lowest
in recent months with $82.63 as on March 12, 2020.
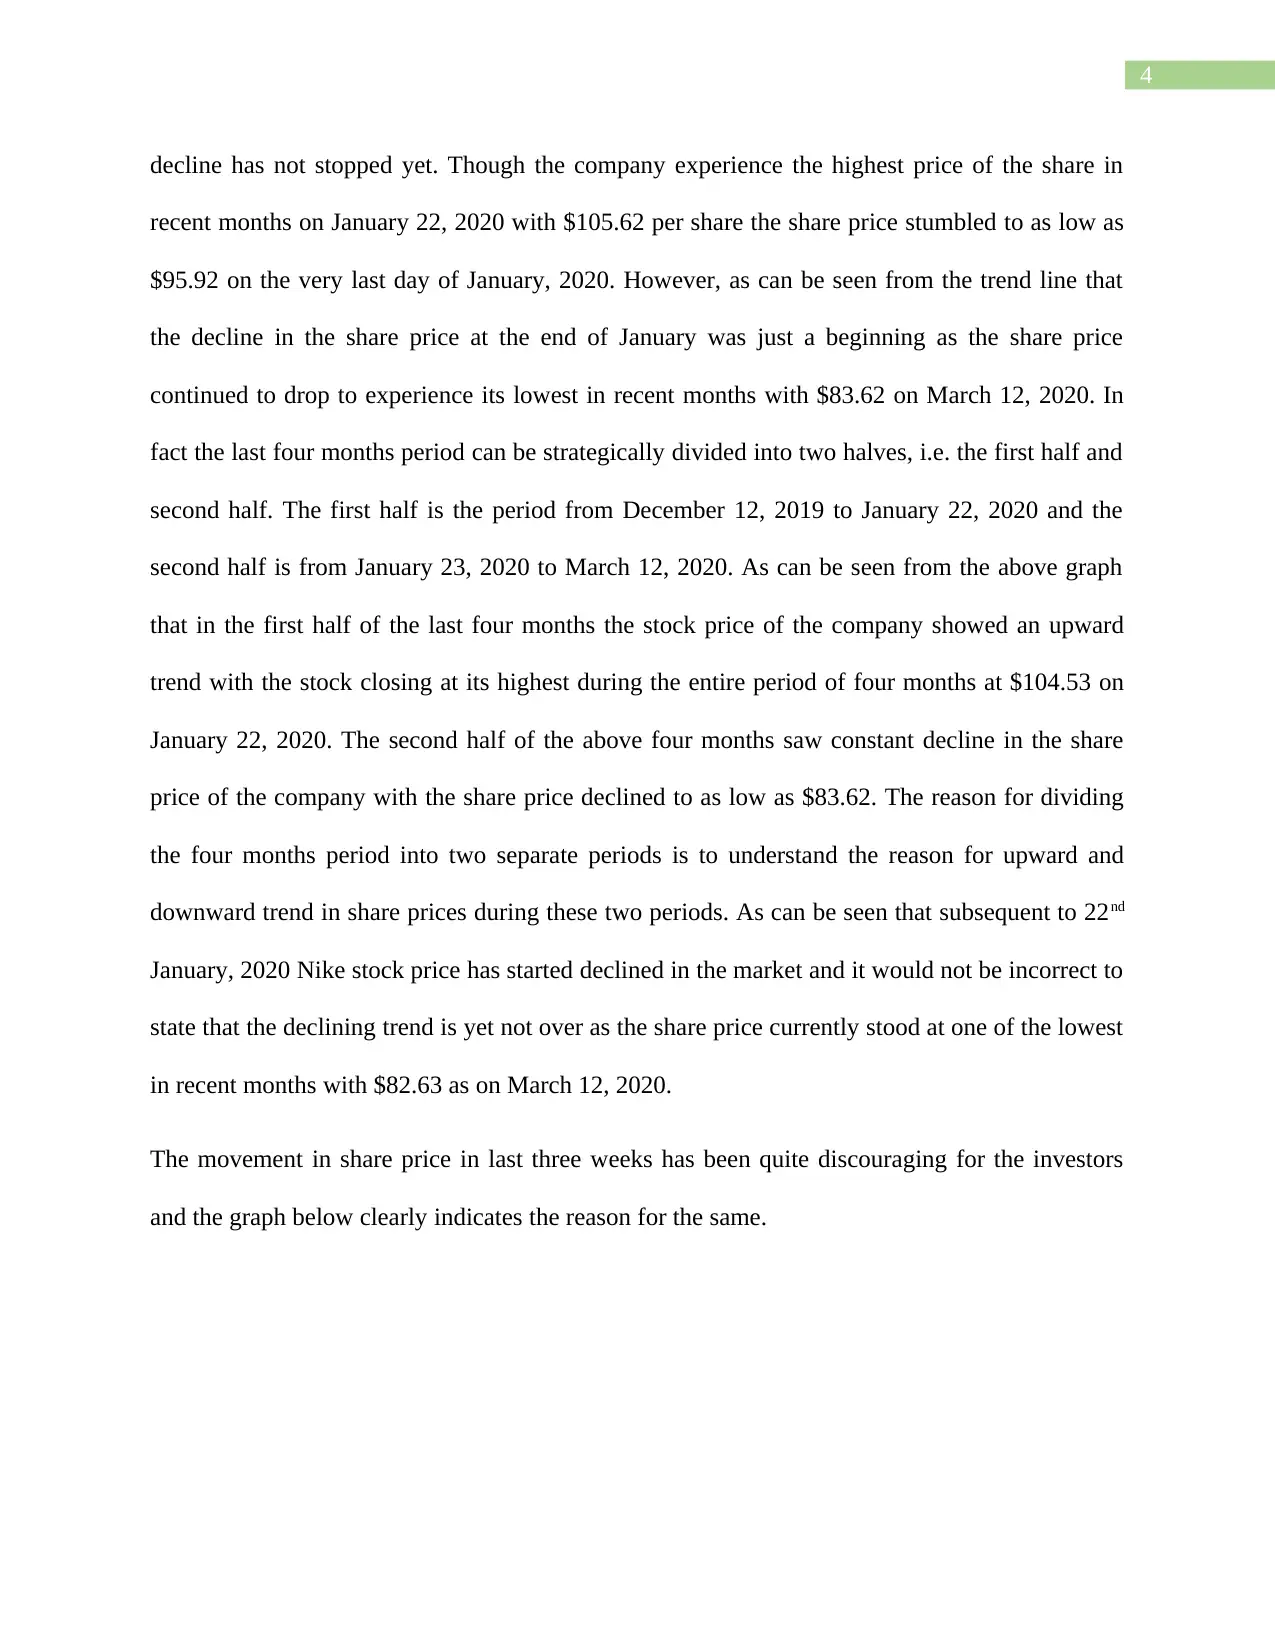
The movement in share price in last three weeks has been quite discouraging for the investors
and the graph below clearly indicates the reason for the same.
decline has not stopped yet. Though the company experience the highest price of the share in
recent months on January 22, 2020 with $105.62 per share the share price stumbled to as low as
$95.92 on the very last day of January, 2020. However, as can be seen from the trend line that
the decline in the share price at the end of January was just a beginning as the share price
continued to drop to experience its lowest in recent months with $83.62 on March 12, 2020. In
fact the last four months period can be strategically divided into two halves, i.e. the first half and
second half. The first half is the period from December 12, 2019 to January 22, 2020 and the
second half is from January 23, 2020 to March 12, 2020. As can be seen from the above graph
that in the first half of the last four months the stock price of the company showed an upward
trend with the stock closing at its highest during the entire period of four months at $104.53 on
January 22, 2020. The second half of the above four months saw constant decline in the share
price of the company with the share price declined to as low as $83.62. The reason for dividing
the four months period into two separate periods is to understand the reason for upward and
downward trend in share prices during these two periods. As can be seen that subsequent to 22nd
January, 2020 Nike stock price has started declined in the market and it would not be incorrect to
state that the declining trend is yet not over as the share price currently stood at one of the lowest
in recent months with $82.63 as on March 12, 2020.
The movement in share price in last three weeks has been quite discouraging for the investors
and the graph below clearly indicates the reason for the same.
5
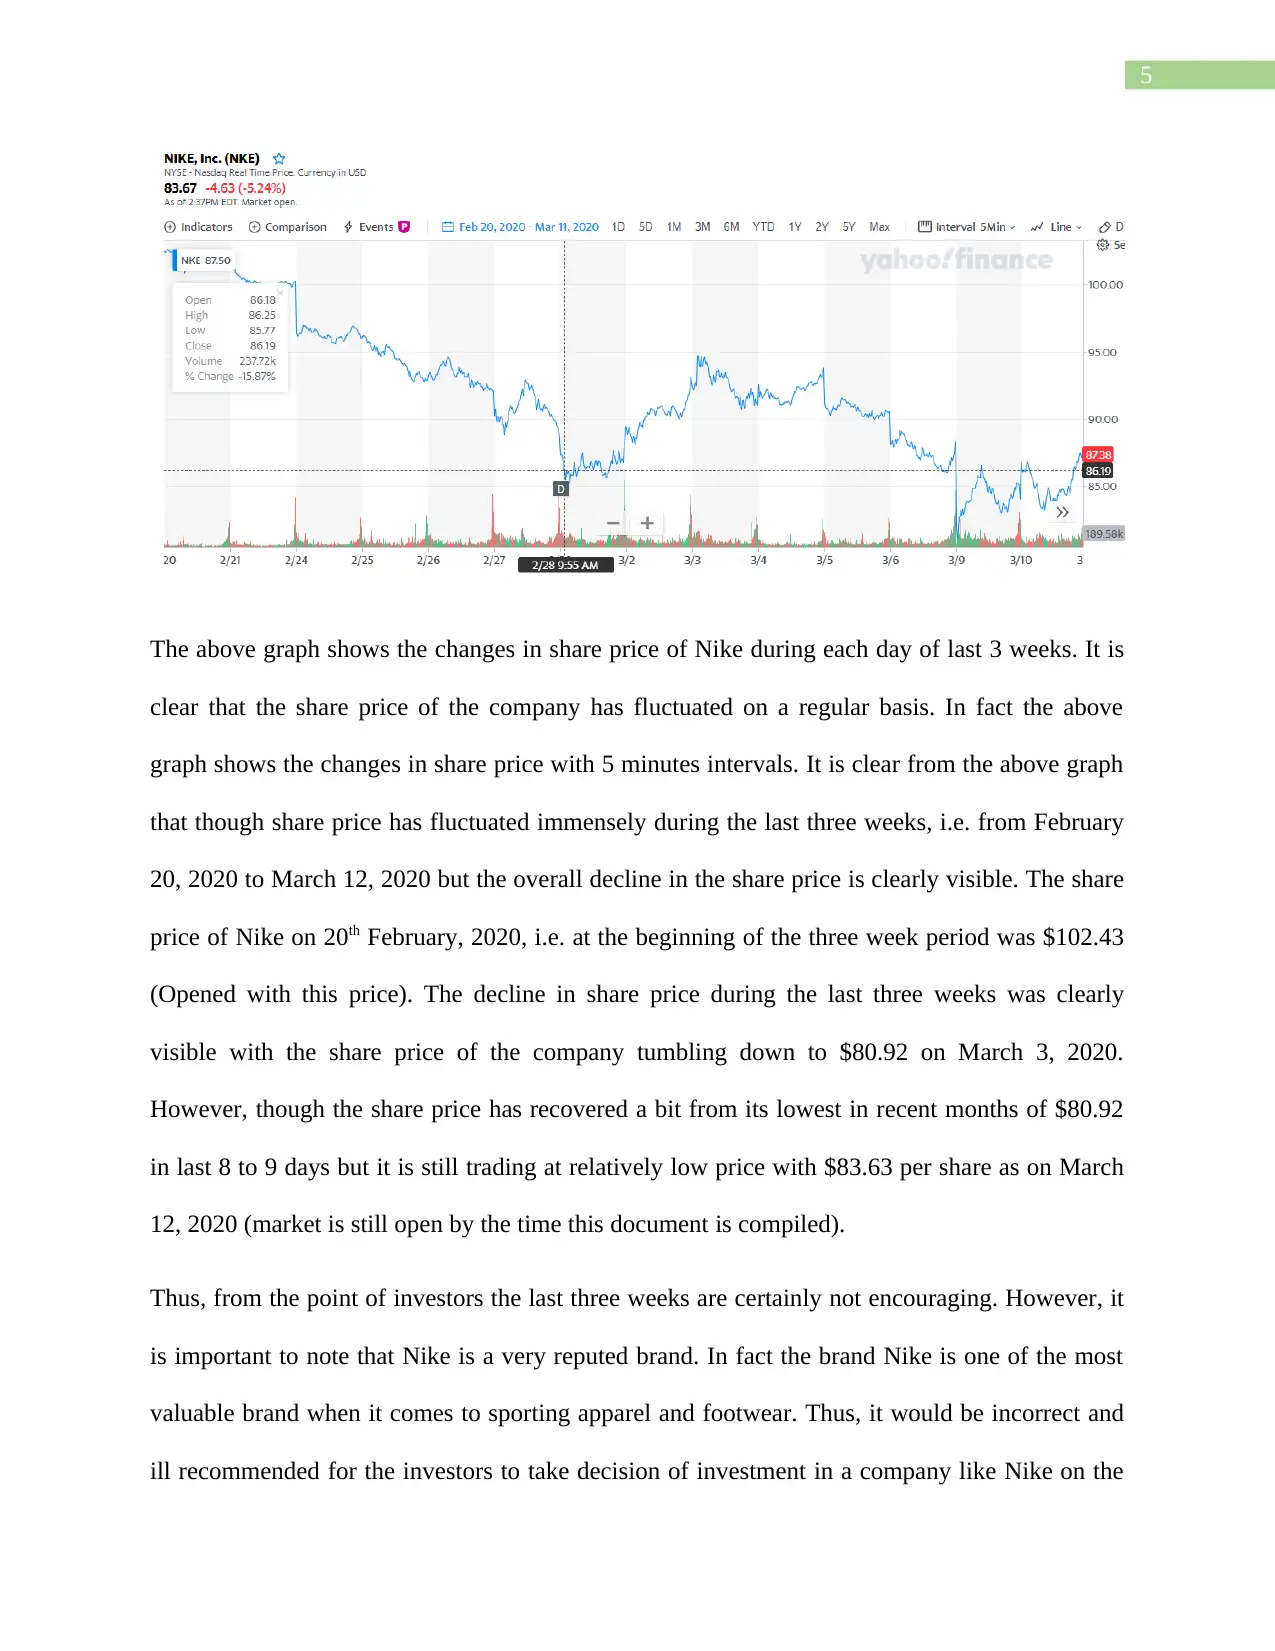
The above graph shows the changes in share price of Nike during each day of last 3 weeks. It is
clear that the share price of the company has fluctuated on a regular basis. In fact the above
graph shows the changes in share price with 5 minutes intervals. It is clear from the above graph
that though share price has fluctuated immensely during the last three weeks, i.e. from February
20, 2020 to March 12, 2020 but the overall decline in the share price is clearly visible. The share
price of Nike on 20th February, 2020, i.e. at the beginning of the three week period was $102.43
(Opened with this price). The decline in share price during the last three weeks was clearly
visible with the share price of the company tumbling down to $80.92 on March 3, 2020.
However, though the share price has recovered a bit from its lowest in recent months of $80.92
in last 8 to 9 days but it is still trading at relatively low price with $83.63 per share as on March
12, 2020 (market is still open by the time this document is compiled).
Thus, from the point of investors the last three weeks are certainly not encouraging. However, it
is important to note that Nike is a very reputed brand. In fact the brand Nike is one of the most
valuable brand when it comes to sporting apparel and footwear. Thus, it would be incorrect and
ill recommended for the investors to take decision of investment in a company like Nike on the
⊘ This is a preview!⊘
Do you want full access?
Subscribe today to unlock all pages.
Trusted by 1+ million students worldwide
6
basis of the trend in share price of the company over the period of last three weeks (Zhang,
2018).
However, it is important to understand the reason behind significant decline in the share price of
the company in recent months. In order to unearth the reasons behind the steady decline in share
price of the company in recent months a closer has to be given to the sales report of the
company. As per the latest sales report the growth of sales of the company in North America has
not been up to the mark. In fact the fiscal fourth quarter growth of 2019 has not been up to the
mark at all in North America. Considering that North America is the prime market of the
company the softer sales growth in the region than expected has certainly contributed to the
downfall of the share price in recent months. The after fall of softer sales growth in the fourth
quarter of 2019 is an important factor that has driven the sudden downfall in the share price.
However, it is important to note than in 2019 the overall growth in the stock price of the
company was almost 31%, i.e. 30.66% to be precise. This is because the softer fourth quarter
sales growth of the company in North America was reported and effected only after the end of
2019. Hence, the negative effects on the trading of company’s shares started showing only
towards the end of January, 2020 and thereafter (Raggio & Leone, 2018).
However, as already stated that a company like Nike Inc. has the strength to observe the initial
shock of declining share price with relative ease due to its market reputation and brand value
provided that there is nothing severely wrong in the business aspects of the company. A better
analysis of company’s stock would be to discuss the changes in share prices and trends over a
long period of time say a year and five years if necessary.
The trend of Share prices of the company over the last year is depicted below in the graph.
Paraphrase This Document
Need a fresh take? Get an instant paraphrase of this document with our AI Paraphraser
7
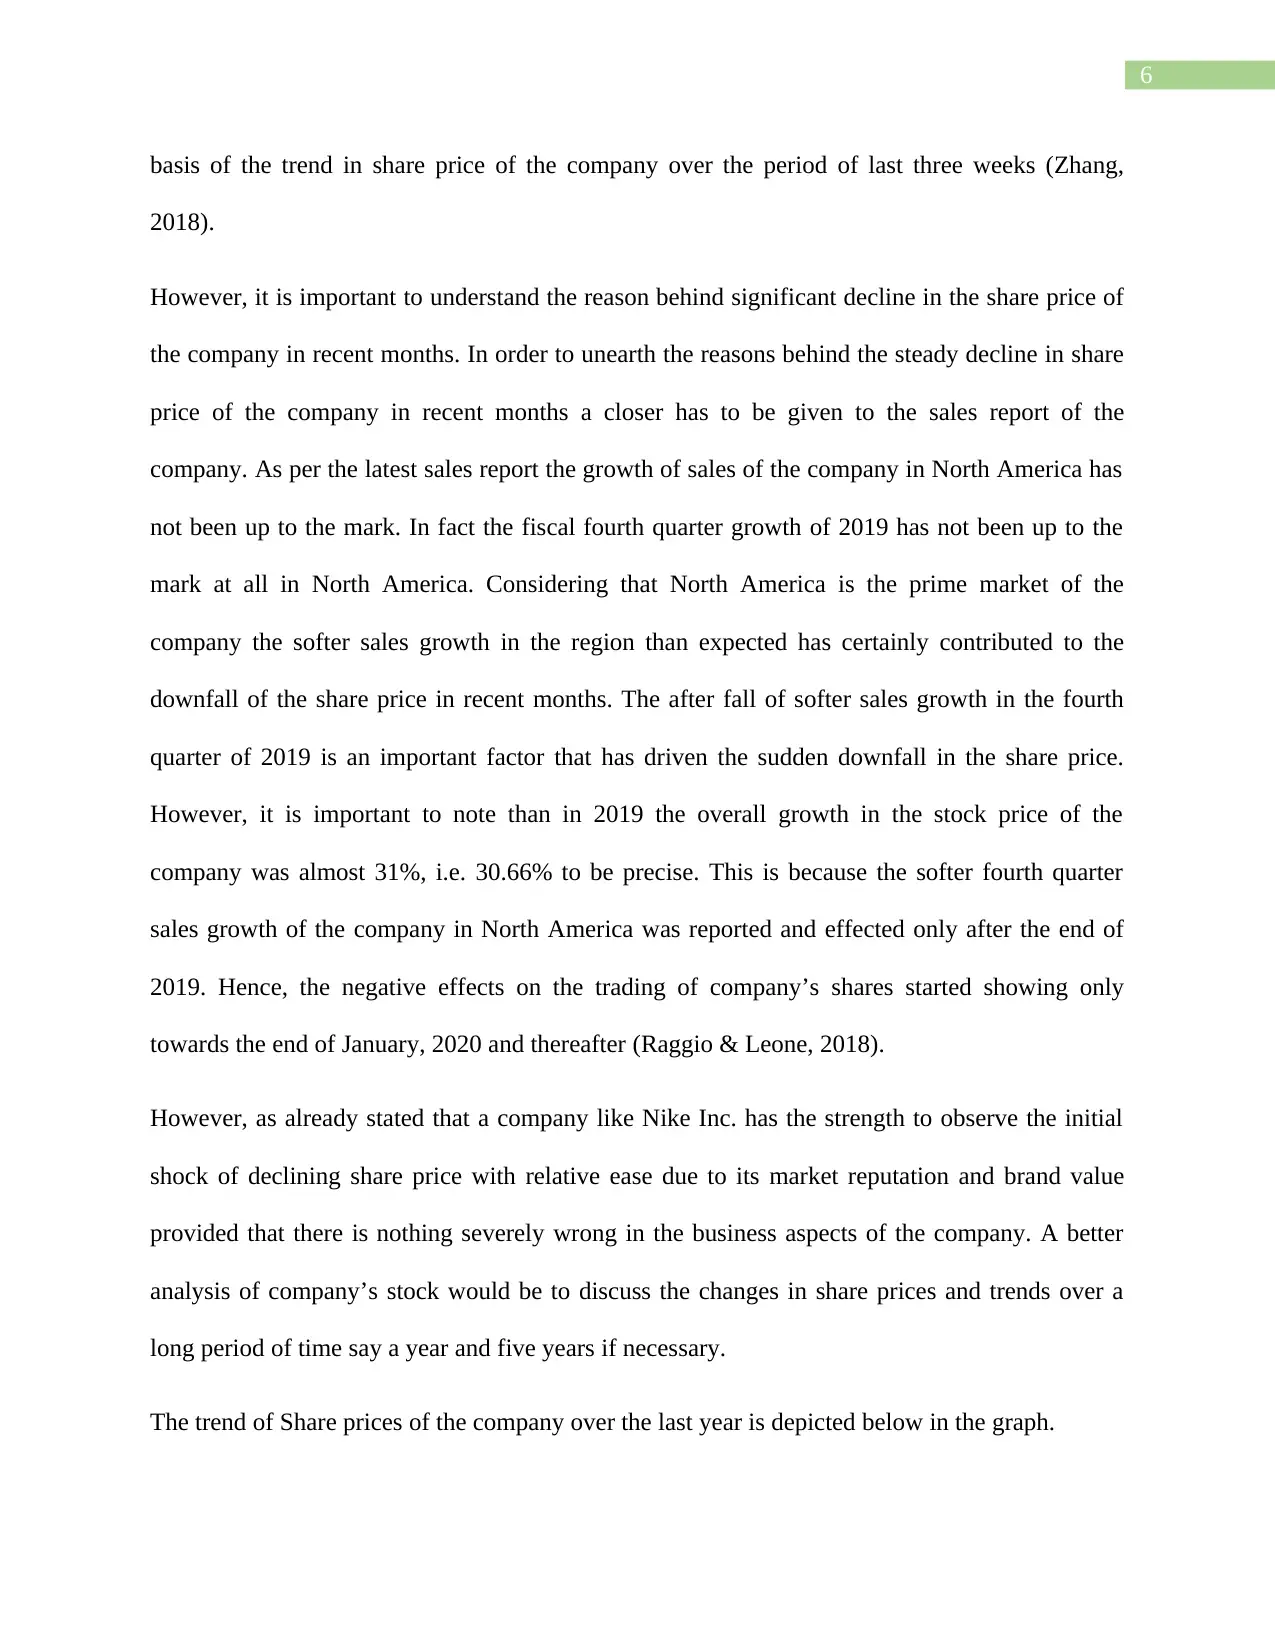
The above graph clearly shows that the share price of the company has certainly declined in
recent months to currently being traded at $83.63 but however, the decline is not significant at all
if the share price of the company as in April, 2019 is considered. It is clear from the above graph
that the share price of the company is even lower during the period from June to August.
However, after August, 2019 the share price of the company started to follow an upward trend
which continued till January, 2020. The trend in share price of the company after January rather
from the end of January till now is very much downward as already discussed (Ntui, Yuda,
Prosper & Samwel, 2015).
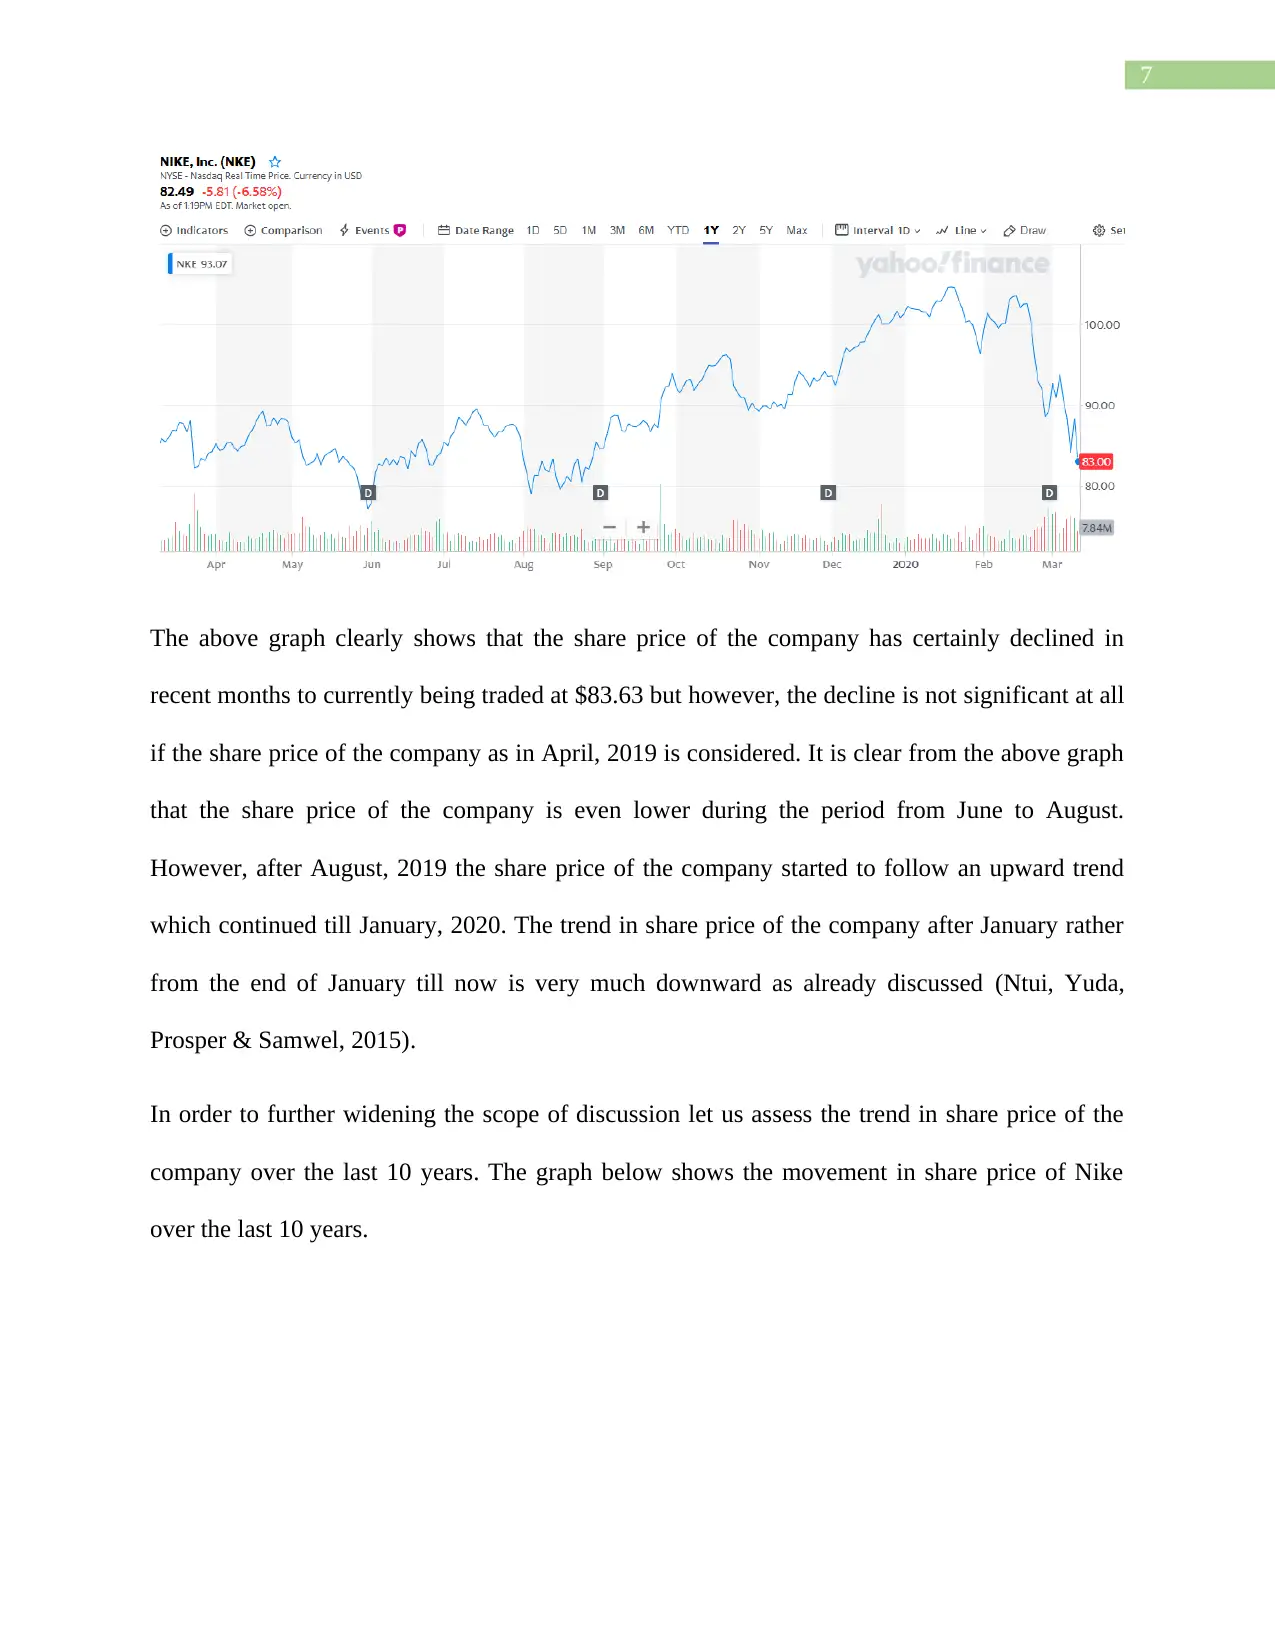
In order to further widening the scope of discussion let us assess the trend in share price of the
company over the last 10 years. The graph below shows the movement in share price of Nike
over the last 10 years.
The above graph clearly shows that the share price of the company has certainly declined in
recent months to currently being traded at $83.63 but however, the decline is not significant at all
if the share price of the company as in April, 2019 is considered. It is clear from the above graph
that the share price of the company is even lower during the period from June to August.
However, after August, 2019 the share price of the company started to follow an upward trend
which continued till January, 2020. The trend in share price of the company after January rather
from the end of January till now is very much downward as already discussed (Ntui, Yuda,
Prosper & Samwel, 2015).
In order to further widening the scope of discussion let us assess the trend in share price of the
company over the last 10 years. The graph below shows the movement in share price of Nike
over the last 10 years.
8
If the movements of share price of the company over the last 10 years are considered then it is
clear that the investors of the company must be extremely happy and satisfied with their
investment as the blue line in the above graph clearly indicates that the share price of the
company has moved upward only. In 2011 the share price of the company was as low as $24.50
per share which reached as high as $105.60 per share during the last 10 years period however,
currently the share is being traded at $83.63 per share (Ingenbleek, 2018).
The reason for the upward movement of share price in last 10 years is mainly the performance of
the company. The financial statements of the company will enlighten us about the ever
improving financial performance of the company. The income statements of the company over
the last five years period have been accumulated below to understand how the company has
grown over the periods to justify the growth in its share price during the said period.
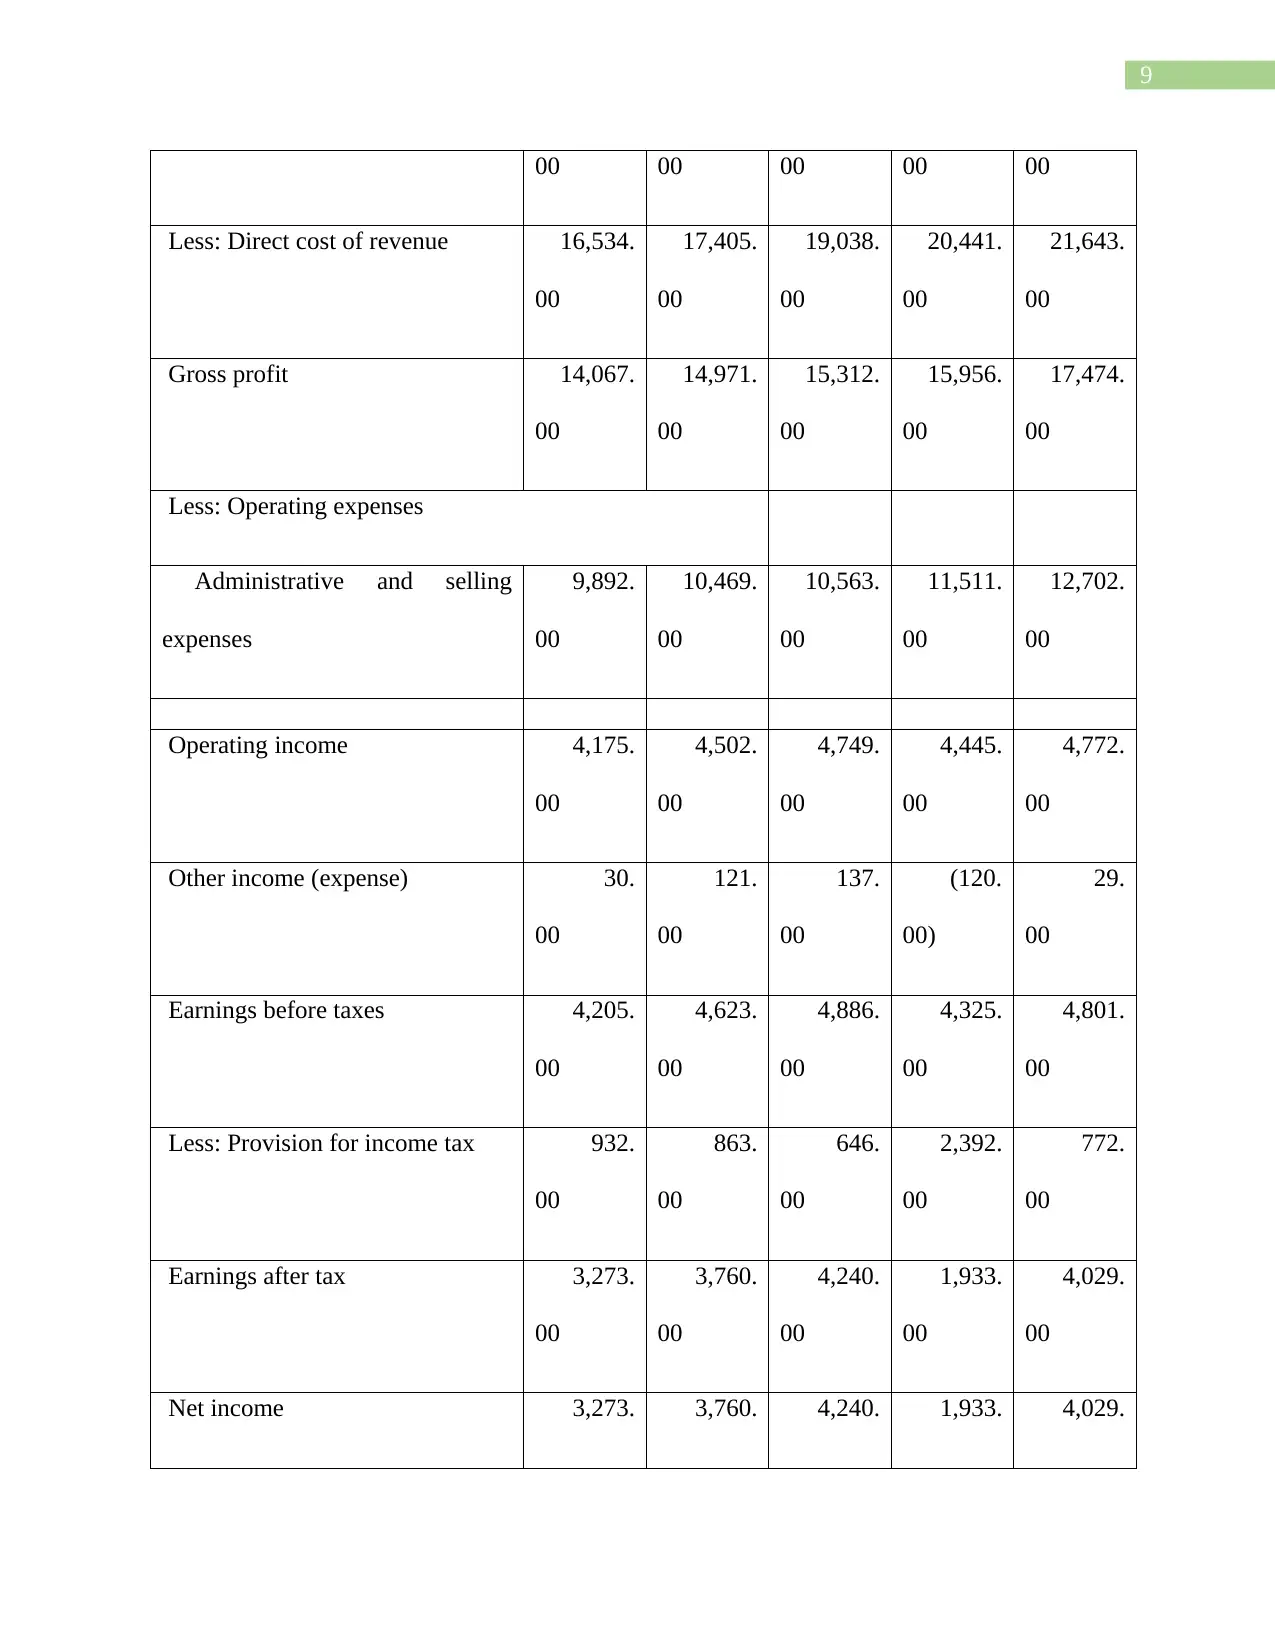
INCOME STATEMENT OF NIKE INC.
All amounts are in US$ millions 2015-05 2016-05 2017-05 2018-05 2019-05
Sales and revenue 30,601. 32,376. 34,350. 36,397. 39,117.
If the movements of share price of the company over the last 10 years are considered then it is
clear that the investors of the company must be extremely happy and satisfied with their
investment as the blue line in the above graph clearly indicates that the share price of the
company has moved upward only. In 2011 the share price of the company was as low as $24.50
per share which reached as high as $105.60 per share during the last 10 years period however,
currently the share is being traded at $83.63 per share (Ingenbleek, 2018).
The reason for the upward movement of share price in last 10 years is mainly the performance of
the company. The financial statements of the company will enlighten us about the ever
improving financial performance of the company. The income statements of the company over
the last five years period have been accumulated below to understand how the company has
grown over the periods to justify the growth in its share price during the said period.
INCOME STATEMENT OF NIKE INC.
All amounts are in US$ millions 2015-05 2016-05 2017-05 2018-05 2019-05
Sales and revenue 30,601. 32,376. 34,350. 36,397. 39,117.
⊘ This is a preview!⊘
Do you want full access?
Subscribe today to unlock all pages.
Trusted by 1+ million students worldwide
9
00 00 00 00 00
Less: Direct cost of revenue 16,534.
00
17,405.
00
19,038.
00
20,441.
00
21,643.
00
Gross profit 14,067.
00
14,971.
00
15,312.
00
15,956.
00
17,474.
00
Less: Operating expenses
Administrative and selling
expenses
9,892.
00
10,469.
00
10,563.
00
11,511.
00
12,702.
00
Operating income 4,175.
00
4,502.
00
4,749.
00
4,445.
00
4,772.
00
Other income (expense) 30.
00
121.
00
137.
00
(120.
00)
29.
00
Earnings before taxes 4,205.
00
4,623.
00
4,886.
00
4,325.
00
4,801.
00
Less: Provision for income tax 932.
00
863.
00
646.
00
2,392.
00
772.
00
Earnings after tax 3,273.
00
3,760.
00
4,240.
00
1,933.
00
4,029.
00
Net income 3,273. 3,760. 4,240. 1,933. 4,029.
Paraphrase This Document
Need a fresh take? Get an instant paraphrase of this document with our AI Paraphraser
10
00 00 00 00 00
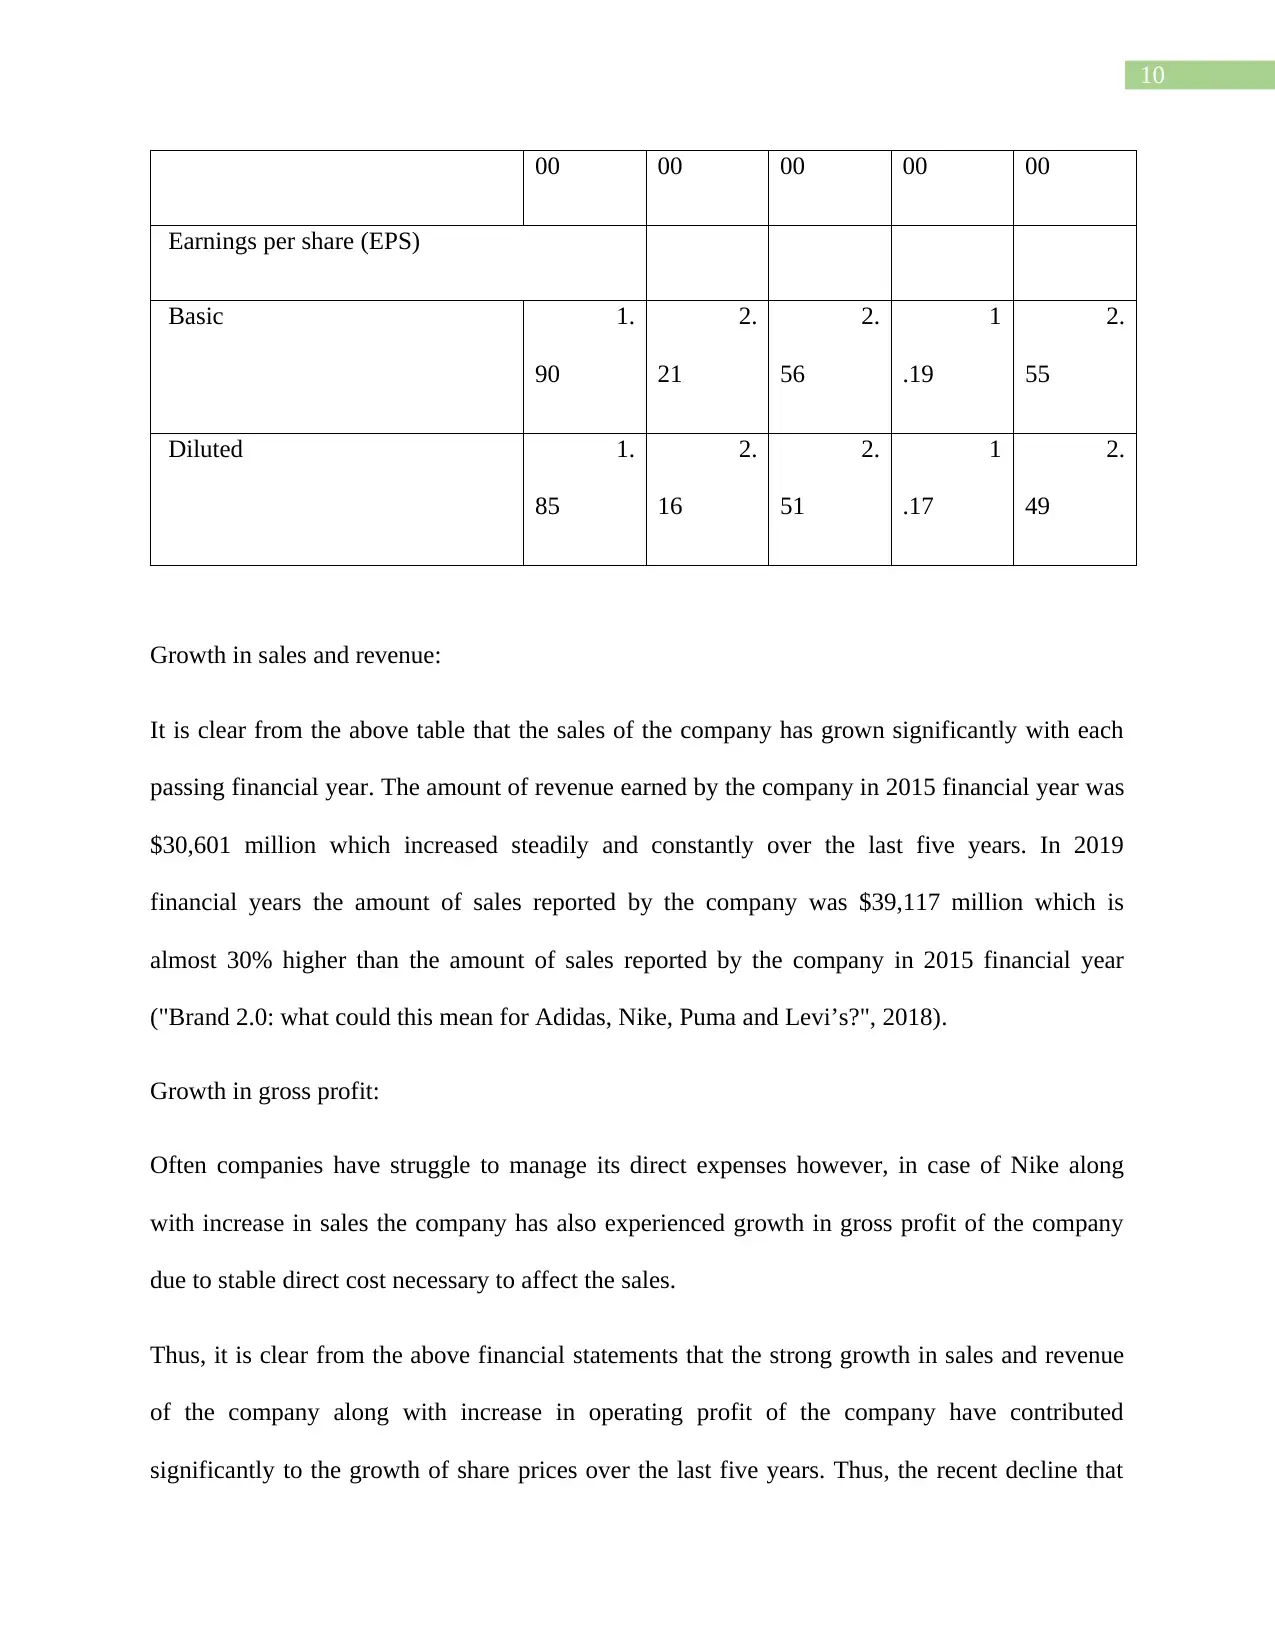
Earnings per share (EPS)
Basic 1.
90
2.
21
2.
56
1
.19
2.
55
Diluted 1.
85
2.
16
2.
51
1
.17
2.
49
Growth in sales and revenue:
It is clear from the above table that the sales of the company has grown significantly with each
passing financial year. The amount of revenue earned by the company in 2015 financial year was
$30,601 million which increased steadily and constantly over the last five years. In 2019
financial years the amount of sales reported by the company was $39,117 million which is
almost 30% higher than the amount of sales reported by the company in 2015 financial year
("Brand 2.0: what could this mean for Adidas, Nike, Puma and Levi’s?", 2018).
Growth in gross profit:
Often companies have struggle to manage its direct expenses however, in case of Nike along
with increase in sales the company has also experienced growth in gross profit of the company
due to stable direct cost necessary to affect the sales.
Thus, it is clear from the above financial statements that the strong growth in sales and revenue
of the company along with increase in operating profit of the company have contributed
significantly to the growth of share prices over the last five years. Thus, the recent decline that
00 00 00 00 00
Earnings per share (EPS)
Basic 1.
90
2.
21
2.
56
1
.19
2.
55
Diluted 1.
85
2.
16
2.
51
1
.17
2.
49
Growth in sales and revenue:
It is clear from the above table that the sales of the company has grown significantly with each
passing financial year. The amount of revenue earned by the company in 2015 financial year was
$30,601 million which increased steadily and constantly over the last five years. In 2019
financial years the amount of sales reported by the company was $39,117 million which is
almost 30% higher than the amount of sales reported by the company in 2015 financial year
("Brand 2.0: what could this mean for Adidas, Nike, Puma and Levi’s?", 2018).
Growth in gross profit:
Often companies have struggle to manage its direct expenses however, in case of Nike along
with increase in sales the company has also experienced growth in gross profit of the company
due to stable direct cost necessary to affect the sales.
Thus, it is clear from the above financial statements that the strong growth in sales and revenue
of the company along with increase in operating profit of the company have contributed
significantly to the growth of share prices over the last five years. Thus, the recent decline that
11
the share of the company is currently experiencing is mainly due to the softer sales growth in
North American region. Thus, the declining trend of the share price is expected to be temporary
and the management is looking to achieve higher growth of sales in the future to reverse the
declining trend of share price of last few months (Borkovsky & Haviv, 2017).
Recommendations:
Business recommendations based on the above findings are summarized below:
Nike is a strong brand and thus, temporary decline in share price should not affect the decision of
investors who are willing to hold the investment for a long period. The financial performance as
well as the growth in share price have been amazing over the years and there is nothing to worry
about the recent decline in share price of the company.
In fact the declining share price is an opportunity for relatively less wealthy investors to invest in
the shares of the company by acquiring the shares from the market. Thus, investors are
recommended to buy the shares from the market if available for sale as the share price is
expected to increase in the future with number of new initiatives the management is already
looking to increase the overall growth in sales and revenue of the company in the future.
A closer look at the extent of return earned by the investors who invested in the shares of the
company at the time of initial public offering (IPO) will be helpful for the new investors to
understand huge return that those investors have earned from the investment in Nike. As already
mentioned that at the time of IPO of Nike the 5,555 shares of Nike were valued $1,000 in 1980.
Those 5,555 shares after numerous splits stand at 711,040 shares with a combined value of
$54,154,738 in 2018. Thus, the original investors have earned an astronomical 5,215,378%
return on their investment in the shares of the company.
⊘ This is a preview!⊘
Do you want full access?
Subscribe today to unlock all pages.
Trusted by 1+ million students worldwide
1 out of 15


Your All-in-One AI-Powered Toolkit for Academic Success.
+13062052269
info@desklib.com
Available 24*7 on WhatsApp / Email
![[object Object]](/_next/static/media/star-bottom.7253800d.svg)
Unlock your academic potential
Copyright © 2020–2026 A2Z Services. All Rights Reserved. Developed and managed by ZUCOL.