ACC00724 Accounting for Managers: Financial Statement Ratio Analysis

Verified

Added on  2023/06/15

|10
|1773
|55
Homework Assignment
AI Summary
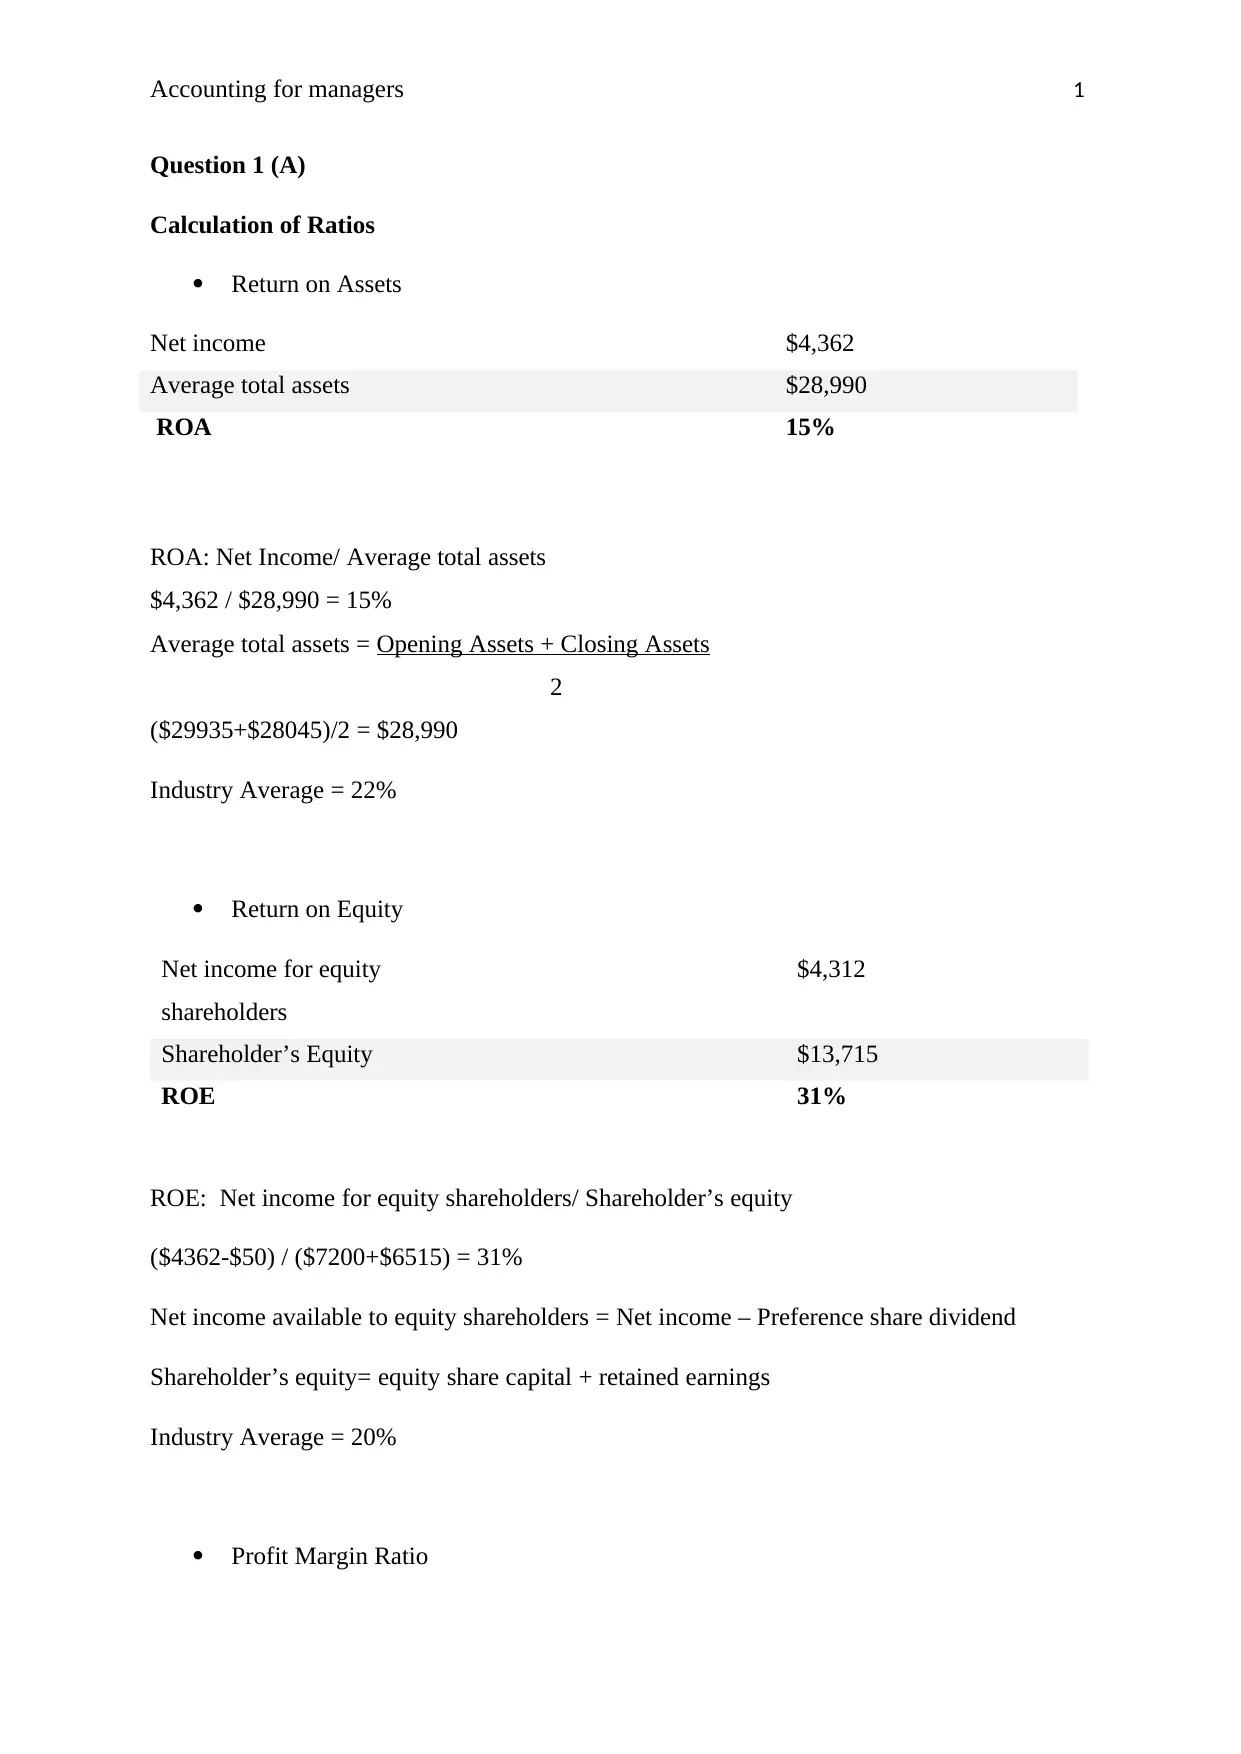
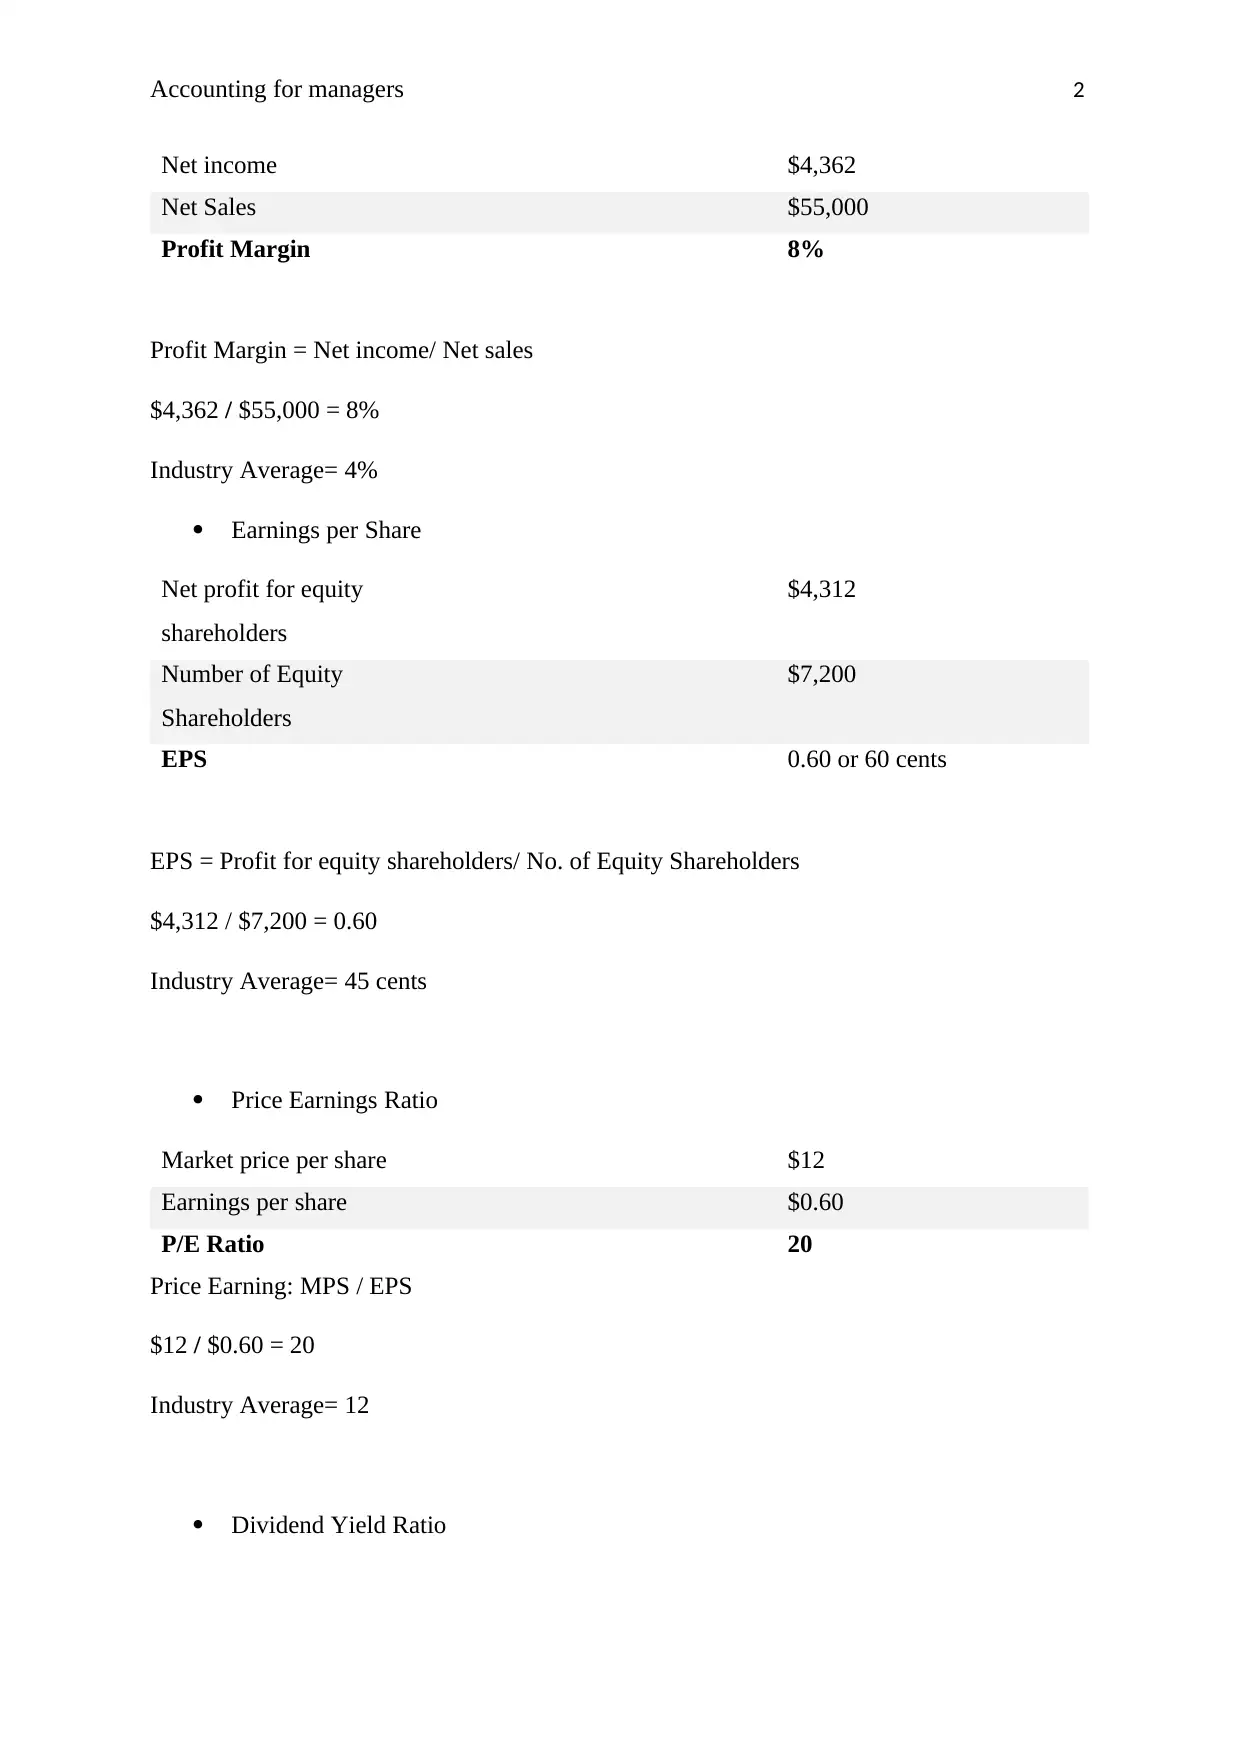
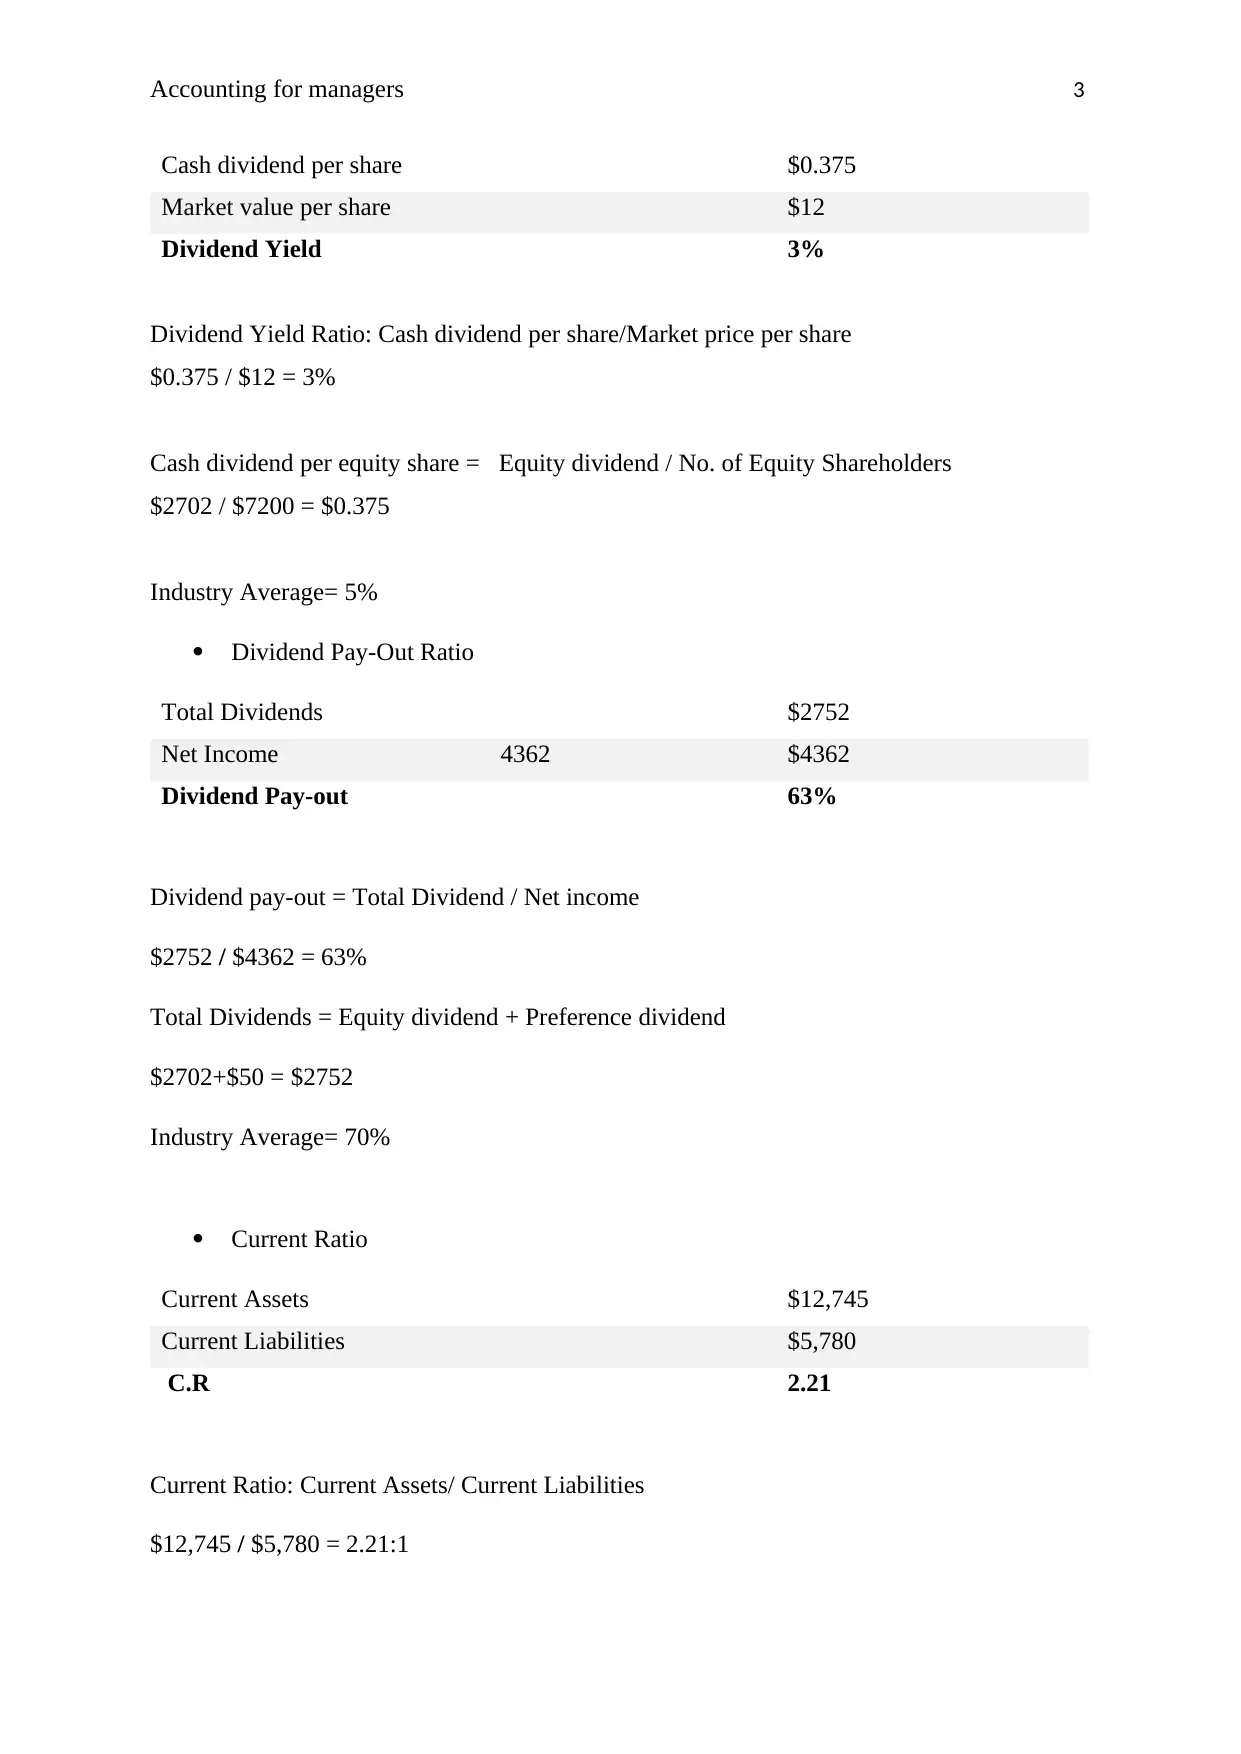
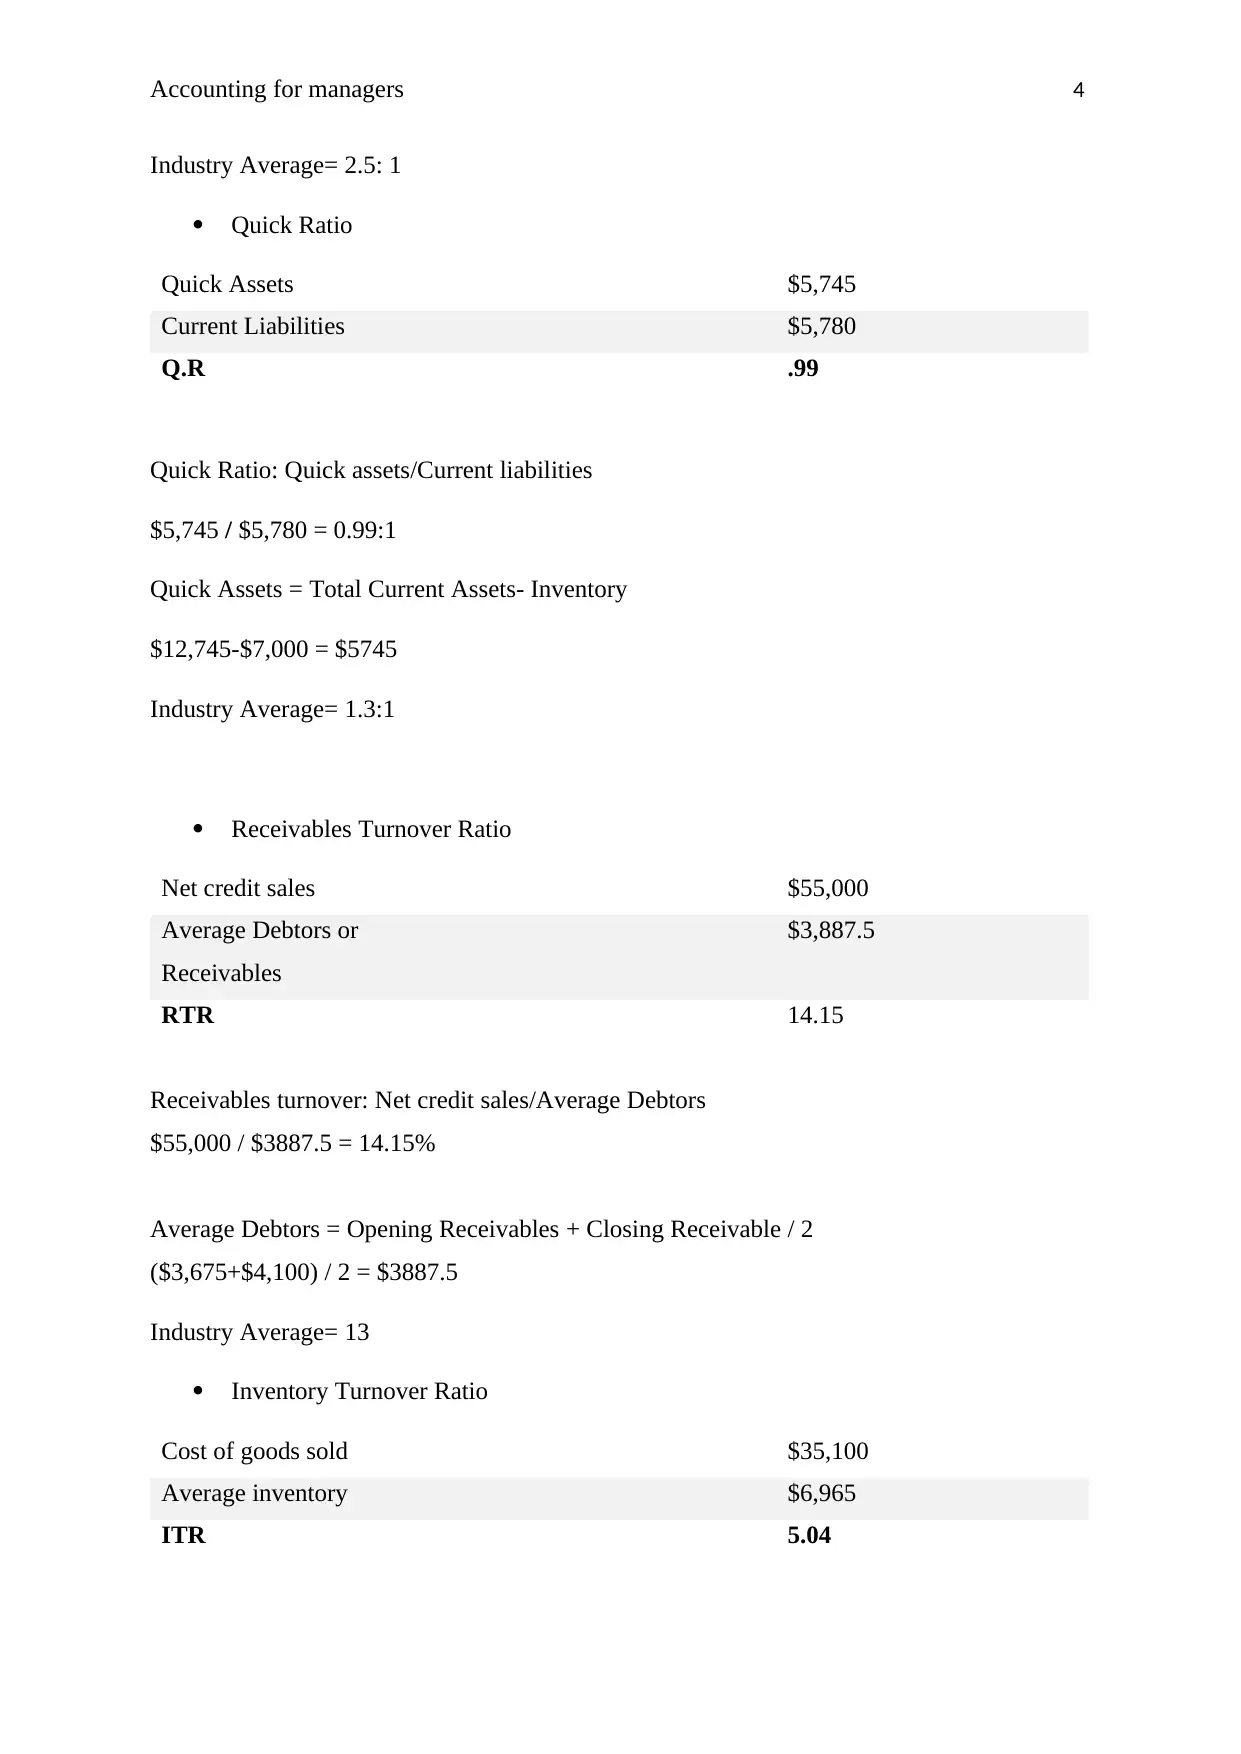
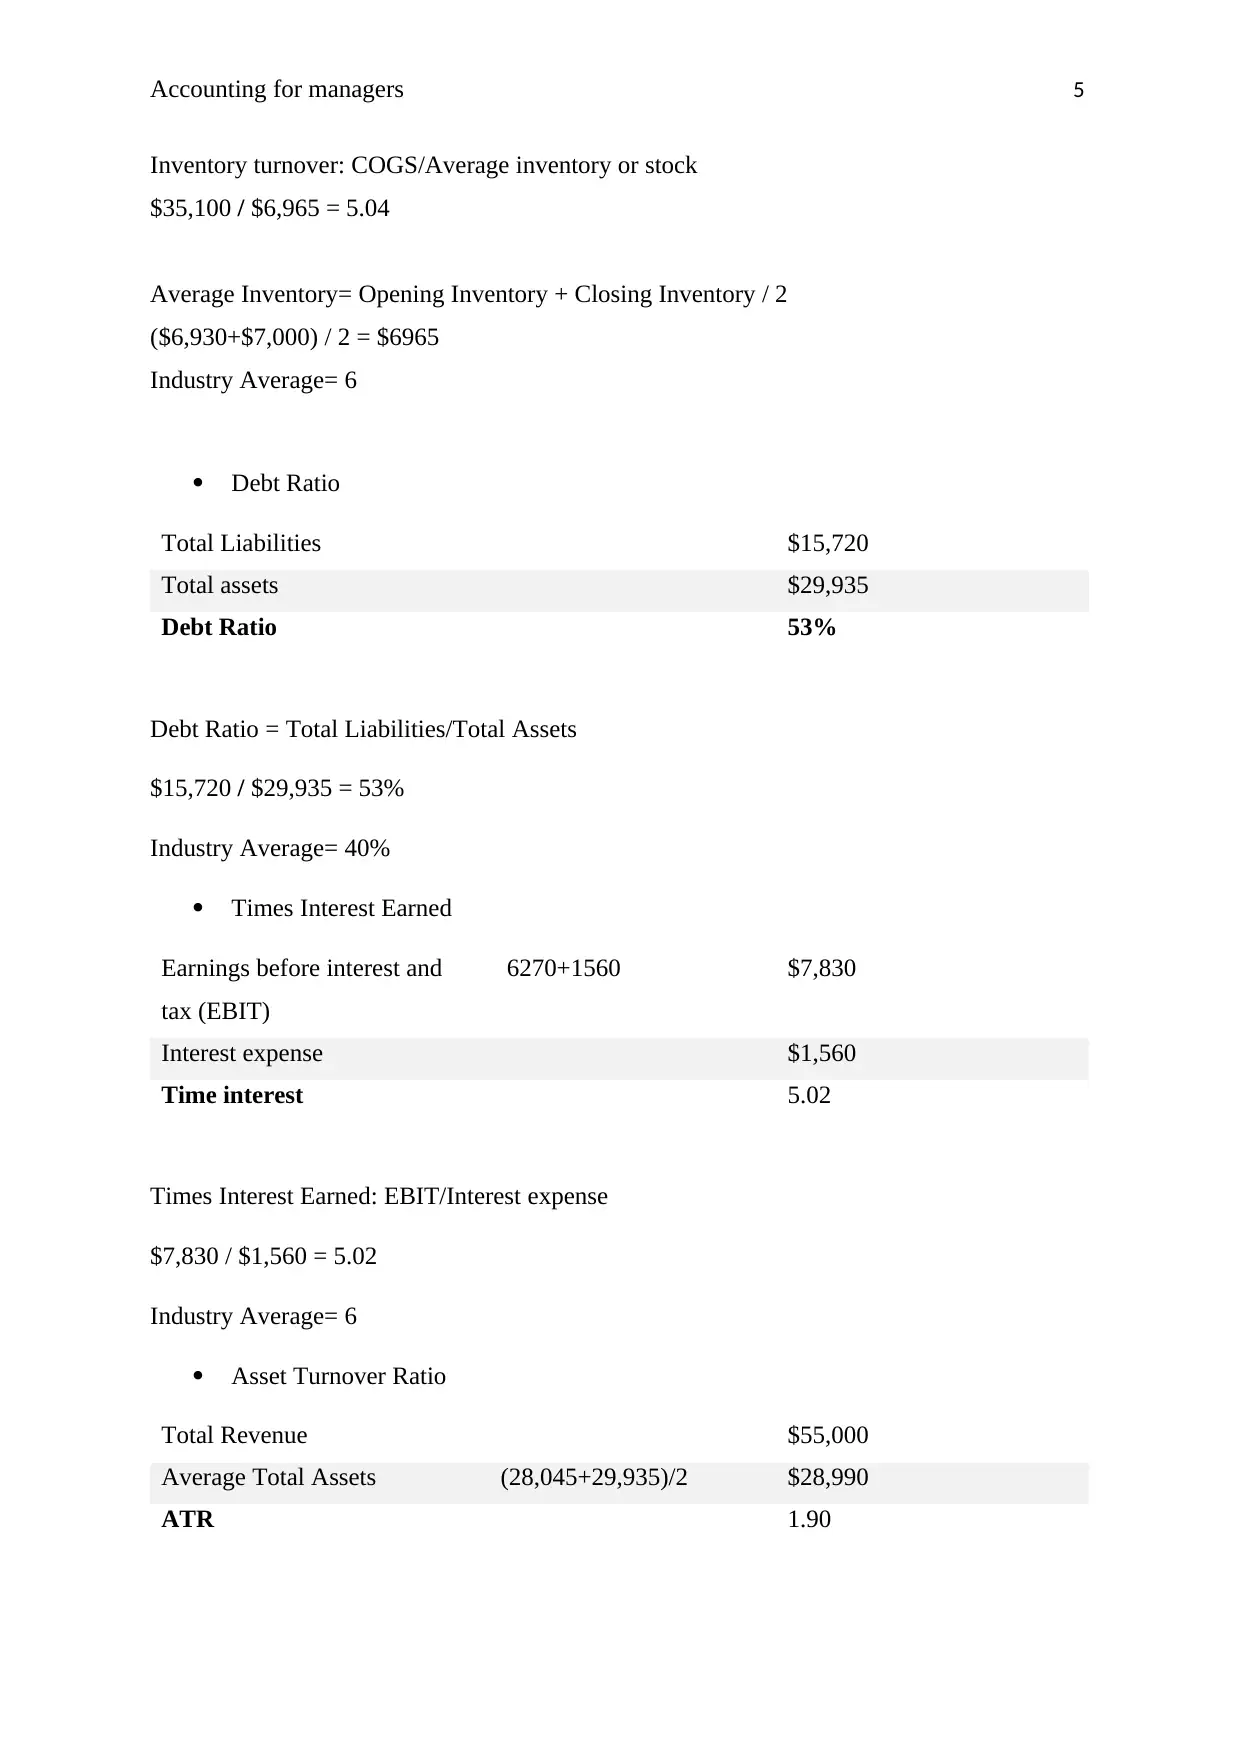
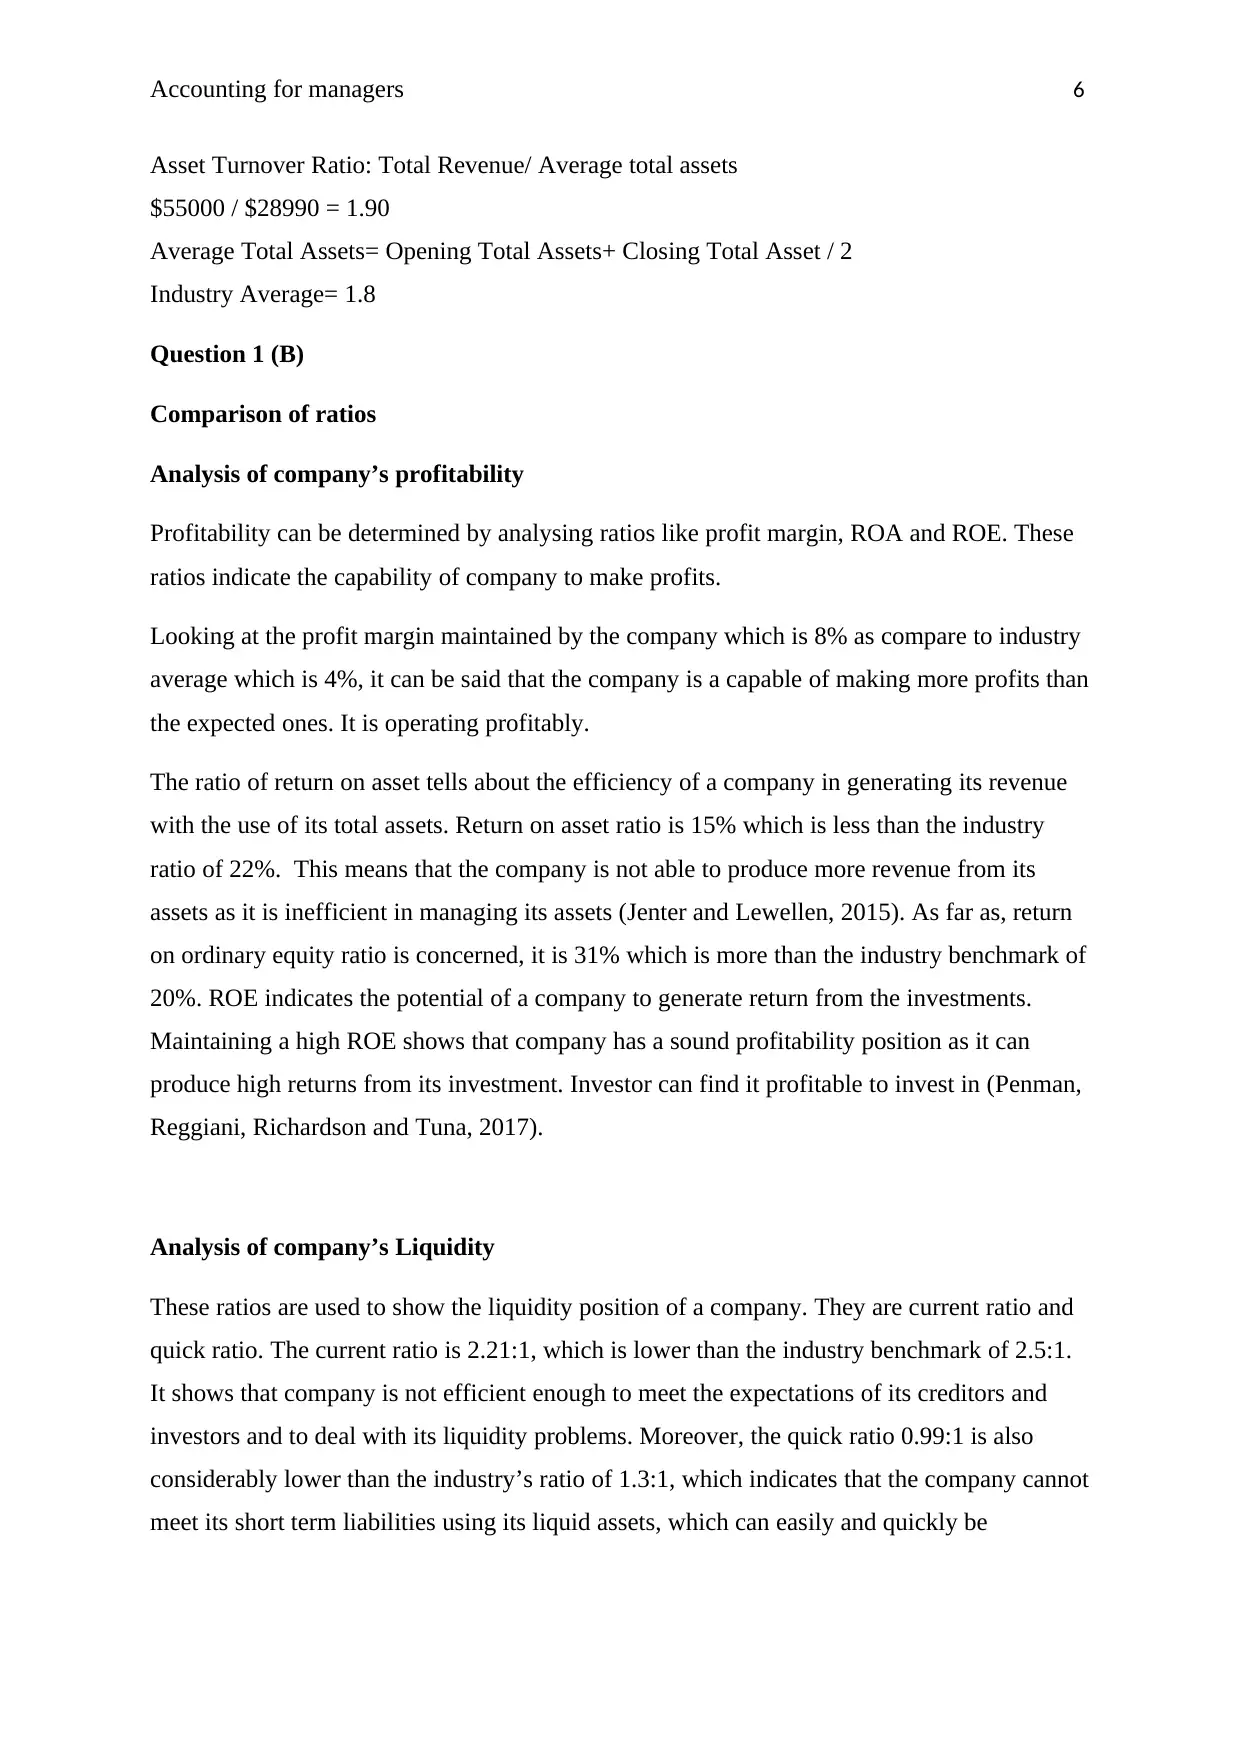
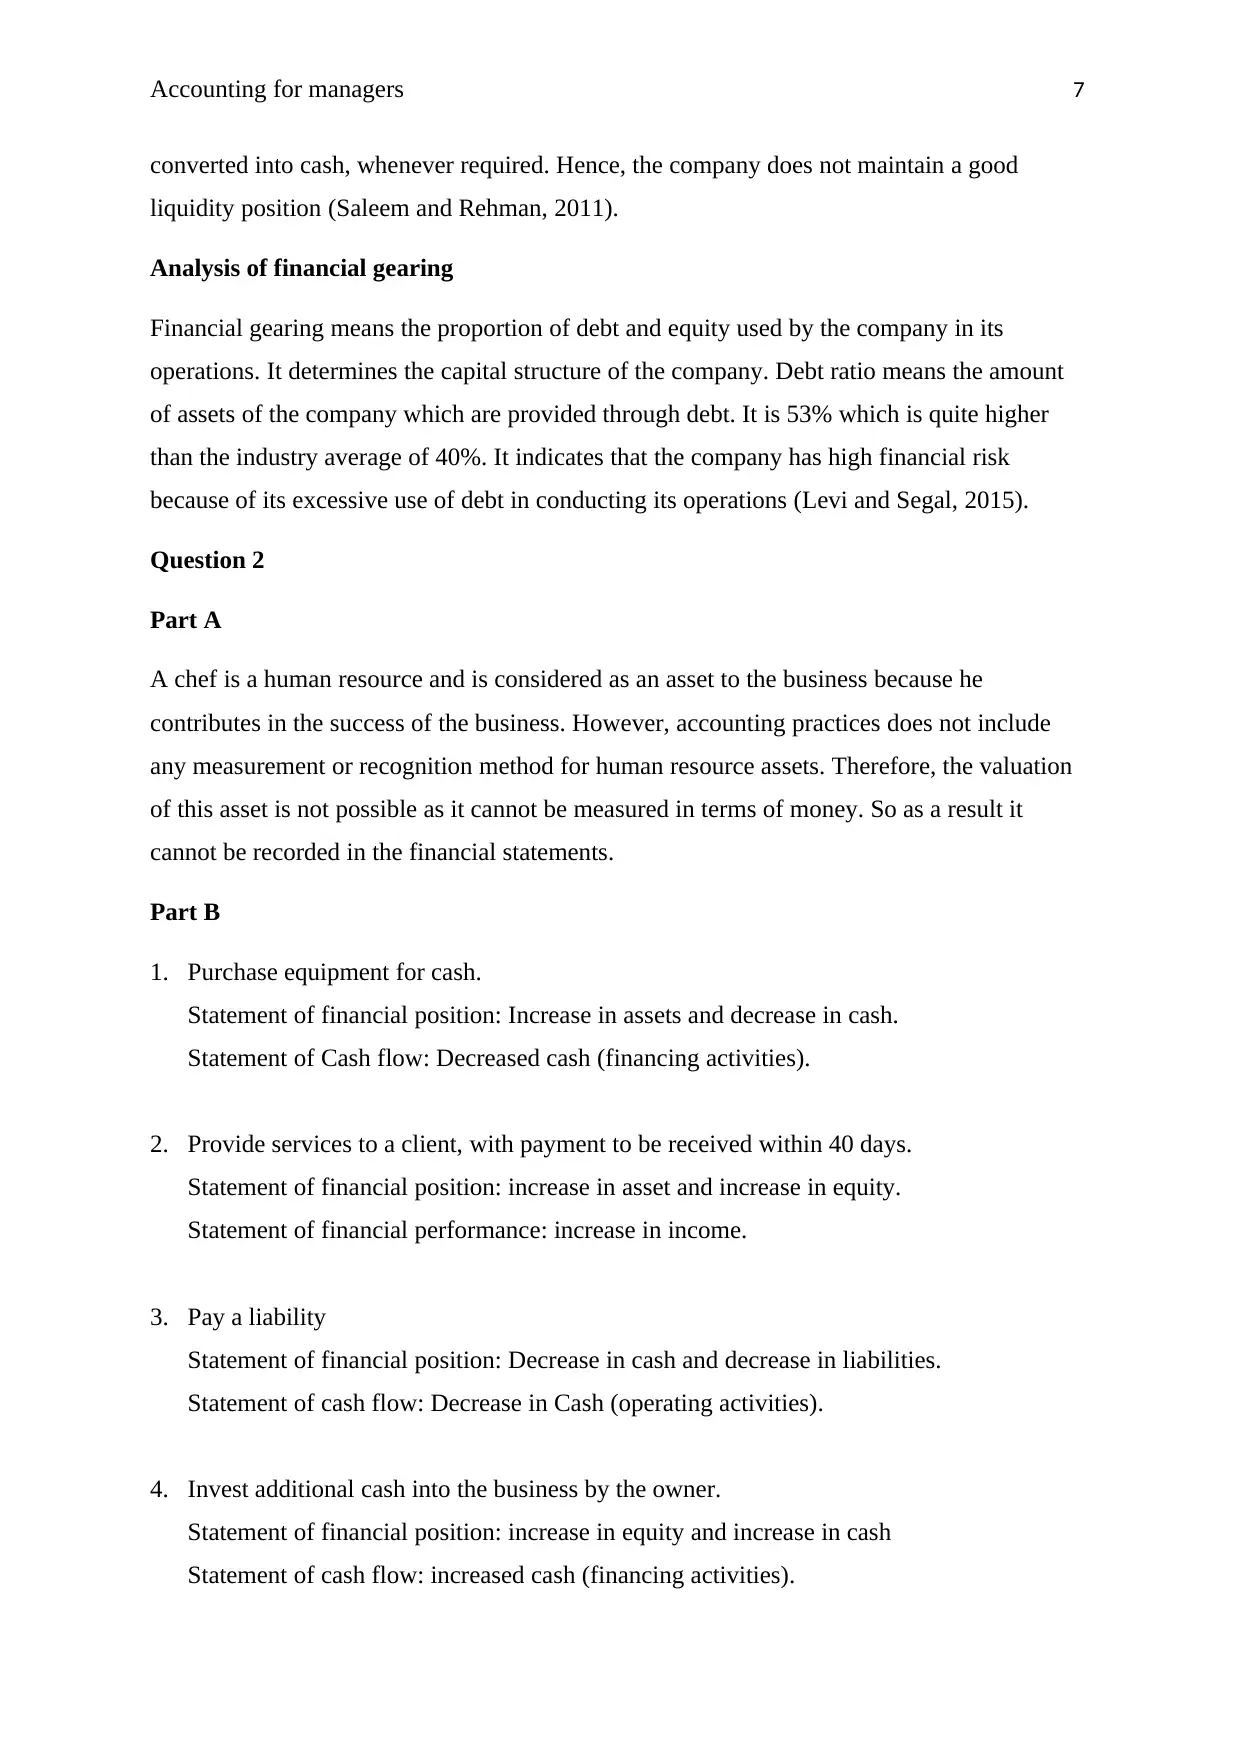
This assignment provides a comprehensive financial ratio analysis of Nimbin Pty Ltd, utilizing financial statements to calculate and interpret key metrics such as Return on Assets (ROA), Return on Equity (ROE), Profit Margin, Earnings per Share (EPS), and various liquidity and solvency ratios. The analysis compares these ratios against industry averages to assess the company's profitability, liquidity, and financial gearing. Additionally, the assignment addresses the accounting treatment of human resources and examines the impact of various transactions on the statement of financial position, statement of financial performance, and statement of cash flows. This document is available on Desklib, a platform offering a wide range of study tools and solved assignments for students.
tabler-icon-diamond-filled.svg

Contribute Materials

Your contribution can guide someone’s learning journey. Share your documents today.
Document Page
Running head: ACCOUNTING FOR MANAGERS
Accounting practices
tabler-icon-diamond-filled.svg

Secure Best Marks with AI Grader

Need help grading? Try our AI Grader for instant feedback on your assignments.
Document Page
Accounting for managers 1
Question 1 (A)
Calculation of Ratios
Return on Assets
ROA: Net Income/ Average total assets
$4,362 / $28,990 = 15%
Average total assets = Opening Assets + Closing Assets
2
($29935+$28045)/2 = $28,990
Industry Average = 22%
Return on Equity
Net income for equity
shareholders
$4,312
Shareholder’s Equity $13,715
ROE 31%
ROE: Net income for equity shareholders/ Shareholder’s equity
($4362-$50) / ($7200+$6515) = 31%
Net income available to equity shareholders = Net income – Preference share dividend
Shareholder’s equity= equity share capital + retained earnings
Industry Average = 20%
Profit Margin Ratio
Net income $4,362
Average total assets $28,990
ROA 15%
Document Page
Accounting for managers 2
Net income $4,362
Net Sales $55,000
Profit Margin 8%
Profit Margin = Net income/ Net sales
$4,362 / $55,000 = 8%
Industry Average= 4%
Earnings per Share
Net profit for equity
shareholders
$4,312
Number of Equity
Shareholders
$7,200
EPS 0.60 or 60 cents
EPS = Profit for equity shareholders/ No. of Equity Shareholders
$4,312 / $7,200 = 0.60
Industry Average= 45 cents
Price Earnings Ratio
Market price per share $12
Earnings per share $0.60
P/E Ratio 20
Price Earning: MPS / EPS
$12 / $0.60 = 20
Industry Average= 12
Dividend Yield Ratio
Document Page
Accounting for managers 3
Cash dividend per share $0.375
Market value per share $12
Dividend Yield 3%
Dividend Yield Ratio: Cash dividend per share/Market price per share
$0.375 / $12 = 3%
Cash dividend per equity share = Equity dividend / No. of Equity Shareholders
$2702 / $7200 = $0.375
Industry Average= 5%
Dividend Pay-Out Ratio
Total Dividends $2752
Net Income 4362 $4362
Dividend Pay-out 63%
Dividend pay-out = Total Dividend / Net income
$2752 / $4362 = 63%
Total Dividends = Equity dividend + Preference dividend
$2702+$50 = $2752
Industry Average= 70%
Current Ratio
Current Assets $12,745
Current Liabilities $5,780
C.R 2.21
Current Ratio: Current Assets/ Current Liabilities
$12,745 / $5,780 = 2.21:1
tabler-icon-diamond-filled.svg

Secure Best Marks with AI Grader

Need help grading? Try our AI Grader for instant feedback on your assignments.
Document Page
Accounting for managers 4
Industry Average= 2.5: 1
Quick Ratio
Quick Assets $5,745
Current Liabilities $5,780
Q.R .99
Quick Ratio: Quick assets/Current liabilities
$5,745 / $5,780 = 0.99:1
Quick Assets = Total Current Assets- Inventory
$12,745-$7,000 = $5745
Industry Average= 1.3:1
Receivables Turnover Ratio
Net credit sales $55,000
Average Debtors or
Receivables
$3,887.5
RTR 14.15
Receivables turnover: Net credit sales/Average Debtors
$55,000 / $3887.5 = 14.15%
Average Debtors = Opening Receivables + Closing Receivable / 2
($3,675+$4,100) / 2 = $3887.5
Industry Average= 13
Inventory Turnover Ratio
Cost of goods sold $35,100
Average inventory $6,965
ITR 5.04
Document Page
Accounting for managers 5
Inventory turnover: COGS/Average inventory or stock
$35,100 / $6,965 = 5.04
Average Inventory= Opening Inventory + Closing Inventory / 2
($6,930+$7,000) / 2 = $6965
Industry Average= 6
Debt Ratio
Total Liabilities $15,720
Total assets $29,935
Debt Ratio 53%
Debt Ratio = Total Liabilities/Total Assets
$15,720 / $29,935 = 53%
Industry Average= 40%
Times Interest Earned
Earnings before interest and
tax (EBIT)
6270+1560 $7,830
Interest expense $1,560
Time interest 5.02
Times Interest Earned: EBIT/Interest expense
$7,830 / $1,560 = 5.02
Industry Average= 6
Asset Turnover Ratio
Total Revenue $55,000
Average Total Assets (28,045+29,935)/2 $28,990
ATR 1.90
Document Page
Accounting for managers 6
Asset Turnover Ratio: Total Revenue/ Average total assets
$55000 / $28990 = 1.90
Average Total Assets= Opening Total Assets+ Closing Total Asset / 2
Industry Average= 1.8
Question 1 (B)
Comparison of ratios
Analysis of company’s profitability
Profitability can be determined by analysing ratios like profit margin, ROA and ROE. These
ratios indicate the capability of company to make profits.
Looking at the profit margin maintained by the company which is 8% as compare to industry
average which is 4%, it can be said that the company is a capable of making more profits than
the expected ones. It is operating profitably.
The ratio of return on asset tells about the efficiency of a company in generating its revenue
with the use of its total assets. Return on asset ratio is 15% which is less than the industry
ratio of 22%. This means that the company is not able to produce more revenue from its
assets as it is inefficient in managing its assets (Jenter and Lewellen, 2015). As far as, return
on ordinary equity ratio is concerned, it is 31% which is more than the industry benchmark of
20%. ROE indicates the potential of a company to generate return from the investments.
Maintaining a high ROE shows that company has a sound profitability position as it can
produce high returns from its investment. Investor can find it profitable to invest in (Penman,
Reggiani, Richardson and Tuna, 2017).
Analysis of company’s Liquidity
These ratios are used to show the liquidity position of a company. They are current ratio and
quick ratio. The current ratio is 2.21:1, which is lower than the industry benchmark of 2.5:1.
It shows that company is not efficient enough to meet the expectations of its creditors and
investors and to deal with its liquidity problems. Moreover, the quick ratio 0.99:1 is also
considerably lower than the industry’s ratio of 1.3:1, which indicates that the company cannot
meet its short term liabilities using its liquid assets, which can easily and quickly be
tabler-icon-diamond-filled.svg

Paraphrase This Document

Need a fresh take? Get an instant paraphrase of this document with our AI Paraphraser
Document Page
Accounting for managers 7
converted into cash, whenever required. Hence, the company does not maintain a good
liquidity position (Saleem and Rehman, 2011).
Analysis of financial gearing
Financial gearing means the proportion of debt and equity used by the company in its
operations. It determines the capital structure of the company. Debt ratio means the amount
of assets of the company which are provided through debt. It is 53% which is quite higher
than the industry average of 40%. It indicates that the company has high financial risk
because of its excessive use of debt in conducting its operations (Levi and Segal, 2015).
Question 2
Part A
A chef is a human resource and is considered as an asset to the business because he
contributes in the success of the business. However, accounting practices does not include
any measurement or recognition method for human resource assets. Therefore, the valuation
of this asset is not possible as it cannot be measured in terms of money. So as a result it
cannot be recorded in the financial statements.
Part B
1. Purchase equipment for cash.
Statement of financial position: Increase in assets and decrease in cash.
Statement of Cash flow: Decreased cash (financing activities).
2. Provide services to a client, with payment to be received within 40 days.
Statement of financial position: increase in asset and increase in equity.
Statement of financial performance: increase in income.
3. Pay a liability
Statement of financial position: Decrease in cash and decrease in liabilities.
Statement of cash flow: Decrease in Cash (operating activities).
4. Invest additional cash into the business by the owner.
Statement of financial position: increase in equity and increase in cash
Statement of cash flow: increased cash (financing activities).
Document Page
Accounting for managers 8
5. Collect an account receivable in cash
Statement of financial position: increase in assets (cash) and decrease in assets (debtors).
Statement of cash flow: increased cash (operating activities).
6. Pay wages to employees.
Statement of financial position: Decrease in asset (cash) and decrease in equity.
Statement of financial performance: Decrease in expenses (wages).
Statement of cash flows: decreased cash (operating activities).
7. Receive the electricity bill in the mail, to be paid within 30 days.
Statement of financial position: increase in liability and decrease in equity.
Statement of financial performance: increase in expense.
8. Sell a piece of equipment for cash.
Statement of financial position: Increase in cash and decrease in asset.
Statement of Cash flows: increased cash flow.
9. Withdraw cash by the owner for private use.
Statement of financial position: Decrease in capital account and decrease in cash (current
asset).
Statement of Cash flows: Decreased cash.
10. Borrow money on a long-term basis from a bank.
Statement of financial position: increase in asset (cash) and increase in liability (loan)
Statement of Cash flows: increased cash flow.
Document Page
Accounting for managers 9
References:
Jenter, D. and Lewellen, K., 2015. CEO preferences and acquisitions. The Journal of
Finance, 70(6), pp.2813-2852.
Levi, S. and Segal, B., 2015. The Impact of Debt-Equity Reporting Classifications on the
Firm's Decision to Issue Hybrid Securities. European Accounting Review, 24(4), pp.801-822.
Penman, S.H., Reggiani, F., Richardson, S.A. and Tuna, A., 2017. A Framework for
Identifying Accounting Characteristics for Asset Pricing Models, with an Evaluation of
Book-To-Price.
Saleem, Q. and Rehman, R.U., 2011. Impacts of liquidity ratios on
profitability. Interdisciplinary Journal of Research in Business, 1(7), pp.95-98.
chevron_up_icon
1 out of 10
circle_padding
hide_on_mobile
zoom_out_icon
logo.png

Your All-in-One AI-Powered Toolkit for Academic Success.

Available 24*7 on WhatsApp / Email

[object Object]