A Study on Text Classification Using Naïve Bayes in Natural Language
VerifiedAdded on 2023/04/22
|15
|1230
|324
Report
AI Summary
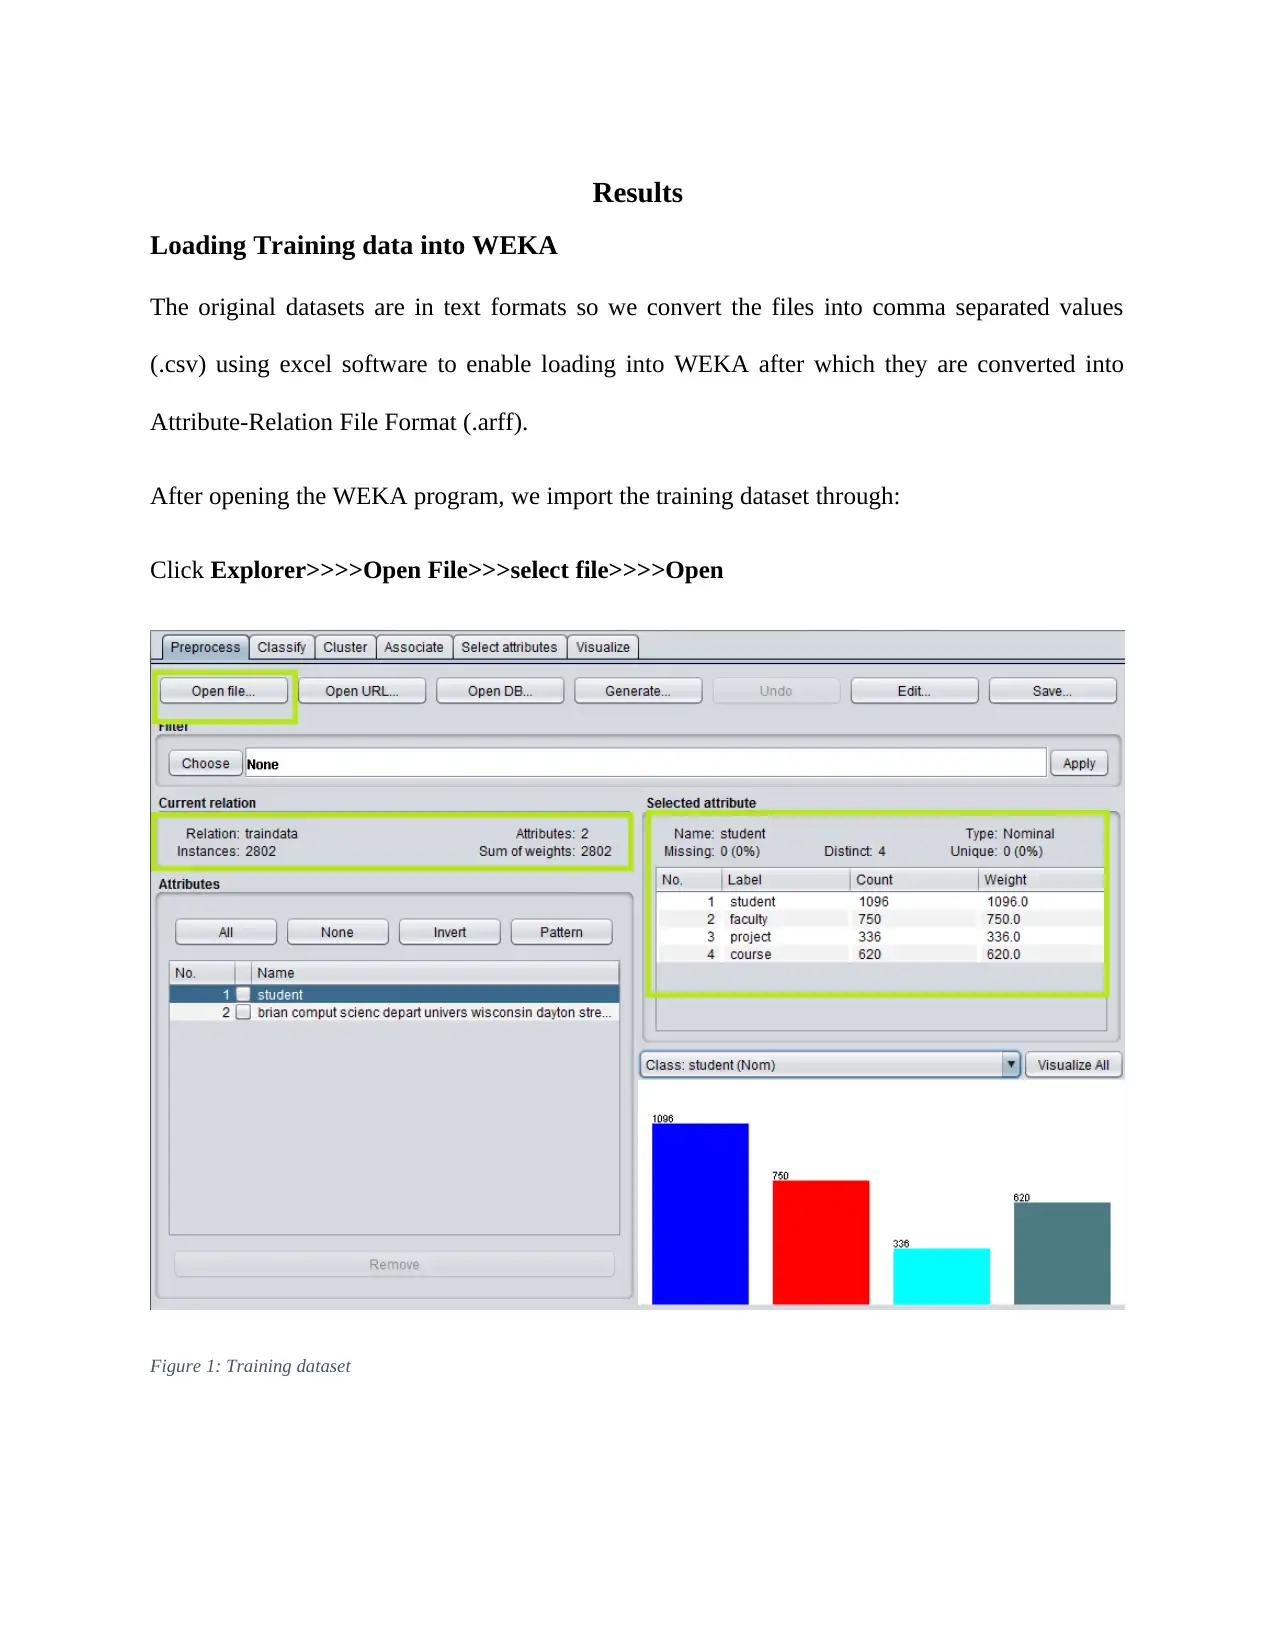
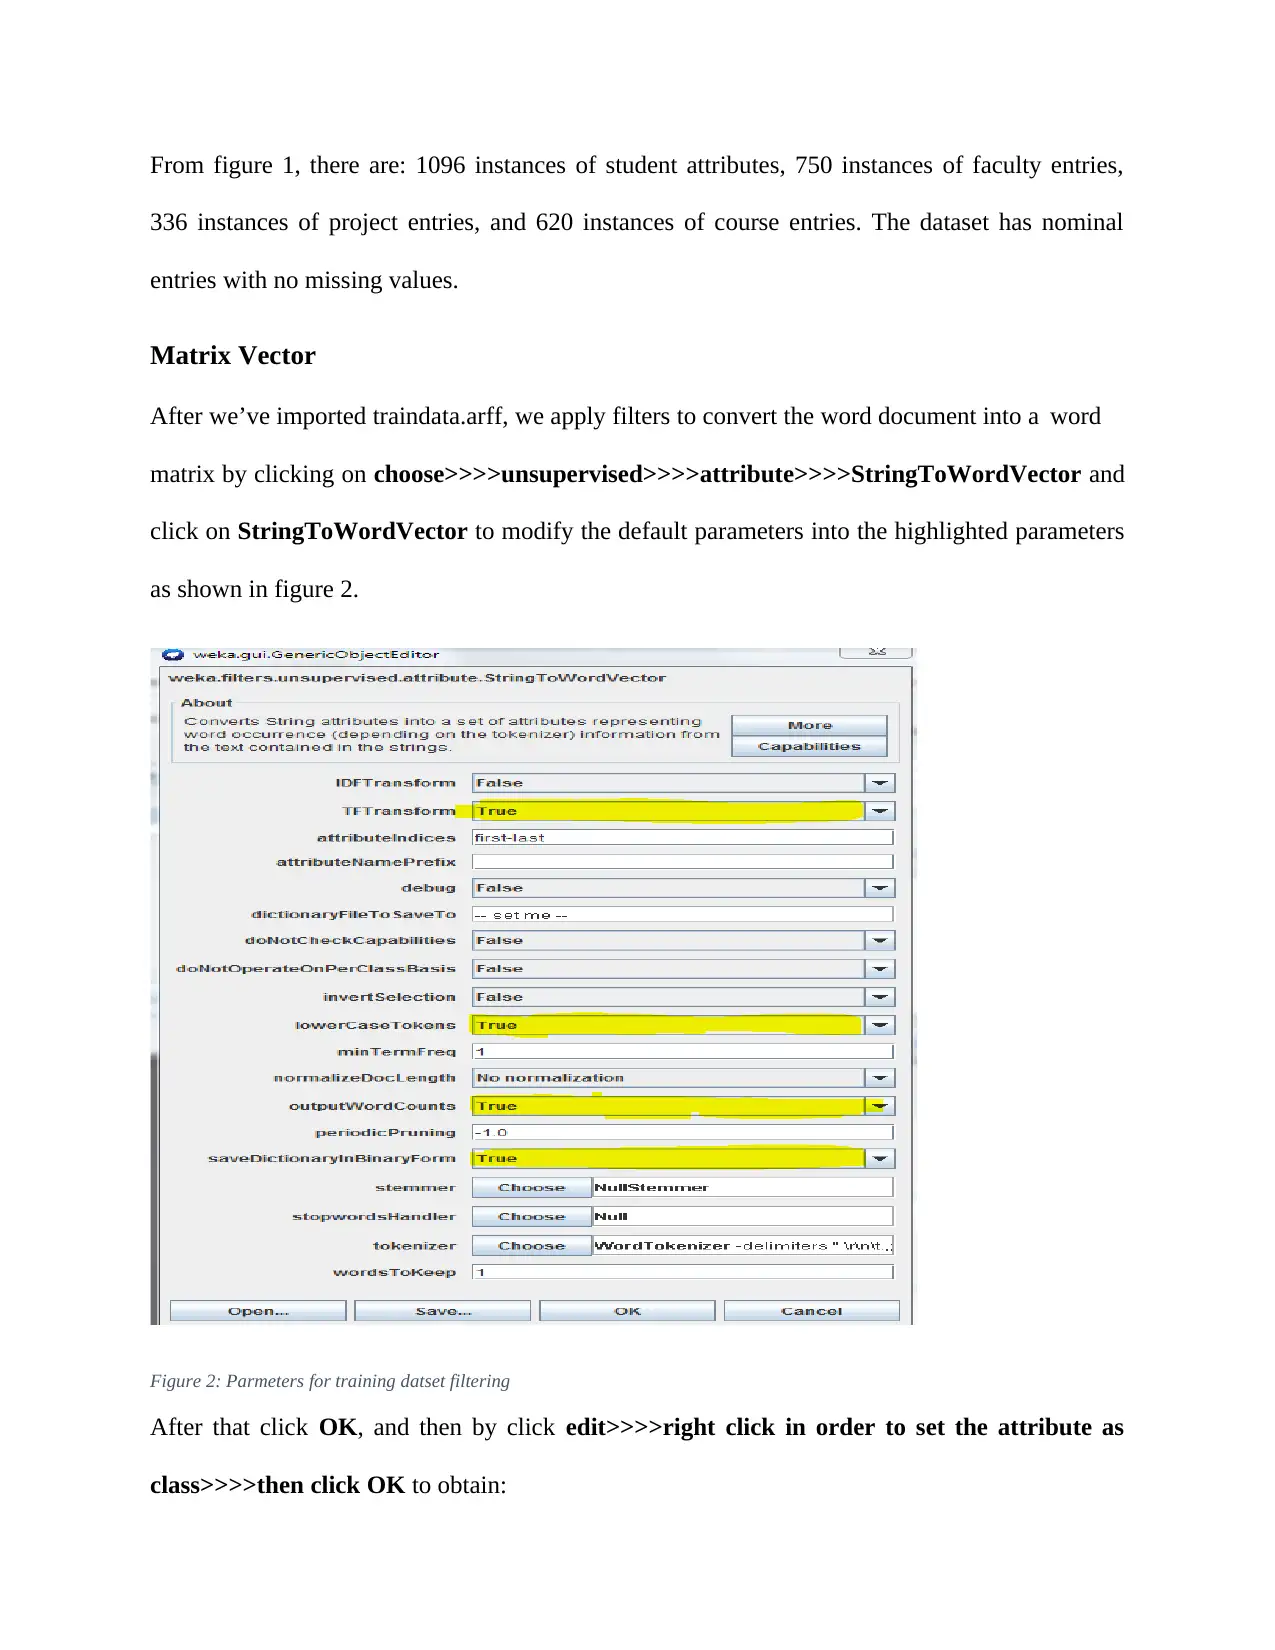
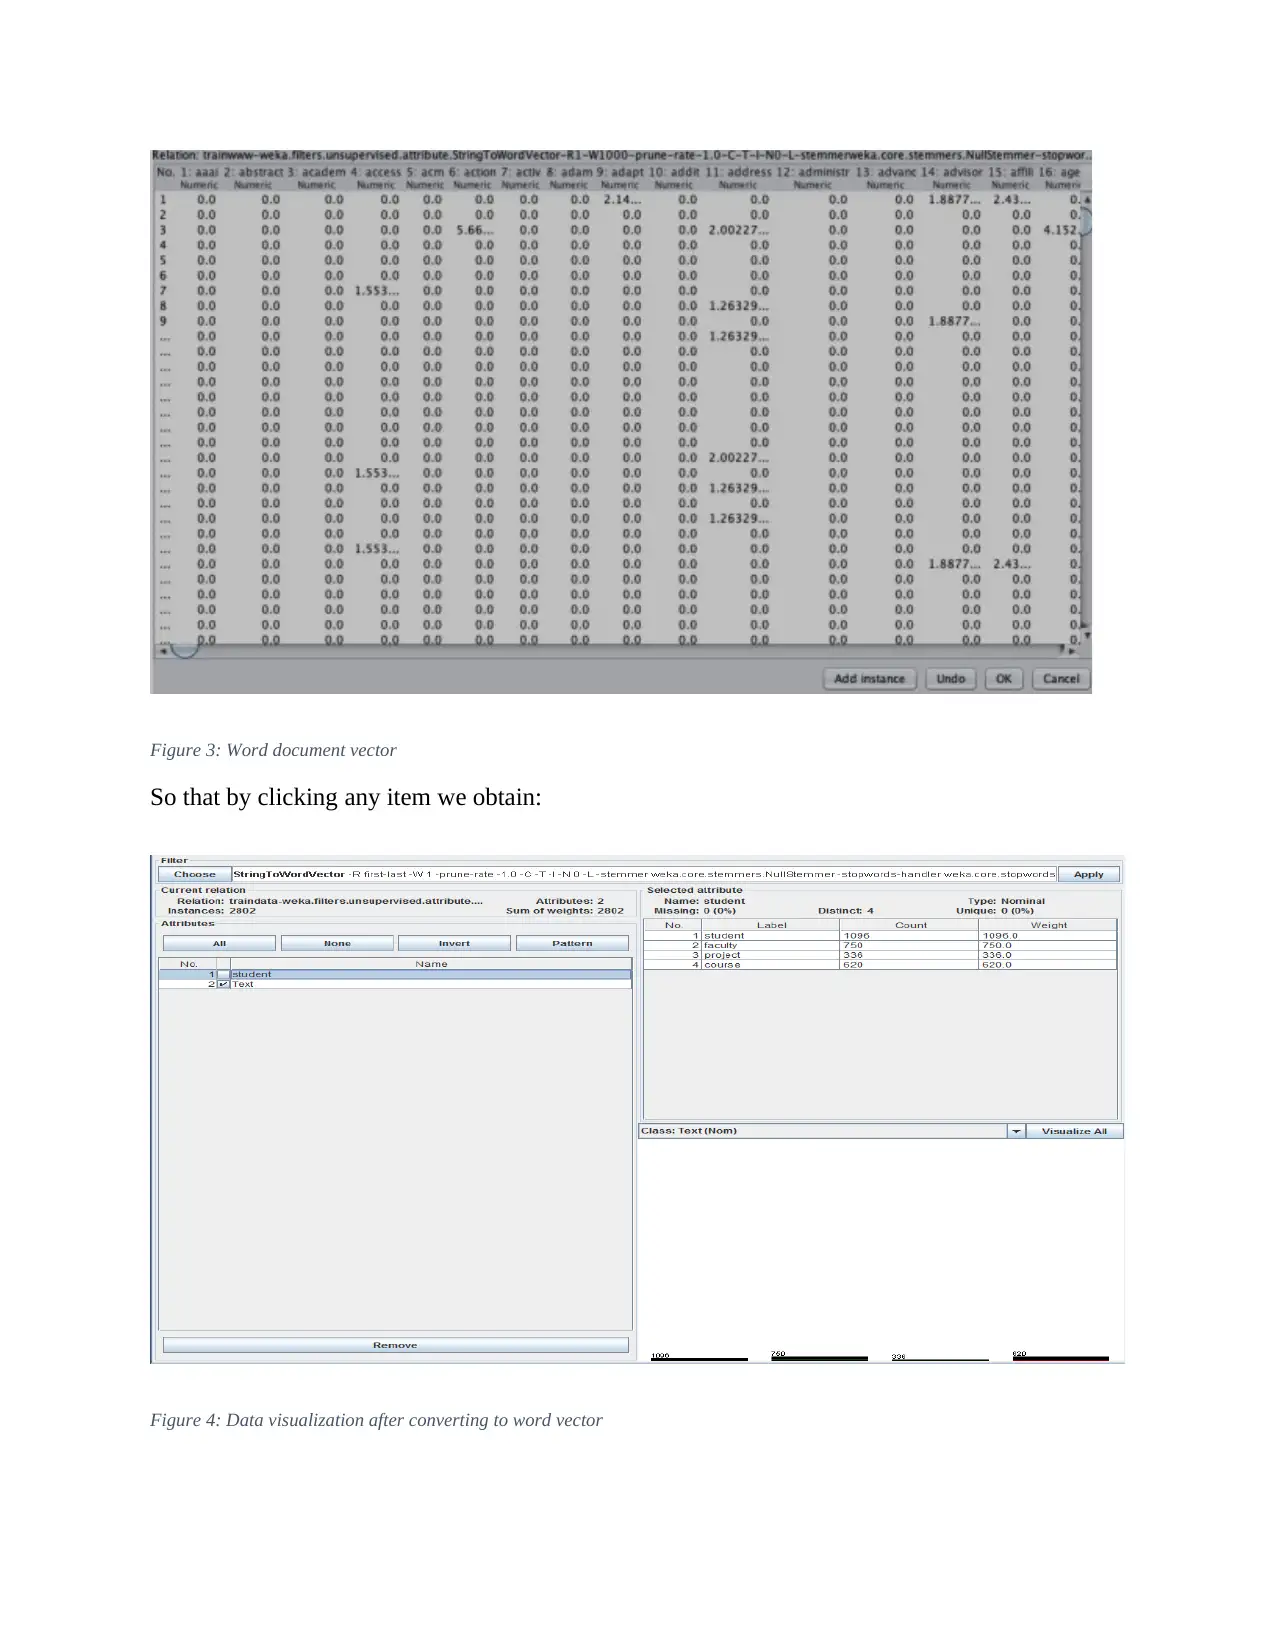
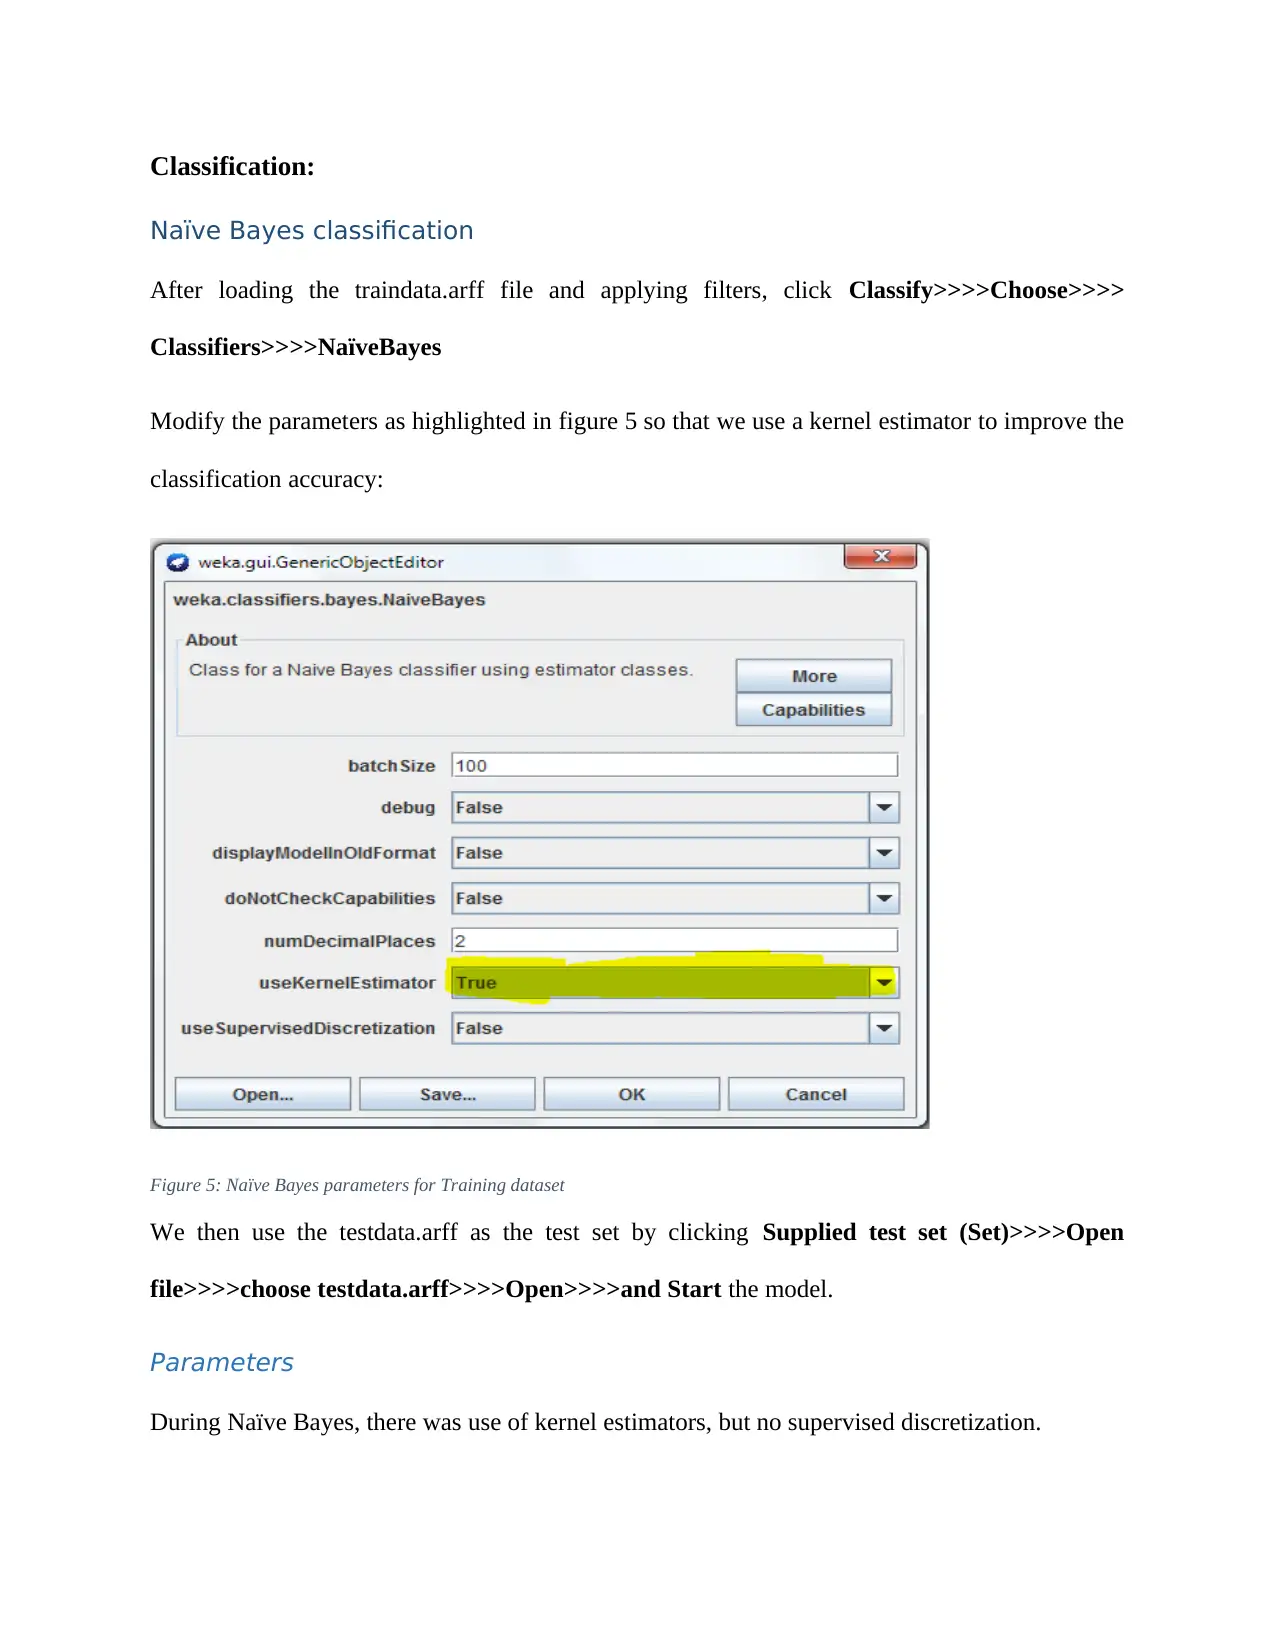
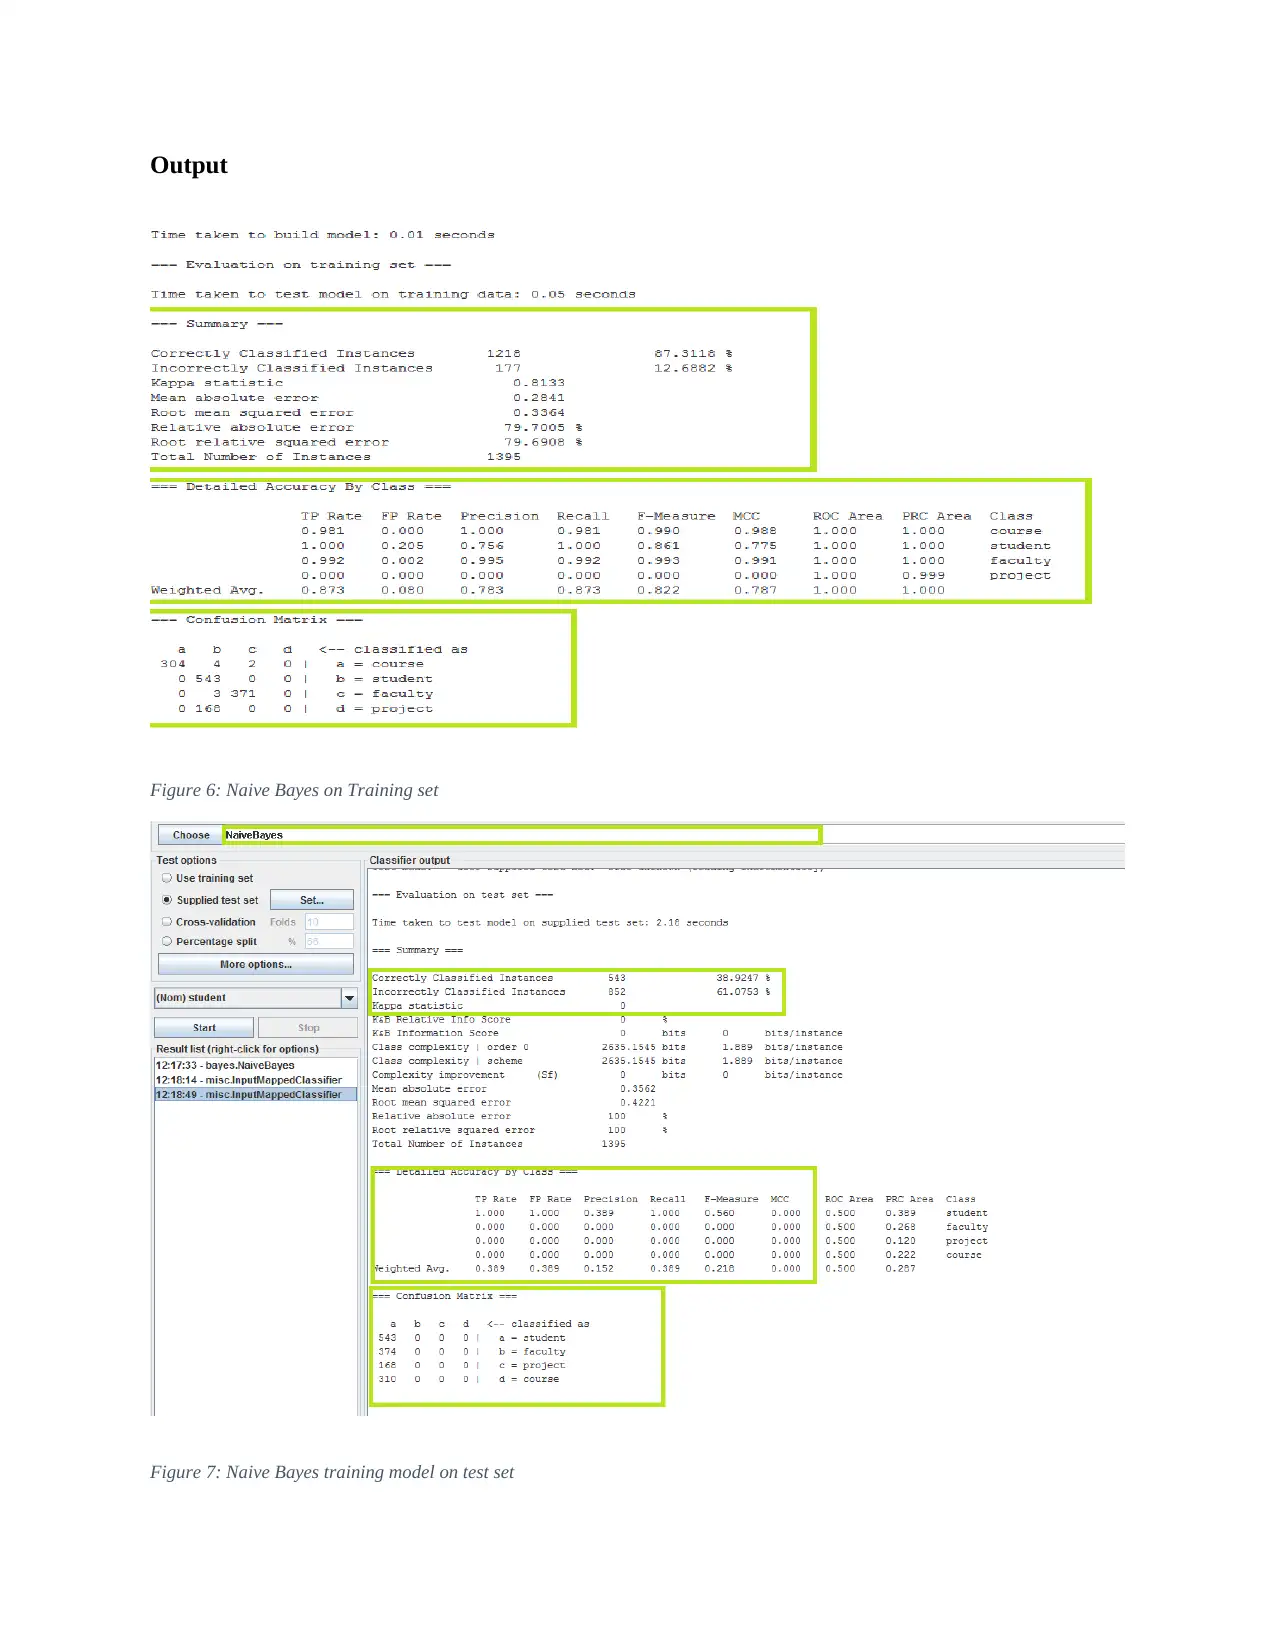
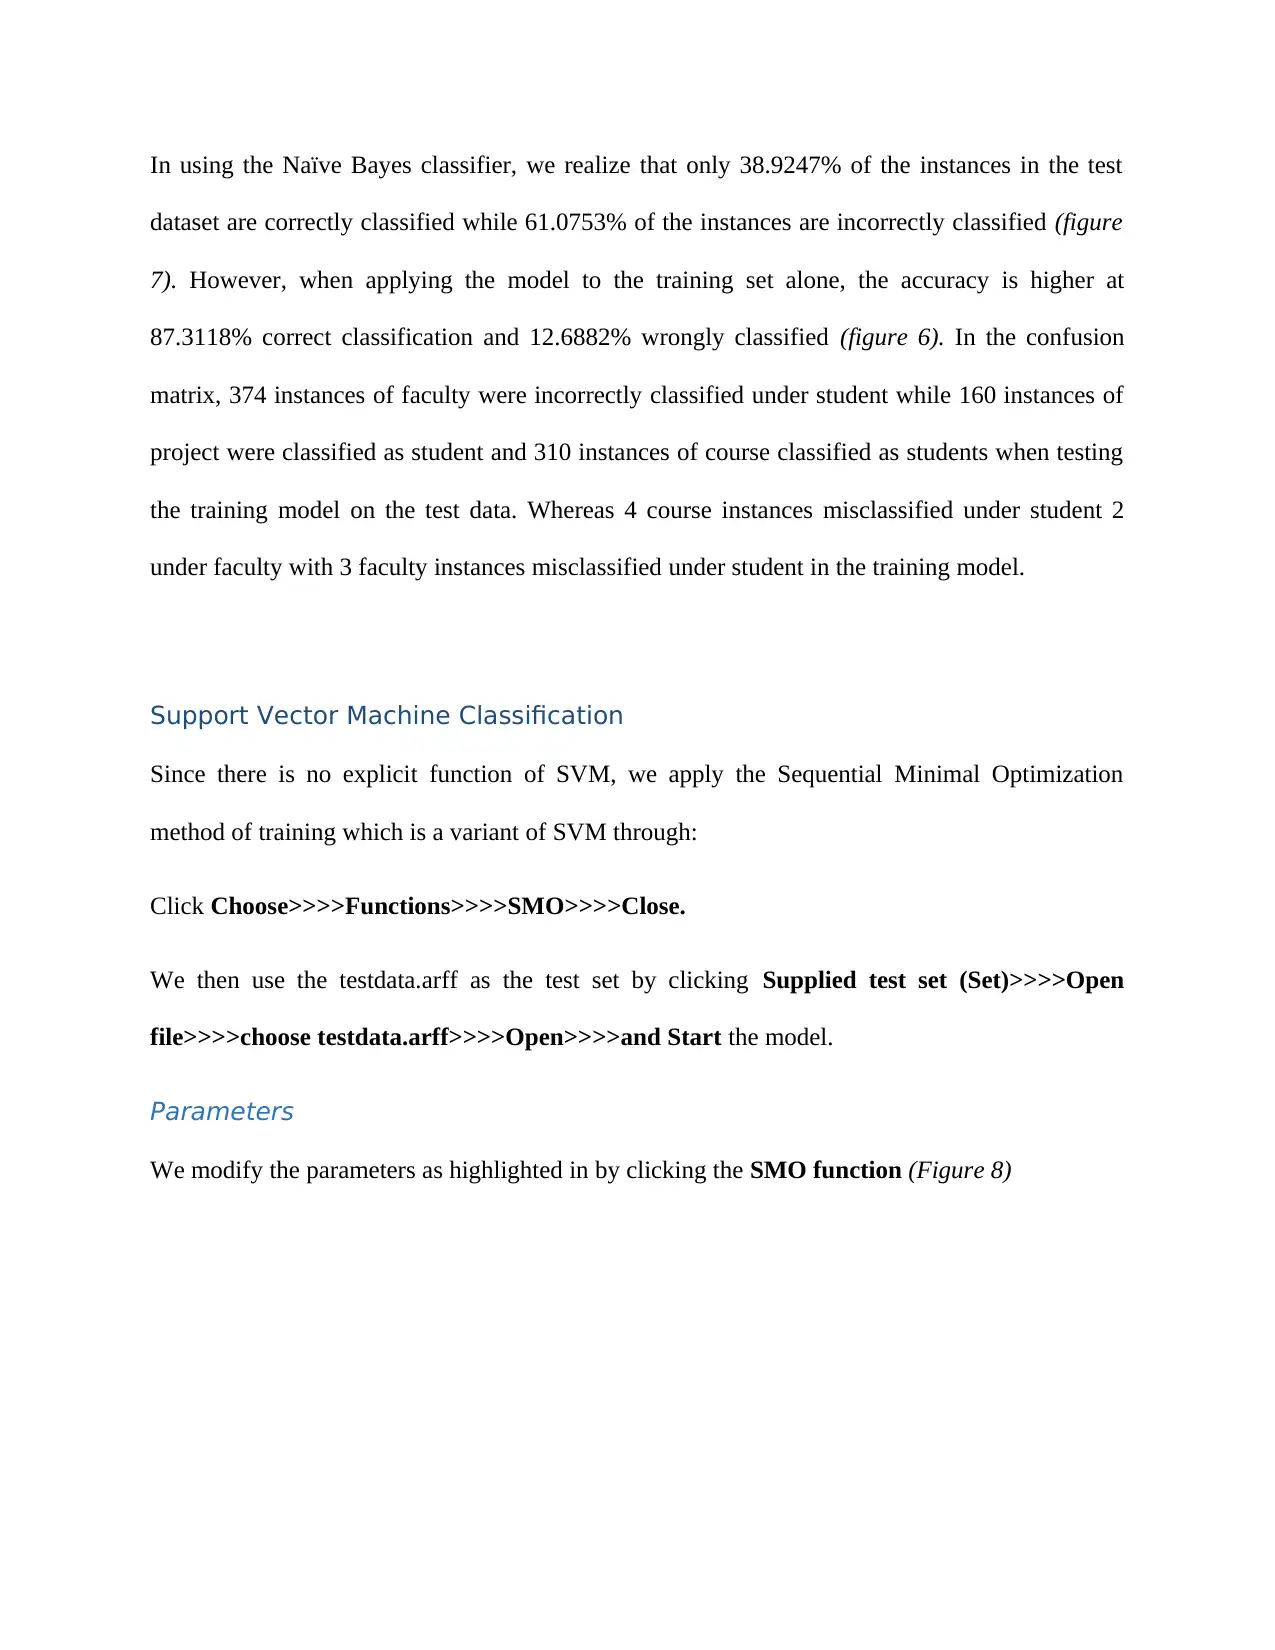
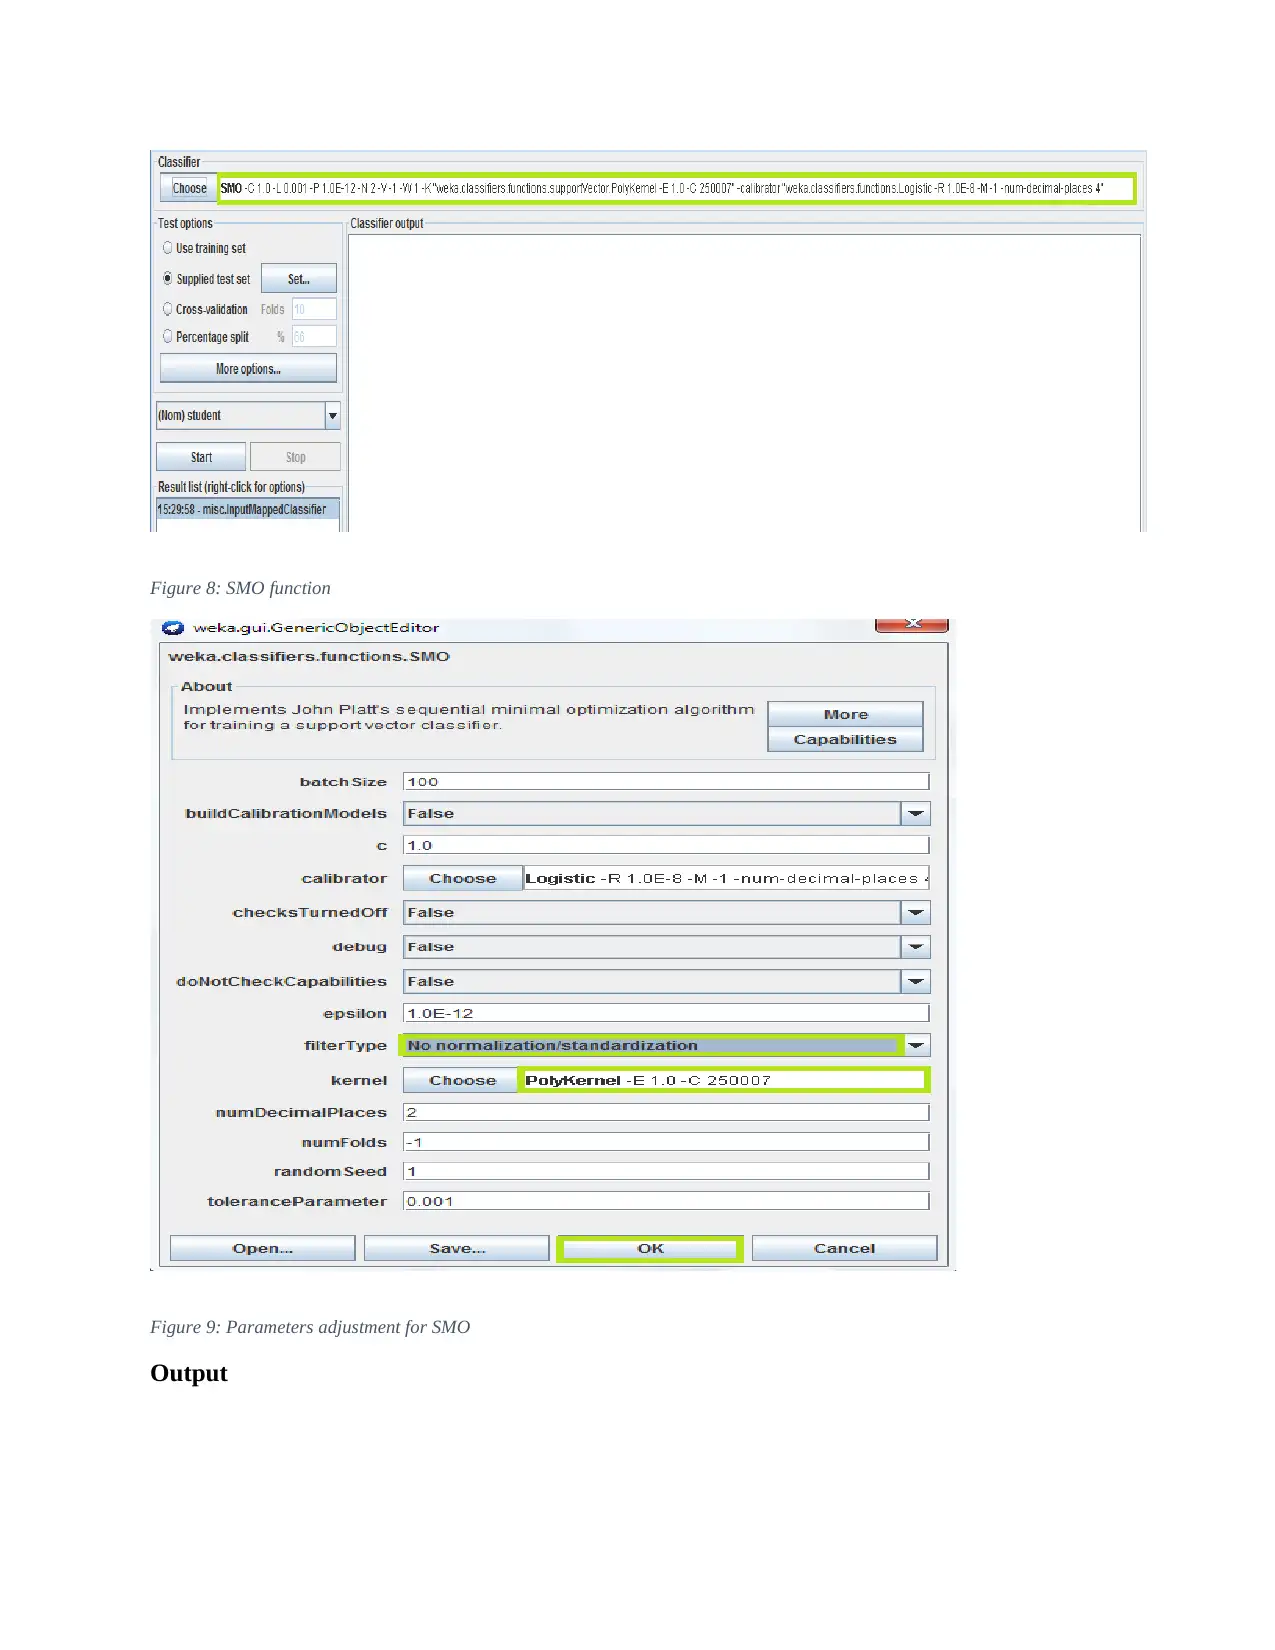
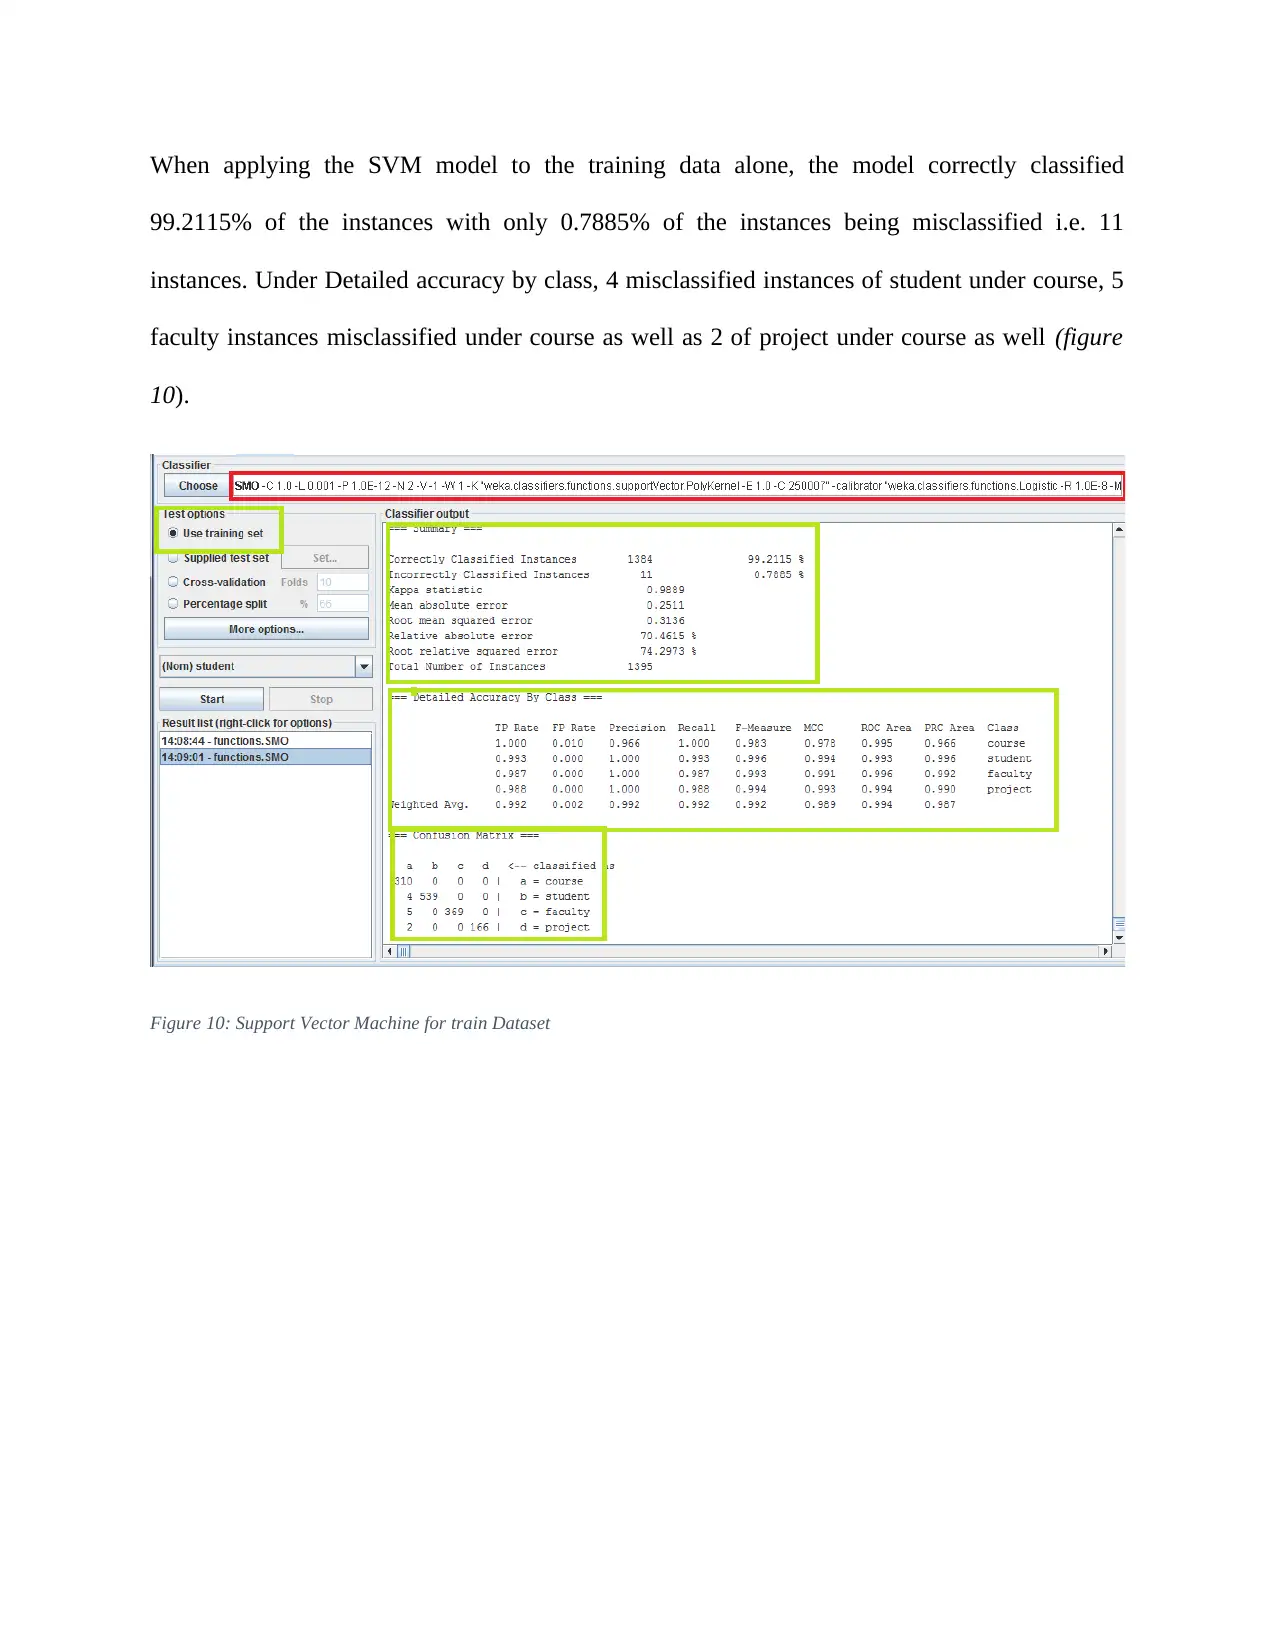
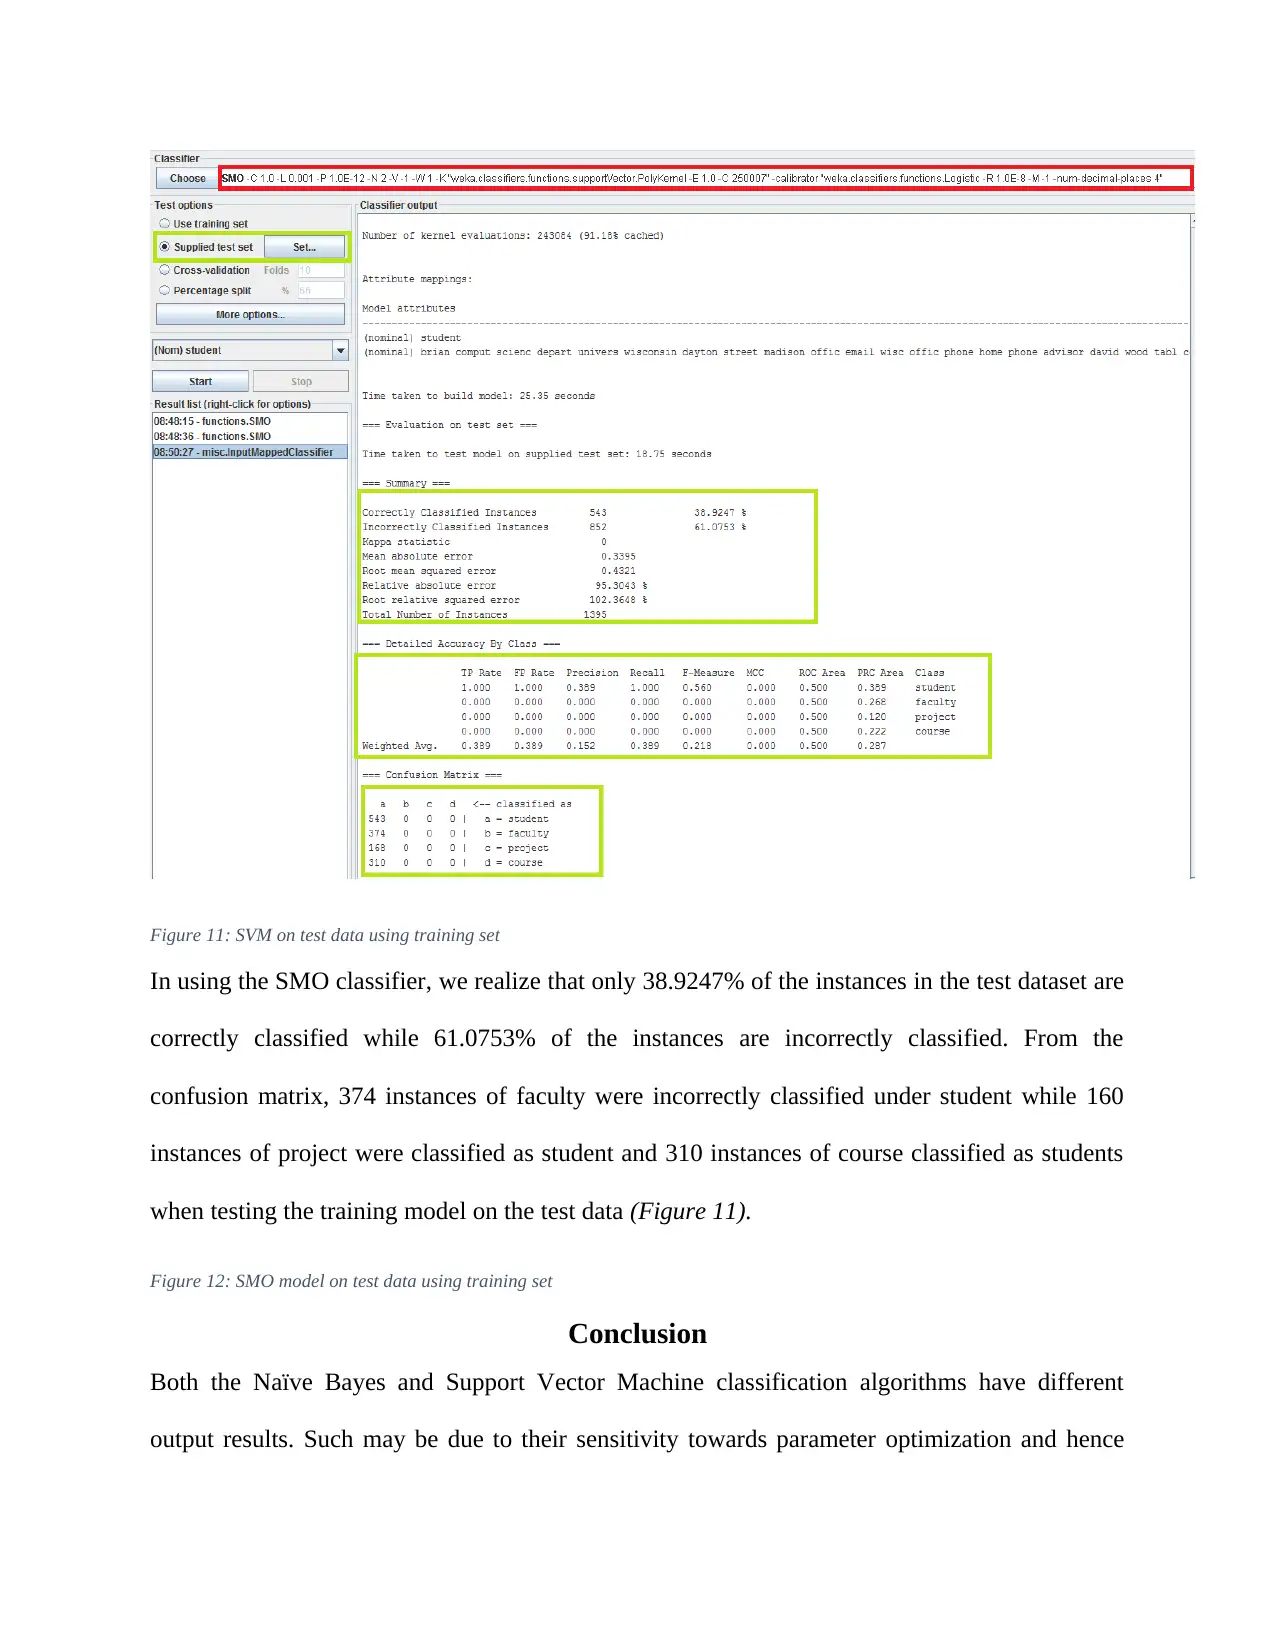
This report details an experiment in text classification using the Naïve Bayes algorithm and Support Vector Machines (SVM) within the context of Natural Language Processing (NLP). The study involves converting text-based datasets into a suitable format for WEKA, a data mining tool, and then applying both Naïve Bayes and SVM classifiers. The report outlines the data preprocessing steps, including converting files to CSV format, loading them into WEKA, and transforming them into Attribute-Relation File Format (ARFF). It also covers the configuration of parameters for both classifiers, emphasizing the use of kernel estimators in Naïve Bayes and Sequential Minimal Optimization (SMO) in SVM. The results indicate that while SVM performed better on the training data, both classifiers achieved similar accuracy on the test data. The report concludes by discussing the potential reasons for the observed differences and highlighting the strengths and weaknesses of each algorithm for text classification.

Paraphrase This Document
Need a fresh take? Get an instant paraphrase of this document with our AI Paraphraser

Text Classification
Using Naïve Bayes
and Support Vector
Machine
2019
Natural Language Processing
Student
[Company name] | [Company address]
Using Naïve Bayes
and Support Vector
Machine
2019
Natural Language Processing
Student
[Company name] | [Company address]

Contents
Results..............................................................................................................................................2
Loading Training data into WEKA.............................................................................................2
Matrix Vector...............................................................................................................................3
Classification:..............................................................................................................................6
Naïve Bayes classification.......................................................................................................6
Support Vector Machine Classification...................................................................................8
Conclusion.....................................................................................................................................11
Bibliography..................................................................................................................................13
⊘ This is a preview!⊘
Do you want full access?
Subscribe today to unlock all pages.

Trusted by 1+ million students worldwide

Results
Loading Training data into WEKA
The original datasets are in text formats so we convert the files into comma separated values
(.csv) using excel software to enable loading into WEKA after which they are converted into
Attribute-Relation File Format (.arff).
After opening the WEKA program, we import the training dataset through:
Click Explorer>>>>Open File>>>select file>>>>Open
Figure 1: Training dataset
Paraphrase This Document
Need a fresh take? Get an instant paraphrase of this document with our AI Paraphraser

From figure 1, there are: 1096 instances of student attributes, 750 instances of faculty entries,
336 instances of project entries, and 620 instances of course entries. The dataset has nominal
entries with no missing values.
Matrix Vector
After we’ve imported traindata.arff, we apply filters to convert the word document into a word
matrix by clicking on choose>>>>unsupervised>>>>attribute>>>>StringToWordVector and
click on StringToWordVector to modify the default parameters into the highlighted parameters
as shown in figure 2.
Figure 2: Parmeters for training datset filtering
After that click OK, and then by click edit>>>>right click in order to set the attribute as
class>>>>then click OK to obtain:

Figure 3: Word document vector
So that by clicking any item we obtain:
Figure 4: Data visualization after converting to word vector
So that by clicking any item we obtain:
Figure 4: Data visualization after converting to word vector
⊘ This is a preview!⊘
Do you want full access?
Subscribe today to unlock all pages.

Trusted by 1+ million students worldwide

Classification:
Naïve Bayes classification
After loading the traindata.arff file and applying filters, click Classify>>>>Choose>>>>
Classifiers>>>>NaïveBayes
Modify the parameters as highlighted in figure 5 so that we use a kernel estimator to improve the
classification accuracy:
Figure 5: Naïve Bayes parameters for Training dataset
We then use the testdata.arff as the test set by clicking Supplied test set (Set)>>>>Open
file>>>>choose testdata.arff>>>>Open>>>>and Start the model.
Parameters
During Naïve Bayes, there was use of kernel estimators, but no supervised discretization.
Paraphrase This Document
Need a fresh take? Get an instant paraphrase of this document with our AI Paraphraser

Output
Figure 6: Naive Bayes on Training set
Figure 7: Naive Bayes training model on test set
Figure 6: Naive Bayes on Training set
Figure 7: Naive Bayes training model on test set

In using the Naïve Bayes classifier, we realize that only 38.9247% of the instances in the test
dataset are correctly classified while 61.0753% of the instances are incorrectly classified (figure
7). However, when applying the model to the training set alone, the accuracy is higher at
87.3118% correct classification and 12.6882% wrongly classified (figure 6). In the confusion
matrix, 374 instances of faculty were incorrectly classified under student while 160 instances of
project were classified as student and 310 instances of course classified as students when testing
the training model on the test data. Whereas 4 course instances misclassified under student 2
under faculty with 3 faculty instances misclassified under student in the training model.
Support Vector Machine Classification
Since there is no explicit function of SVM, we apply the Sequential Minimal Optimization
method of training which is a variant of SVM through:
Click Choose>>>>Functions>>>>SMO>>>>Close.
We then use the testdata.arff as the test set by clicking Supplied test set (Set)>>>>Open
file>>>>choose testdata.arff>>>>Open>>>>and Start the model.
Parameters
We modify the parameters as highlighted in by clicking the SMO function (Figure 8)
⊘ This is a preview!⊘
Do you want full access?
Subscribe today to unlock all pages.

Trusted by 1+ million students worldwide

Figure 8: SMO function
Figure 9: Parameters adjustment for SMO
Output
Figure 9: Parameters adjustment for SMO
Output
Paraphrase This Document
Need a fresh take? Get an instant paraphrase of this document with our AI Paraphraser

When applying the SVM model to the training data alone, the model correctly classified
99.2115% of the instances with only 0.7885% of the instances being misclassified i.e. 11
instances. Under Detailed accuracy by class, 4 misclassified instances of student under course, 5
faculty instances misclassified under course as well as 2 of project under course as well (figure
10).
Figure 10: Support Vector Machine for train Dataset

Figure 11: SVM on test data using training set
In using the SMO classifier, we realize that only 38.9247% of the instances in the test dataset are
correctly classified while 61.0753% of the instances are incorrectly classified. From the
confusion matrix, 374 instances of faculty were incorrectly classified under student while 160
instances of project were classified as student and 310 instances of course classified as students
when testing the training model on the test data (Figure 11).
Figure 12: SMO model on test data using training set
Conclusion
Both the Naïve Bayes and Support Vector Machine classification algorithms have different
output results. Such may be due to their sensitivity towards parameter optimization and hence
⊘ This is a preview!⊘
Do you want full access?
Subscribe today to unlock all pages.

Trusted by 1+ million students worldwide
1 out of 15
Related Documents

Your All-in-One AI-Powered Toolkit for Academic Success.
+13062052269
info@desklib.com
Available 24*7 on WhatsApp / Email
Unlock your academic potential
Copyright © 2020–2025 A2Z Services. All Rights Reserved. Developed and managed by ZUCOL.