Big Data Report: Analysis of Data Types and Business Implications
VerifiedAdded on 2023/04/23
|8
|353
|79
Report
AI Summary
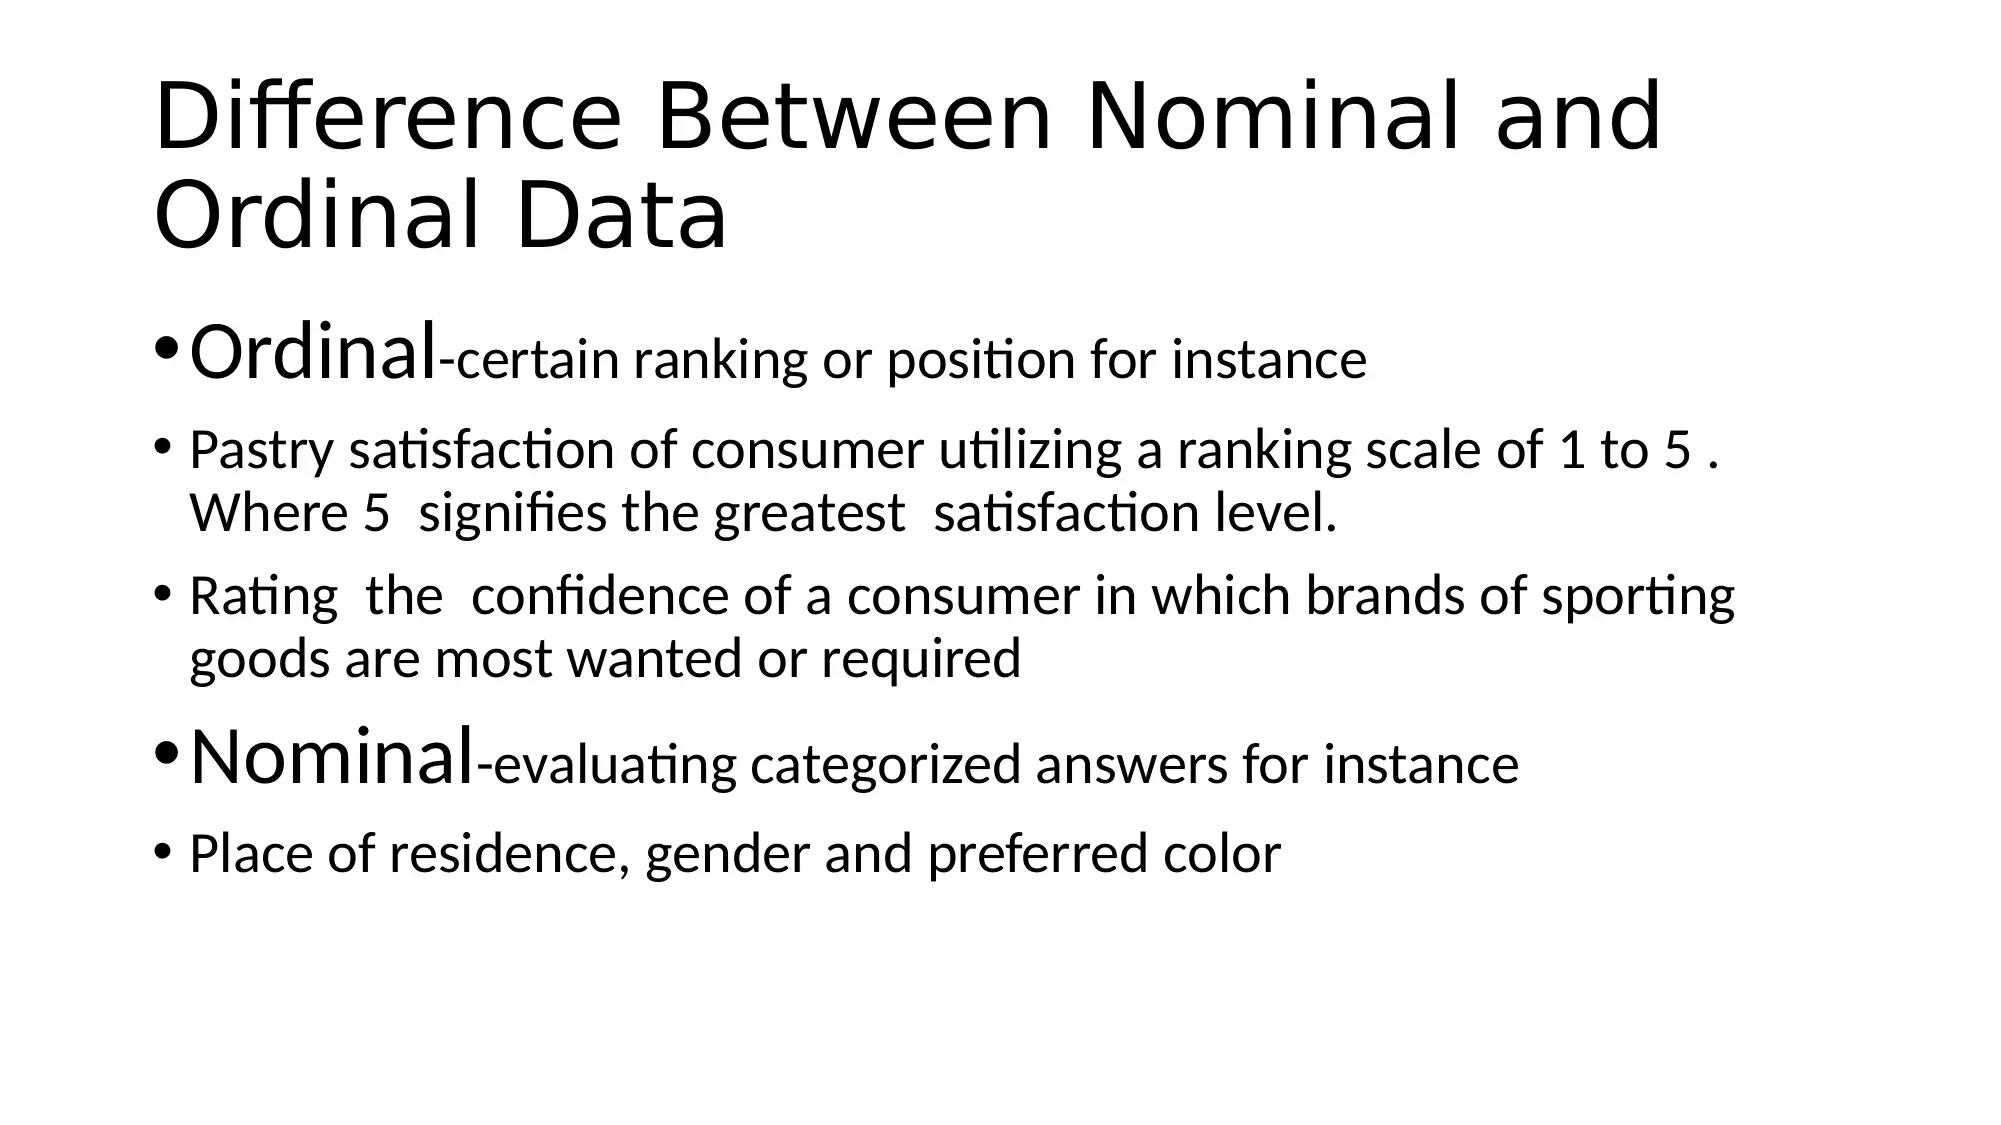
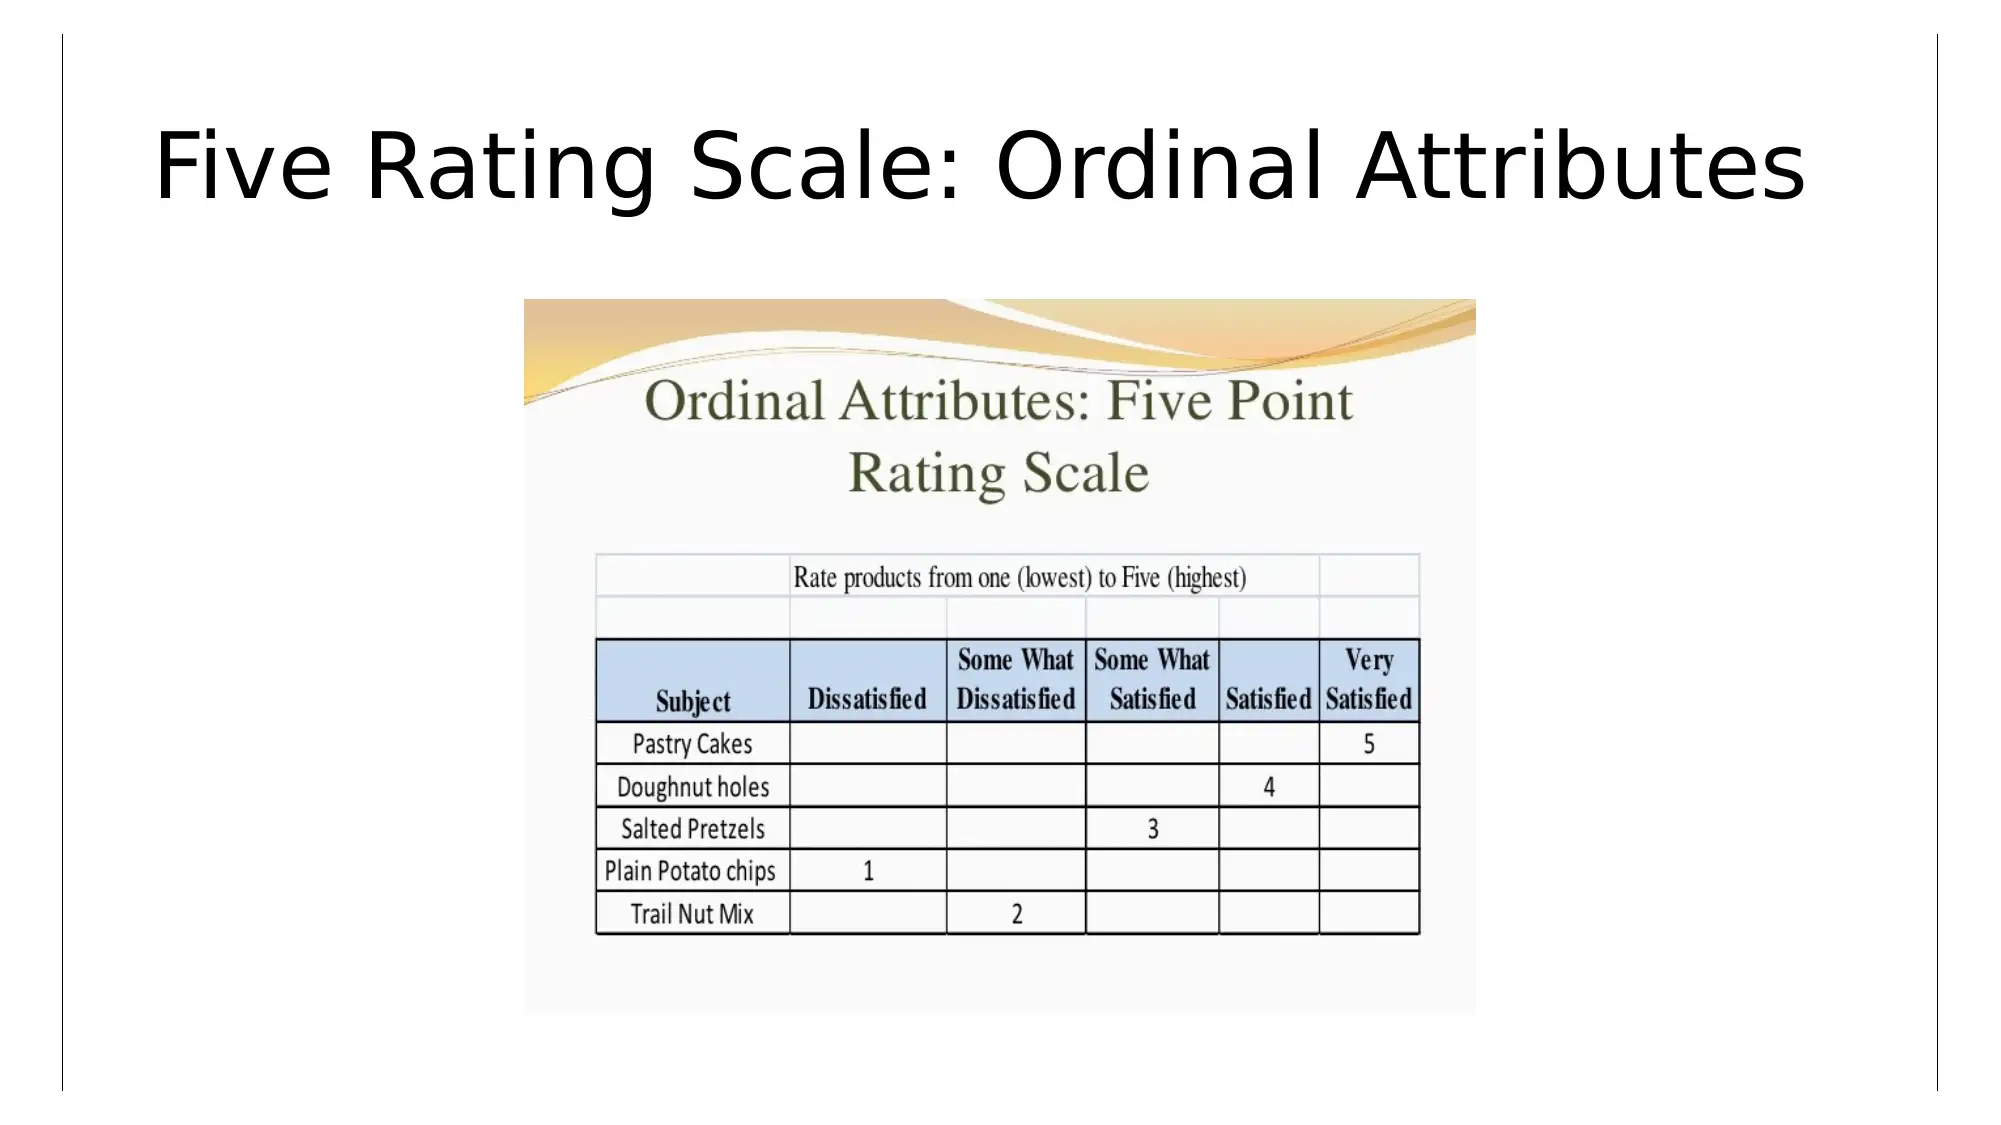
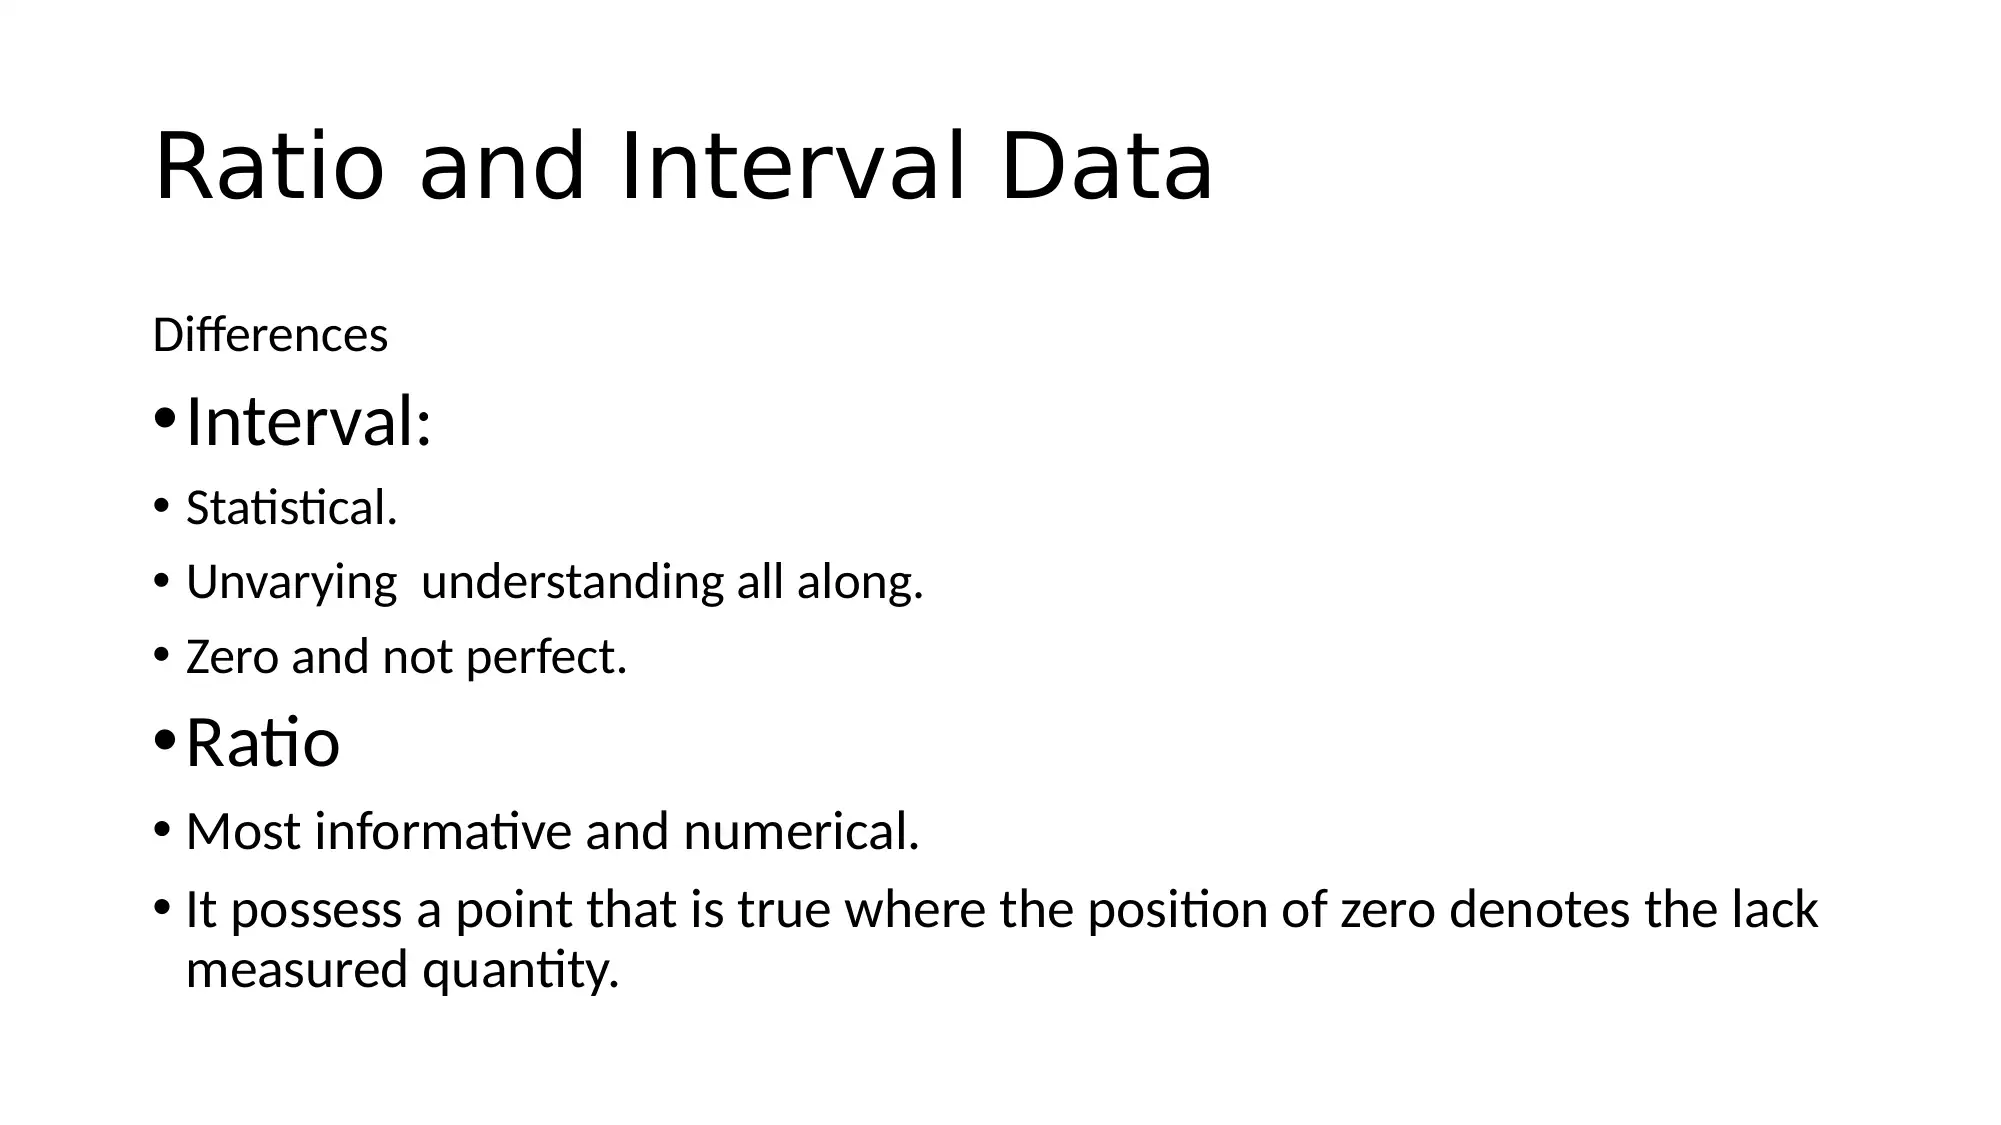
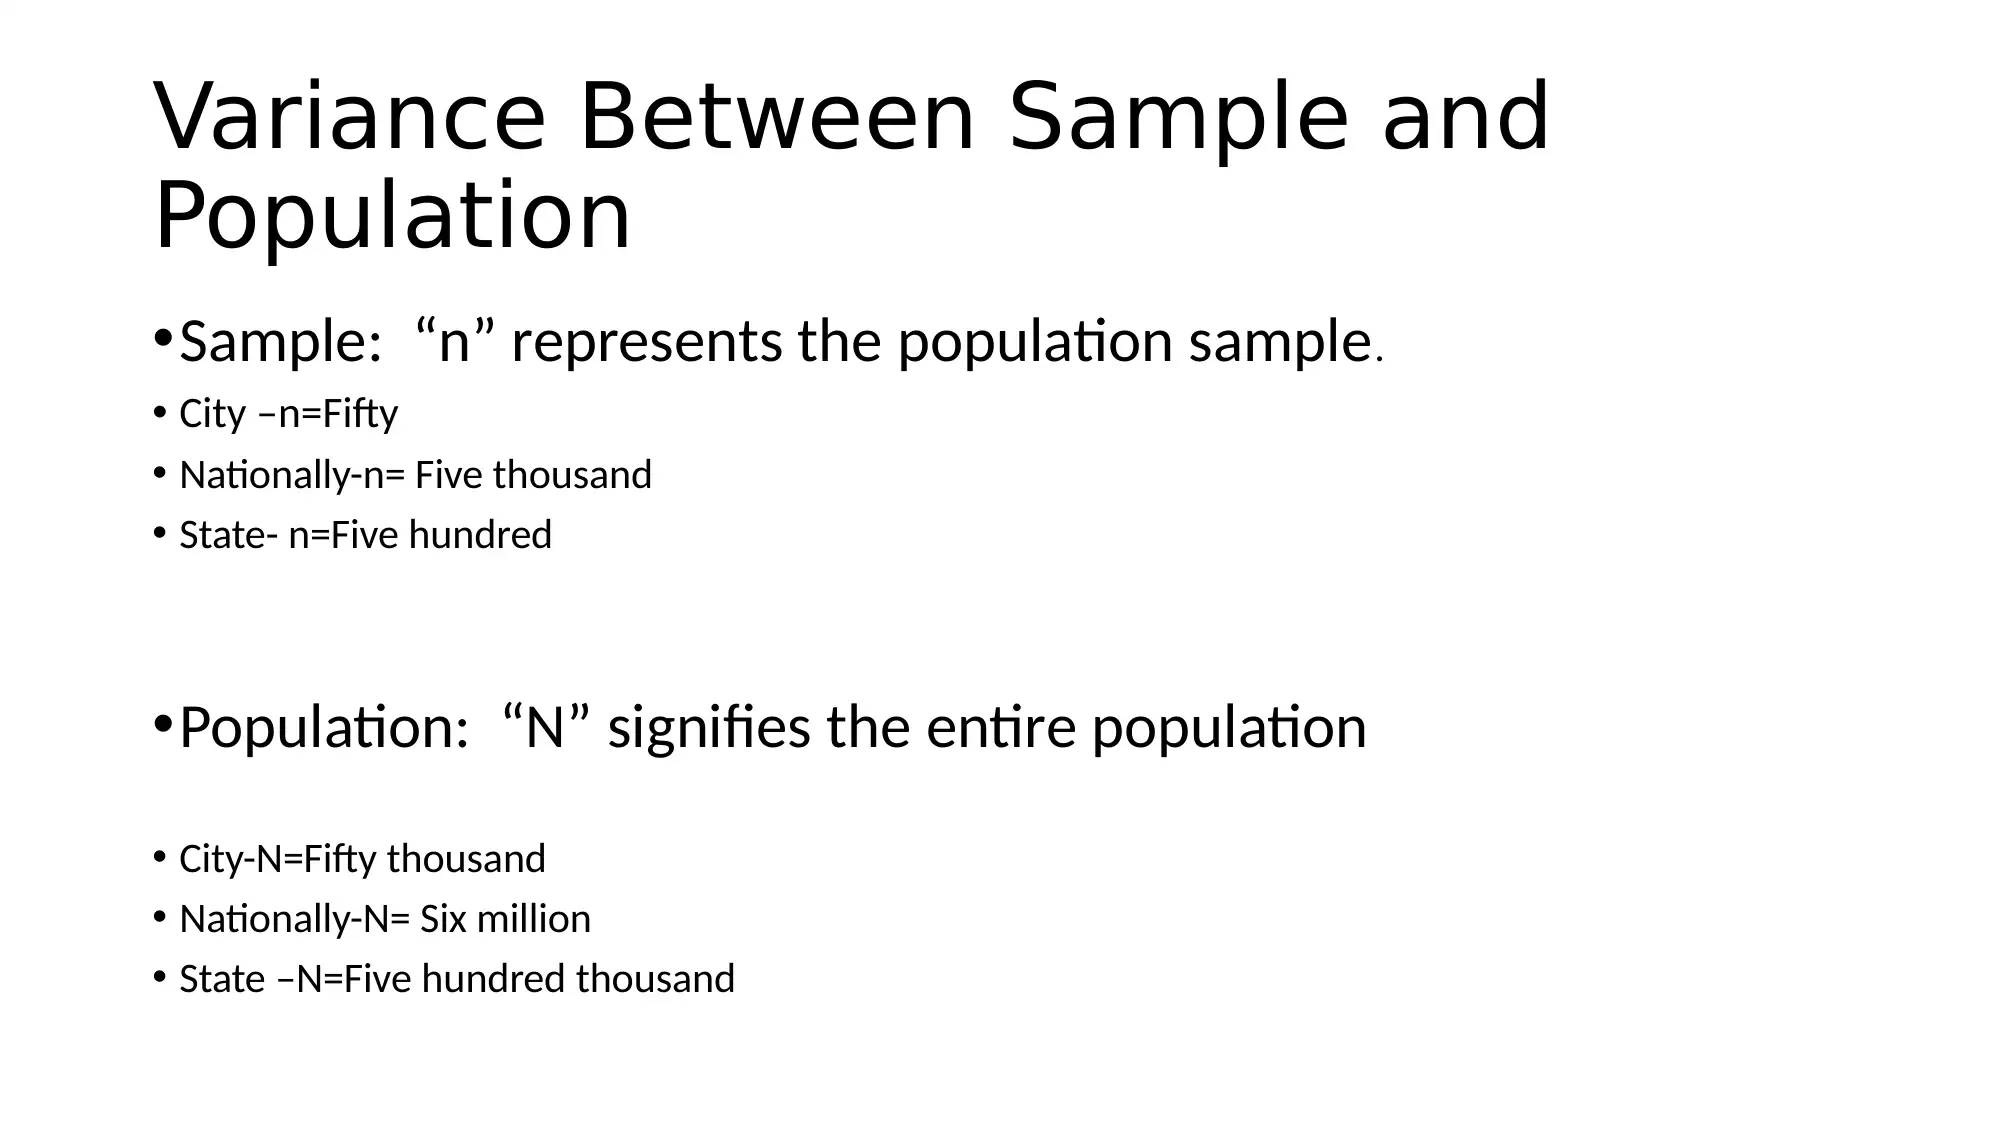
This report analyzes nominal and ordinal data, including their key differences and applications within a business context. It discusses the characteristics of nominal and ordinal data, providing examples like consumer satisfaction and brand preferences. The report further elaborates on the differences ...

Statistics
Paraphrase This Document
Need a fresh take? Get an instant paraphrase of this document with our AI Paraphraser

Difference Between Nominal and
Ordinal Data
•Ordinal-certain ranking or position for instance
• Pastry satisfaction of consumer utilizing a ranking scale of 1 to 5 .
Where 5 signifies the greatest satisfaction level.
• Rating the confidence of a consumer in which brands of sporting
goods are most wanted or required
•Nominal-evaluating categorized answers for instance
• Place of residence, gender and preferred color

Five Rating Scale: Ordinal Attributes
⊘ This is a preview!⊘
Do you want full access?
Subscribe today to unlock all pages.

Trusted by 1+ million students worldwide

The Association between Ordinal
and Nominal Data Utilizing a Scale
Rating
• Nominal Data :
• Nominal data is data whose observations or values can be given a number where the
code are just but For example, the number (code) one could denote female while
the number zero could denote male.
• An individual can tally data that is nominal, nevertheless, but he cannot measure or
put data in order.
• Ordinal data
• Ordinal data is data whose observations or values can be positioned through fixing to
it a rating sale
• This data can be placed and counted similar to what is displayed on the earlier slide
instance satisfaction of the consumer, however ordinal data cannot be quantified.
Paraphrase This Document
Need a fresh take? Get an instant paraphrase of this document with our AI Paraphraser

Qualitative Characteristics
• Qualitative data is statistical
• Utilizing numerical data scientifically ( that is Organization W would
need to contemplate):
• Evaluating food moisture of snacks.
• Value for calories for instance trans fat, fat, vitamin content and
sugar etc.
• Qualitative data is statistical
• Utilizing numerical data scientifically ( that is Organization W would
need to contemplate):
• Evaluating food moisture of snacks.
• Value for calories for instance trans fat, fat, vitamin content and
sugar etc.

Ratio and Interval Data
Differences
•Interval:
• Statistical.
• Unvarying understanding all along.
• Zero and not perfect.
•Ratio
• Most informative and numerical.
• It possess a point that is true where the position of zero denotes the lack
measured quantity.
Differences
•Interval:
• Statistical.
• Unvarying understanding all along.
• Zero and not perfect.
•Ratio
• Most informative and numerical.
• It possess a point that is true where the position of zero denotes the lack
measured quantity.
⊘ This is a preview!⊘
Do you want full access?
Subscribe today to unlock all pages.

Trusted by 1+ million students worldwide

Variance Between Sample and
Population
•Sample: “n” represents the population sample.
• City –n=Fifty
• Nationally-n= Five thousand
• State- n=Five hundred
•Population: “N” signifies the entire population
• City-N=Fifty thousand
• Nationally-N= Six million
• State –N=Five hundred thousand
Population
•Sample: “n” represents the population sample.
• City –n=Fifty
• Nationally-n= Five thousand
• State- n=Five hundred
•Population: “N” signifies the entire population
• City-N=Fifty thousand
• Nationally-N= Six million
• State –N=Five hundred thousand
Paraphrase This Document
Need a fresh take? Get an instant paraphrase of this document with our AI Paraphraser

References
1 out of 8
Related Documents

Your All-in-One AI-Powered Toolkit for Academic Success.
+13062052269
info@desklib.com
Available 24*7 on WhatsApp / Email
Unlock your academic potential
© 2024 | Zucol Services PVT LTD | All rights reserved.