Case Study: Analyzing the Economics of the Nordic Bridge Market

Verified

Added on  2021/04/21

|12
|647
|45
Case Study
AI Summary
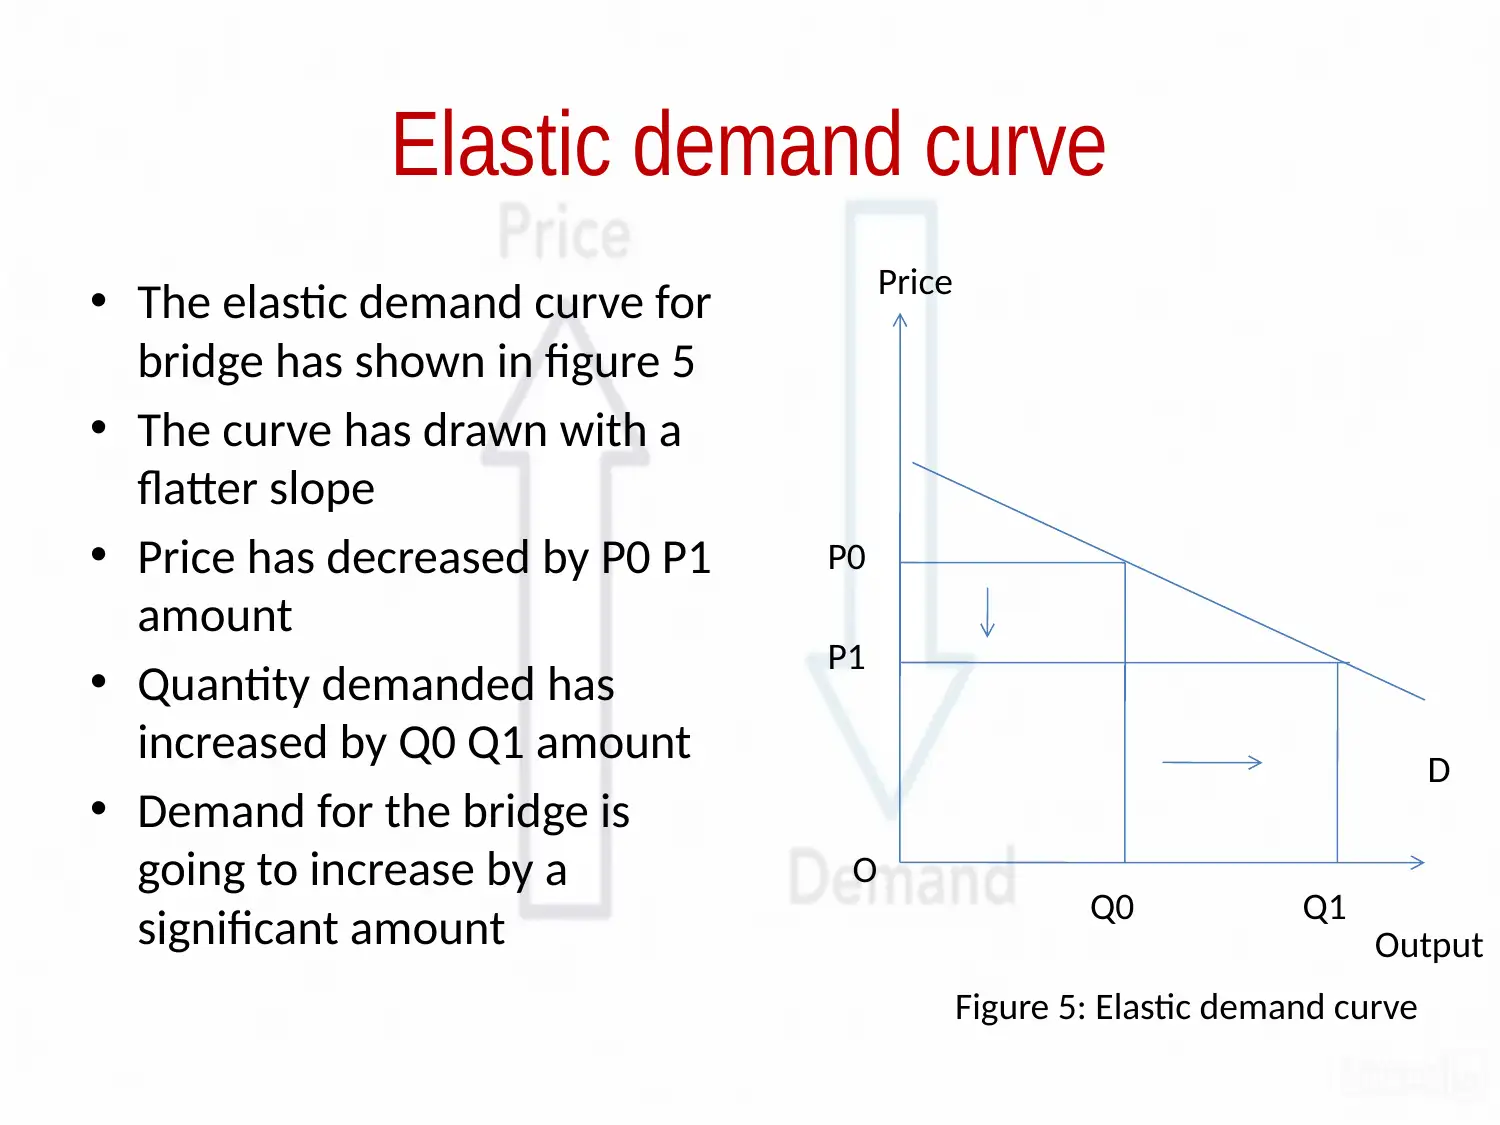
This case study analyzes the economic aspects of the Nordic Bridge, focusing on the application of economic principles to a real-world scenario. The study examines the market structure, specifically identifying it as a perfectly competitive market with two producers, Denmark and Sweden. It explores the concepts of individual and market demand curves, illustrating their shapes and the factors influencing them. The case study also delves into the supply curve, explaining its characteristics and how it relates to the bridge's capacity. Furthermore, it investigates the impact of non-price determinants, such as increased travel demand and cross-cultural communication, on market outcomes. Price elasticity of demand is a key focus, demonstrating how changes in price affect the number of bridge users and, consequently, revenue. The analysis includes the impact of a price reduction by Sweden, illustrating how it can increase demand and revenue due to the elastic nature of the demand curve. The case study uses diagrams to illustrate the various economic concepts discussed, providing a visual representation of the market dynamics at play.
Document Page
A CASE STUDY ON THE NORDIC BRIDGE
BUSINESS ECONOMICS
tabler-icon-diamond-filled.svg

Paraphrase This Document

Need a fresh take? Get an instant paraphrase of this document with our AI Paraphraser
Document Page
Perfectly Competitive Demand Curve
There are 2 producers of the bridge, that is, Denmark
and Sweden
There are large numbers of travelers between these
two countries
The bridge has other substitutes in market, which are,
rails and ferry
Each constructor and traveler has perfect knowledge
related to the market
The price, charged by the bridge, has determined by
the market supply and market demand
Document Page
Individual Demand Curve
Individual demand curve has a
horizontally straight line
The curve is represented by the
average revenue and marginal
revenue curve
Denmark and Sweden individually
has experienced this horizontally
straight demand curve
Each country acts as the price
taker and cannot influence the
market price individually as they
have possessed small portion of
the entire market
Price
O Output
AR=MR=D
Figure1: Individual demand curve
Document Page
Downward slopping demand
Individual demand curve, faced by each country,
can be shown as horizontally straight line
Market demand curve of this bridge can be
represented as downward sloping line
Demand for the bridge has a negative relation
with price
Travelers can use rail or ferry due to higher prices
of the bridge
tabler-icon-diamond-filled.svg

Paraphrase This Document

Need a fresh take? Get an instant paraphrase of this document with our AI Paraphraser
Document Page
The market demand curve
Figure 1 is representing the
market demand curve of the
bride
Increase in price by P0P1 unit
can decrease the number of
travelers by Q0 Q1 unit
Each country cannot influence
this demand curve individually
This increasing price of the
bridge can increase the
demand for rail and ferry
Price
O
Output
P1
P0
Q1 Q0
Figure 2: The market demand curve
Document Page
Violation of the Supply Curve
The supply curve of the bridge
is a vertically straight line
Denmark and Sweden cannot
increase the supply of this
bridge
Increasing price of the bridge
cannot increase its supply
Figure 2 has represented the
supply curve with vertically
straight line
Fixed amount of travelers can
be represented by Q*
Price
Output
O Q*
P1
P0
Figure 3: The supply curve of the bridge
Document Page
Non-price determinants
Sweden uses the bridge more compare to
Denmark
The number of travelers has increased by 75%
compare to that of last year during same time
Two leading newspaper of both countries are
jointly publishing a daily supplement
The condition of information technology, health
and education have increased significantly
Cross-cultural communication has also increased
tabler-icon-diamond-filled.svg

Paraphrase This Document

Need a fresh take? Get an instant paraphrase of this document with our AI Paraphraser
Document Page
Impact on market outcome
People of Sweden are
demanding more to use this
bridge
The demand curve has shifted
rightward
Supply curve has remained same
with its initial shape
Through market demand and
market supply, outcomes can be
determined
Figure 3 is representing this
situation where at Q* market
output, price can be increased
Price
O
P1
P0
D0
D1
OutputQ*
Figure 4: Shifts of demand curve
Document Page
Price elasticity of demand
The demand curve of the bridge is elastic
Travelers have other options to travel, for
instance, rail and ferry, from one country to
another
Small increase in price can decrease the number
of passengers in bridge by a significant amount
The amount of revenue can be varied
significantly through price change
Document Page
Elastic demand curve
The elastic demand curve for
bridge has shown in figure 5
The curve has drawn with a
flatter slope
Price has decreased by P0 P1
amount
Quantity demanded has
increased by Q0 Q1 amount
Demand for the bridge is
going to increase by a
significant amount
Price
O
P0
P1
Q0 Q1 Output
D
Figure 5: Elastic demand curve
tabler-icon-diamond-filled.svg

Paraphrase This Document

Need a fresh take? Get an instant paraphrase of this document with our AI Paraphraser
Document Page
Price elasticity and revenue
Sweden has reduced price by 50% for a one
way crossing
Due to elastic demand curve of the bridge,
this reduction can help the country to increase
the demand for this bridge
Number of travelers is going to be increased
With more travelers, the country can earn
more revenue
Document Page
chevron_up_icon
1 out of 12
circle_padding
hide_on_mobile
zoom_out_icon
[object Object]