Northeastern Airlines: Maximizing Profit with Network Models Analysis

Verified

Added on  2023/06/10

|8
|1742
|370
Report
AI Summary
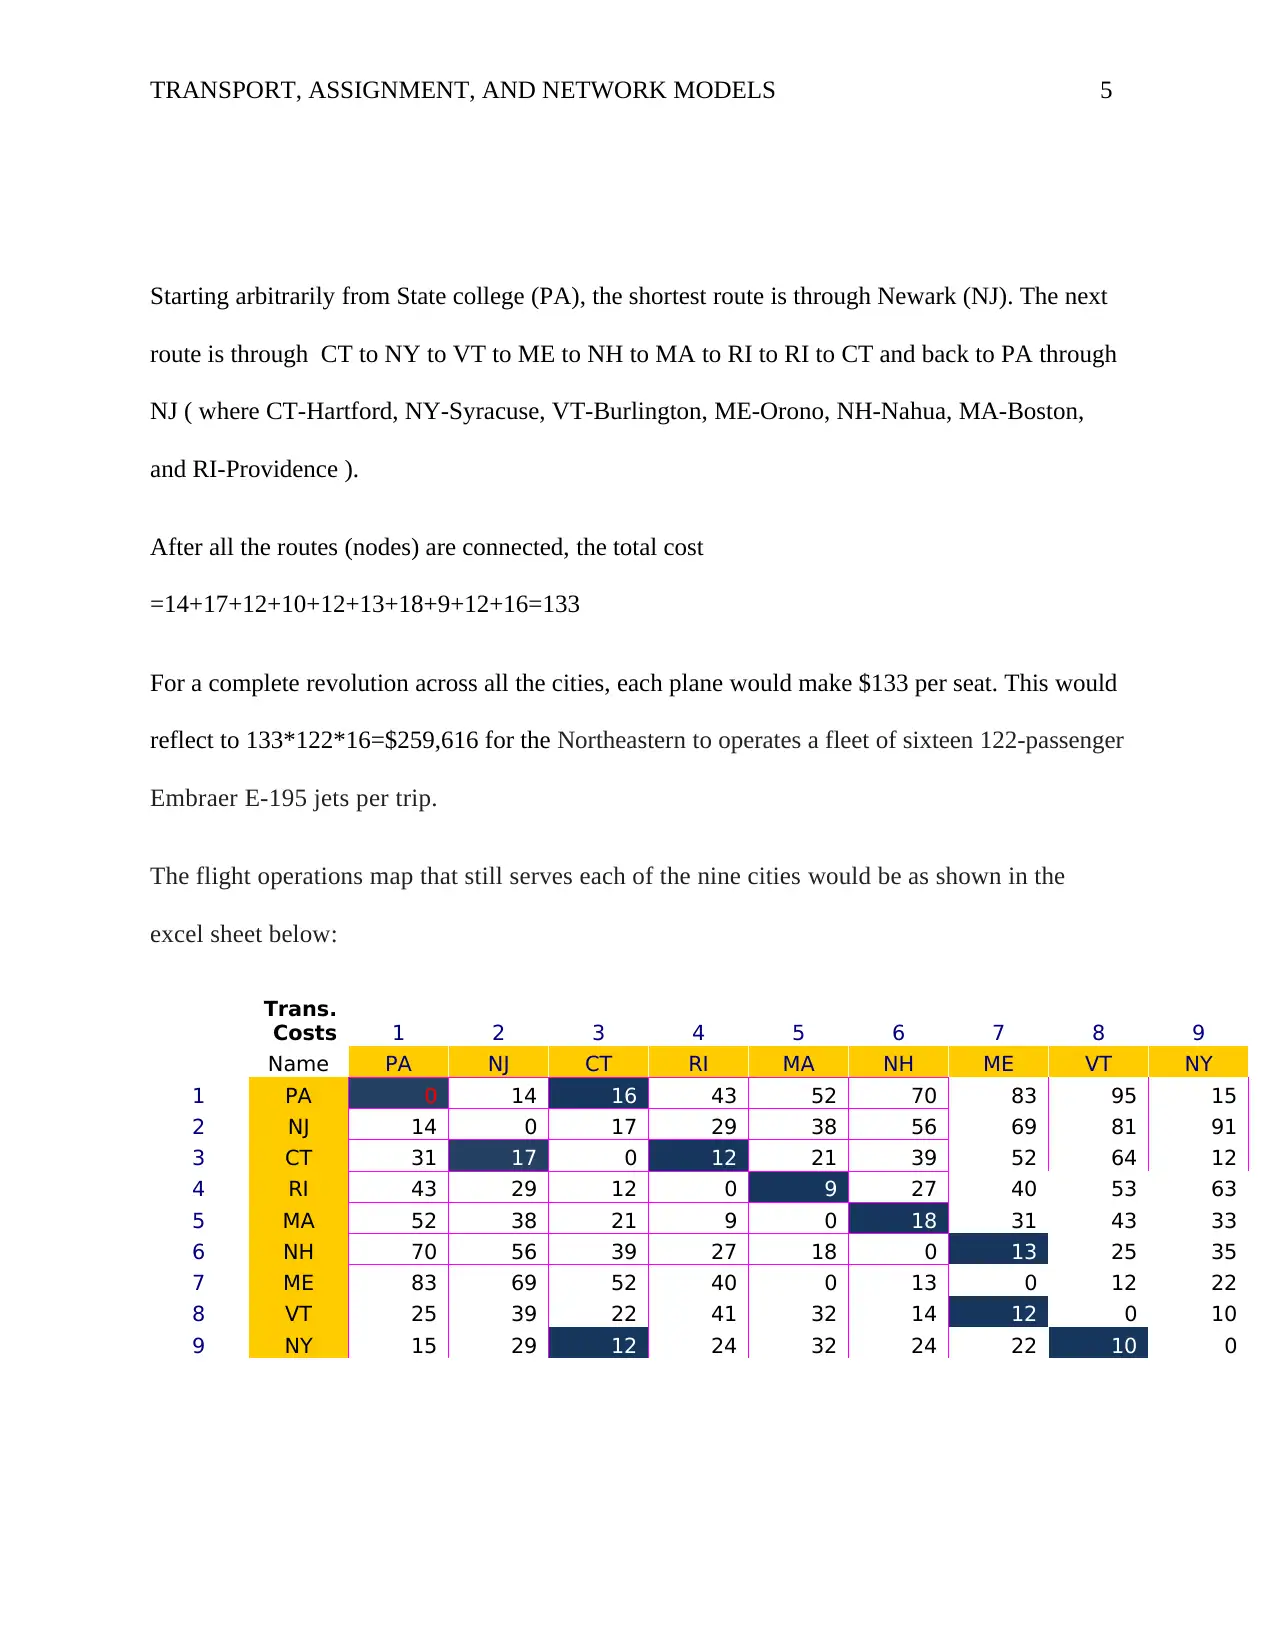
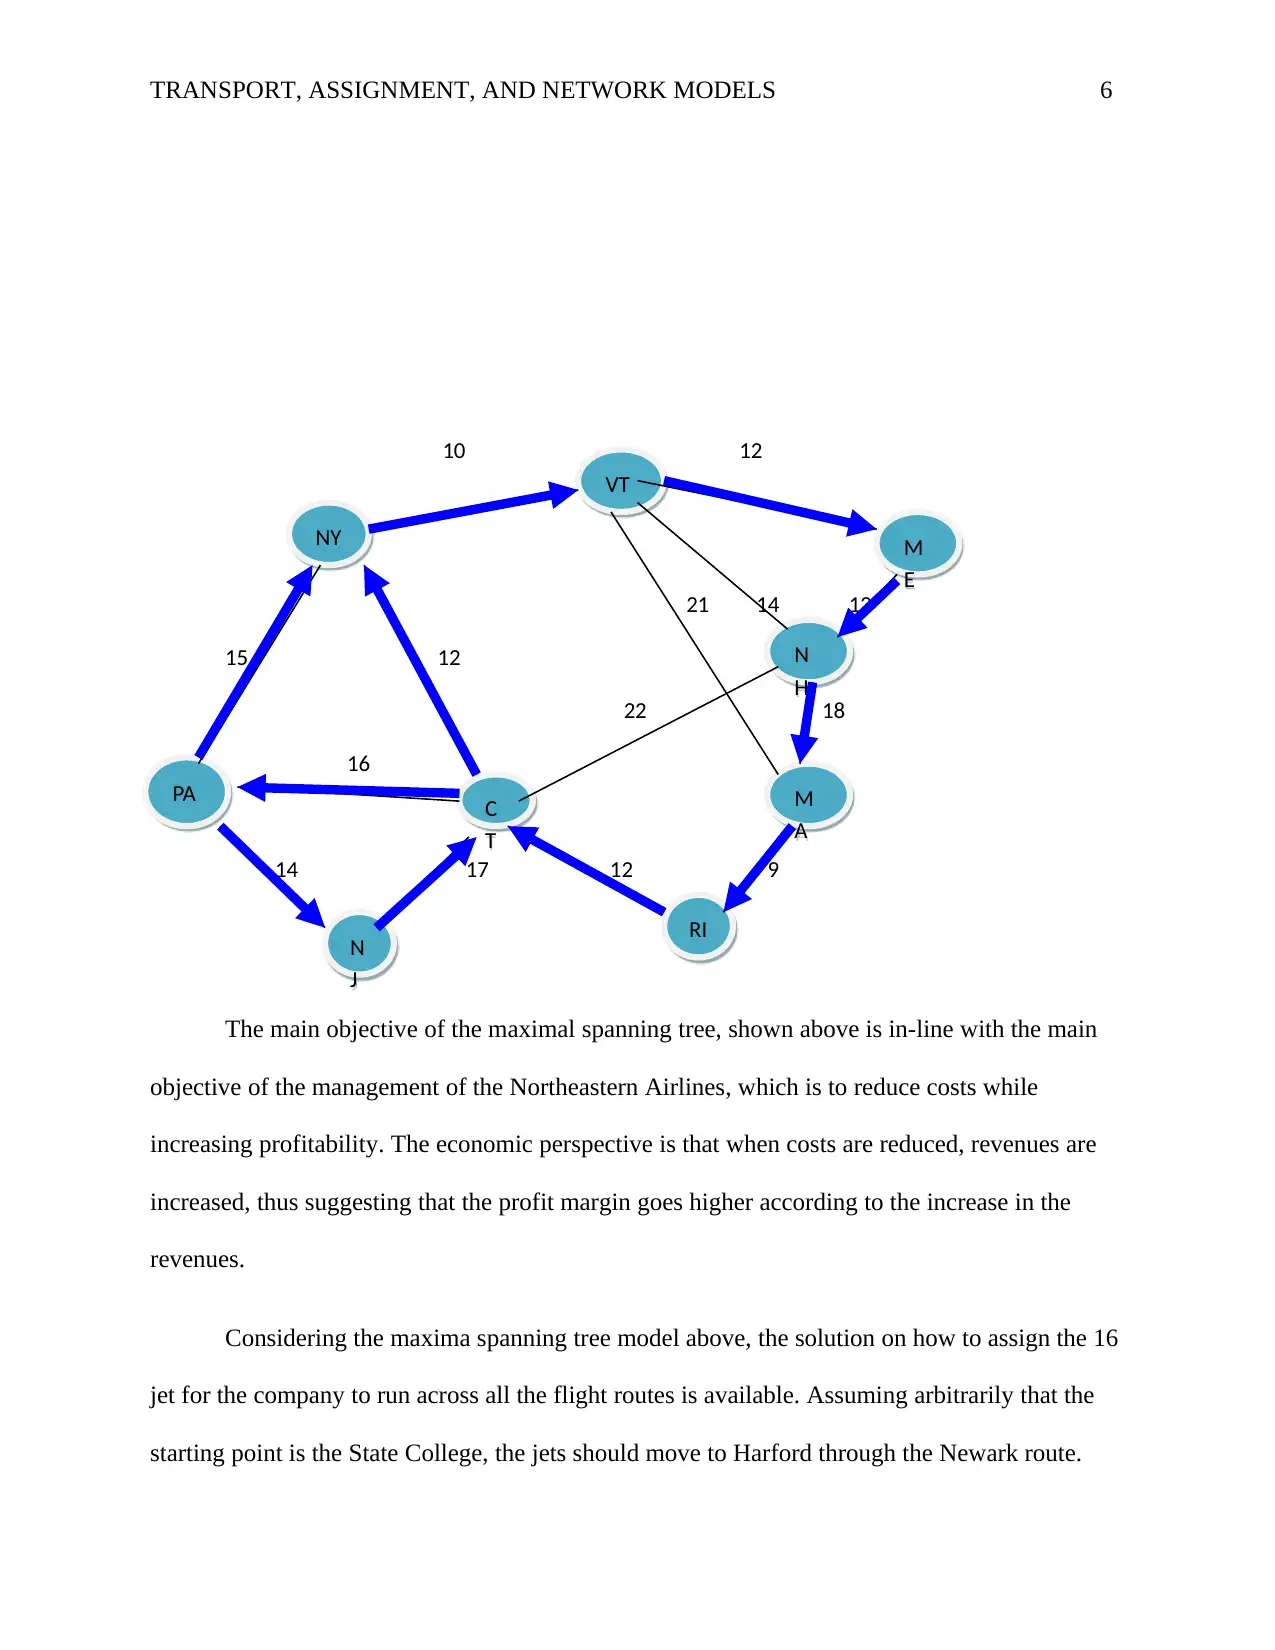
This report provides an analysis of Northeastern Airlines' flight operations, focusing on optimizing routes and maximizing profitability. The study utilizes transport, assignment, and network models, specifically the maximal spanning tree model, to determine the most profitable way to connect nine cities in the New England region. The report details the application of the model, considering factors such as demand forecasting, connectivity at airline hubs, aircraft availability, and competitive pressures. It calculates the total cost for a complete revolution across all cities and suggests an optimal flight operation map. The analysis also addresses the importance of strategic planning in the airline industry, especially regarding competition and hub connectivity, to ensure cost reduction and revenue increase. The study concludes with a discussion of how to assign the company's jets to various flight routes, ensuring all cities are served to maximize profits. The report is a valuable resource for understanding how network models can improve airline efficiency and financial outcomes.
Document Page
Running head: TRANSPORT, ASSIGNMENT, AND NETWORK MODELS 1
Transport, Assignment, and Network Models
Name
Institution
tabler-icon-diamond-filled.svg

Paraphrase This Document

Need a fresh take? Get an instant paraphrase of this document with our AI Paraphraser
Document Page
TRANSPORT, ASSIGNMENT, AND NETWORK MODELS 2
Executive Summary
The airlines are in constant analysis of the trade routes and seeking to add new
destinations to these route network based on the route evaluations for profitability. In this
context, the aim of every move is to maximize profitability in the process of increasing demand.
The demand forecasts become the root of hub connectivity, availability, and competitions. For
this reason, there is need for calculative planning to enhance profitability within the sphere of
gleaming demand for passengers. For this planning to be effective, four issues are critical;
demand forecasting, connectivity at the airline hubs, aircraft availability, and matching the
airline competitions (Asano, et al. 2008). Among these four issues, the various models of
transportation becomes typical of a decision making process under the certainty having
considered each shipping route cost, the demand of each destination, as well as the supply of
each source.
Considering the assumptions that are made in the transportation models, a transportation
problem that is balanced involves a situation where the total demand from all the destinations are
exactly equal to the total supply from all the sources. In an otherwise event, and the problem is
not balanced, it is either the demand or the supply constraints that must have inequalities
(Bertsimas & Patterson, 2018). For this reason, transportation model like the minimal spanning
model is used in this paper as the optimal way of connecting all the nodes in the network
together in the process of minimizing the total distance between the nodes, reflecting a minimal
total costs (Gertsbakh & Shpungin, 2016). The main objective of the model is to minimize the
Document Page
TRANSPORT, ASSIGNMENT, AND NETWORK MODELS 3
distance from the origin to the destination while connecting all the nodes in the trade routes to
maximize the profit to the airline.
Northeastern Airlines Service Area
This study deals with the a New England States regional airline called Northeastern
Airlines serving nine cities in New York, New Jersey, and in Pennsylvania. There is a possibility
of having non-stop flights for some routes. However, to maximize on the profit within the limits
of the flight demands, it is necessary for the airline to have connective flights (Sarkar, et al.
2015). The network in the figure below shows the cities that are served as well as the profits that
are made per passenger in each of these routes.
14
Ne
wark, NJ State
College, PA
Hartford,
CT
Providenc
e, RI
1
7
1
2
1
6
Boston,
MA
1
5
1
8
2
2
1
2
13
Nashua,
NH
2
1
1
4
1
0
1
2
Syracuse
, NY
Orono,
ME
Burlington
, VT
9
Document Page
TRANSPORT, ASSIGNMENT, AND NETWORK MODELS 4
Flight Operations map
To develop a flight operation maps that serves the each of the nine cities while maximizing the
Northeastern Airline per passenger, it is effective to use the Maximal-spanning model as
described by Zhu et al. (2015).
The maximal-Spanning tree model
The aim of the maximal spanning tree model is to demonstrate a maximization case in modeling
by connecting all the nodes based on the weight each node has, from the smallest to the largest
weight in the network so that they are networked to form a tree-like graph (Sarkar, et al. 2015).
In this study, the existing algorithms for the maximum spanning tree are analyzed based on costs,
rather than weight to develop a flight operation map for the Northeastern Airline Company.
Maximum costs allocations for transport
Trans.
Costs 1 2 3 4 5 6 7 8 9
Name PA NJ CT RI MA NH ME VT NY
1 PA 0 14 31 43 52 70 83 95 15
2 NJ 14 0 17 29 38 56 69 81 91
3 CT 31 17 0 12 21 39 52 64 12
4 RI 43 29 12 0 9 27 40 53 63
5 MA 52 38 21 9 0 18 31 43 33
6 NH 70 56 39 27 18 0 13 25 35
7 ME 83 69 52 40 0 13 0 12 22
8 VT 25 39 22 41 32 14 12 0 10
9 NY 15 29 12 24 32 24 22 10 0
tabler-icon-diamond-filled.svg

Paraphrase This Document

Need a fresh take? Get an instant paraphrase of this document with our AI Paraphraser
Document Page
TRANSPORT, ASSIGNMENT, AND NETWORK MODELS 5
Starting arbitrarily from State college (PA), the shortest route is through Newark (NJ). The next
route is through CT to NY to VT to ME to NH to MA to RI to RI to CT and back to PA through
NJ ( where CT-Hartford, NY-Syracuse, VT-Burlington, ME-Orono, NH-Nahua, MA-Boston,
and RI-Providence ).
After all the routes (nodes) are connected, the total cost
=14+17+12+10+12+13+18+9+12+16=133
For a complete revolution across all the cities, each plane would make $133 per seat. This would
reflect to 133*122*16=$259,616 for the Northeastern to operates a fleet of sixteen 122-passenger
Embraer E-195 jets per trip.
The flight operations map that still serves each of the nine cities would be as shown in the
excel sheet below:
Trans.
Costs 1 2 3 4 5 6 7 8 9
Name PA NJ CT RI MA NH ME VT NY
1 PA 0 14 16 43 52 70 83 95 15
2 NJ 14 0 17 29 38 56 69 81 91
3 CT 31 17 0 12 21 39 52 64 12
4 RI 43 29 12 0 9 27 40 53 63
5 MA 52 38 21 9 0 18 31 43 33
6 NH 70 56 39 27 18 0 13 25 35
7 ME 83 69 52 40 0 13 0 12 22
8 VT 25 39 22 41 32 14 12 0 10
9 NY 15 29 12 24 32 24 22 10 0
Document Page
TRANSPORT, ASSIGNMENT, AND NETWORK MODELS 6
10 12
21 14 13
15 12
22 18
16
14 17 12 9
The main objective of the maximal spanning tree, shown above is in-line with the main
objective of the management of the Northeastern Airlines, which is to reduce costs while
increasing profitability. The economic perspective is that when costs are reduced, revenues are
increased, thus suggesting that the profit margin goes higher according to the increase in the
revenues.
Considering the maxima spanning tree model above, the solution on how to assign the 16
jet for the company to run across all the flight routes is available. Assuming arbitrarily that the
starting point is the State College, the jets should move to Harford through the Newark route.
PA
NY
VT
M
E
N
H
M
A
RI
C
T
N
J
Document Page
TRANSPORT, ASSIGNMENT, AND NETWORK MODELS 7
From Hartford, the jets can move to Syracuse through State College or directly. From Syracuse,
the flight should lead to Burlington and to Nashua through Orono. From Nashua, the route
should take to Boston and to Providence. Eventually, the jets should pass through Harford to
State College again.
As indicated earlier, the main objective of any flight company is to deal with demand
forecasting, connectivity at the airline hubs, aircraft availability, and matching the airline
competitions. Considering the fact that there are many airlines that may operate within the same
routes, it is important to realize the magnitude of competition in the same industry. Airlines
therefore must be very strategic as far as connecting to new and every hubs available as an uphill
task (Fleurquin, et al. 2015). Availability of the aircraft is an issue of demand for airlines which
dictate the demand forecast. In the same way, connectivity between the routes at the lowest cost
is very critical for all the flight companies. Thus, for ensuring that Northeastern Airlines covers
all routes to maximize on the profits at the lowest costs is to follow the routes illustrated above.
tabler-icon-diamond-filled.svg

Paraphrase This Document

Need a fresh take? Get an instant paraphrase of this document with our AI Paraphraser
Document Page
TRANSPORT, ASSIGNMENT, AND NETWORK MODELS 8
References
Asano, T., Bhattacharya, B., Keil, M., & Yao, F. (2008, January). Clustering algorithms based on
minimum and maximum spanning trees. In Proceedings of the fourth annual symposium
on Computational geometry (pp. 252-257). ACM.
Bertsimas, D., & Patterson, S. S. (2018). The air traffic flow management problem with enroute
capacities. Operations research, 46(3), 406-422.
Fleurquin, P., Ramasco, J. J., & Eguiluz, V. M. (2013). Systemic delay propagation in the US
airport network. Scientific reports, 3, 1159.
Gertsbakh, I. B., & Shpungin, Y. (2016). Models of network reliability: analysis, combinatorics,
and Monte Carlo. CRC press.
Graham, R. L., & Hell, P. (1985). On the history of the minimum spanning tree problem. Annals
of the History of Computing, 7(1), 43-57.
Sarkar, D., De, A., Chanda, C. K., & Goswami, S. (2015). Kruskal's Maximal Spanning Tree
Algorithm for Optimizing Distribution Network Topology to Improve Voltage Stability.
Electric Power Components and Systems, 43(17), 1921-1930.
Zhu, F., Aziz, H. A., Qian, X., & Ukkusuri, S. V. (2015). A junction-tree based learning
algorithm to optimize network wide traffic control: A coordinated multi-agent
framework. Transportation Research Part C: Emerging Technologies, 58, 487-501.
chevron_up_icon
1 out of 8
circle_padding
hide_on_mobile
zoom_out_icon
[object Object]