Corporate Accounting Assessment Task 2: Financial Analysis of NRL
VerifiedAdded on 2023/06/11
|9
|2148
|132
Report
AI Summary
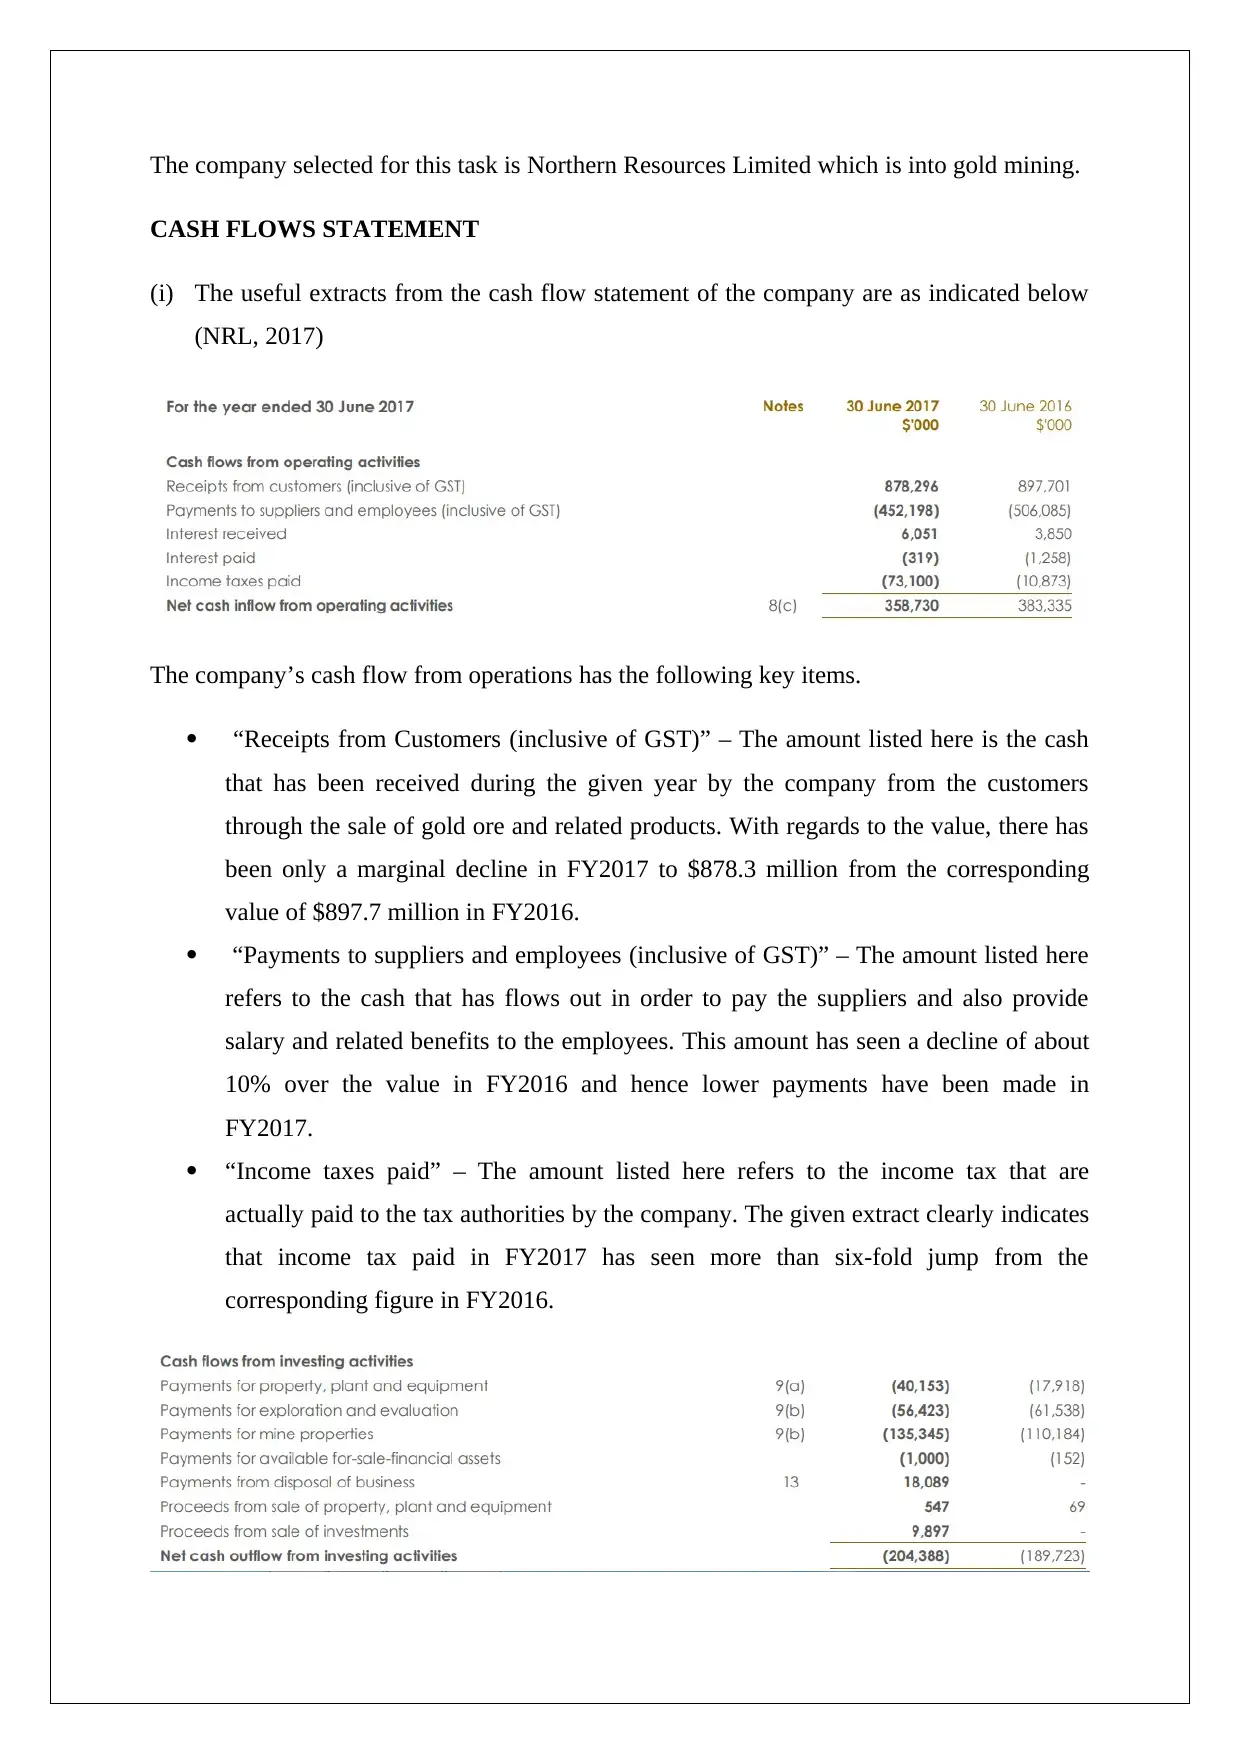
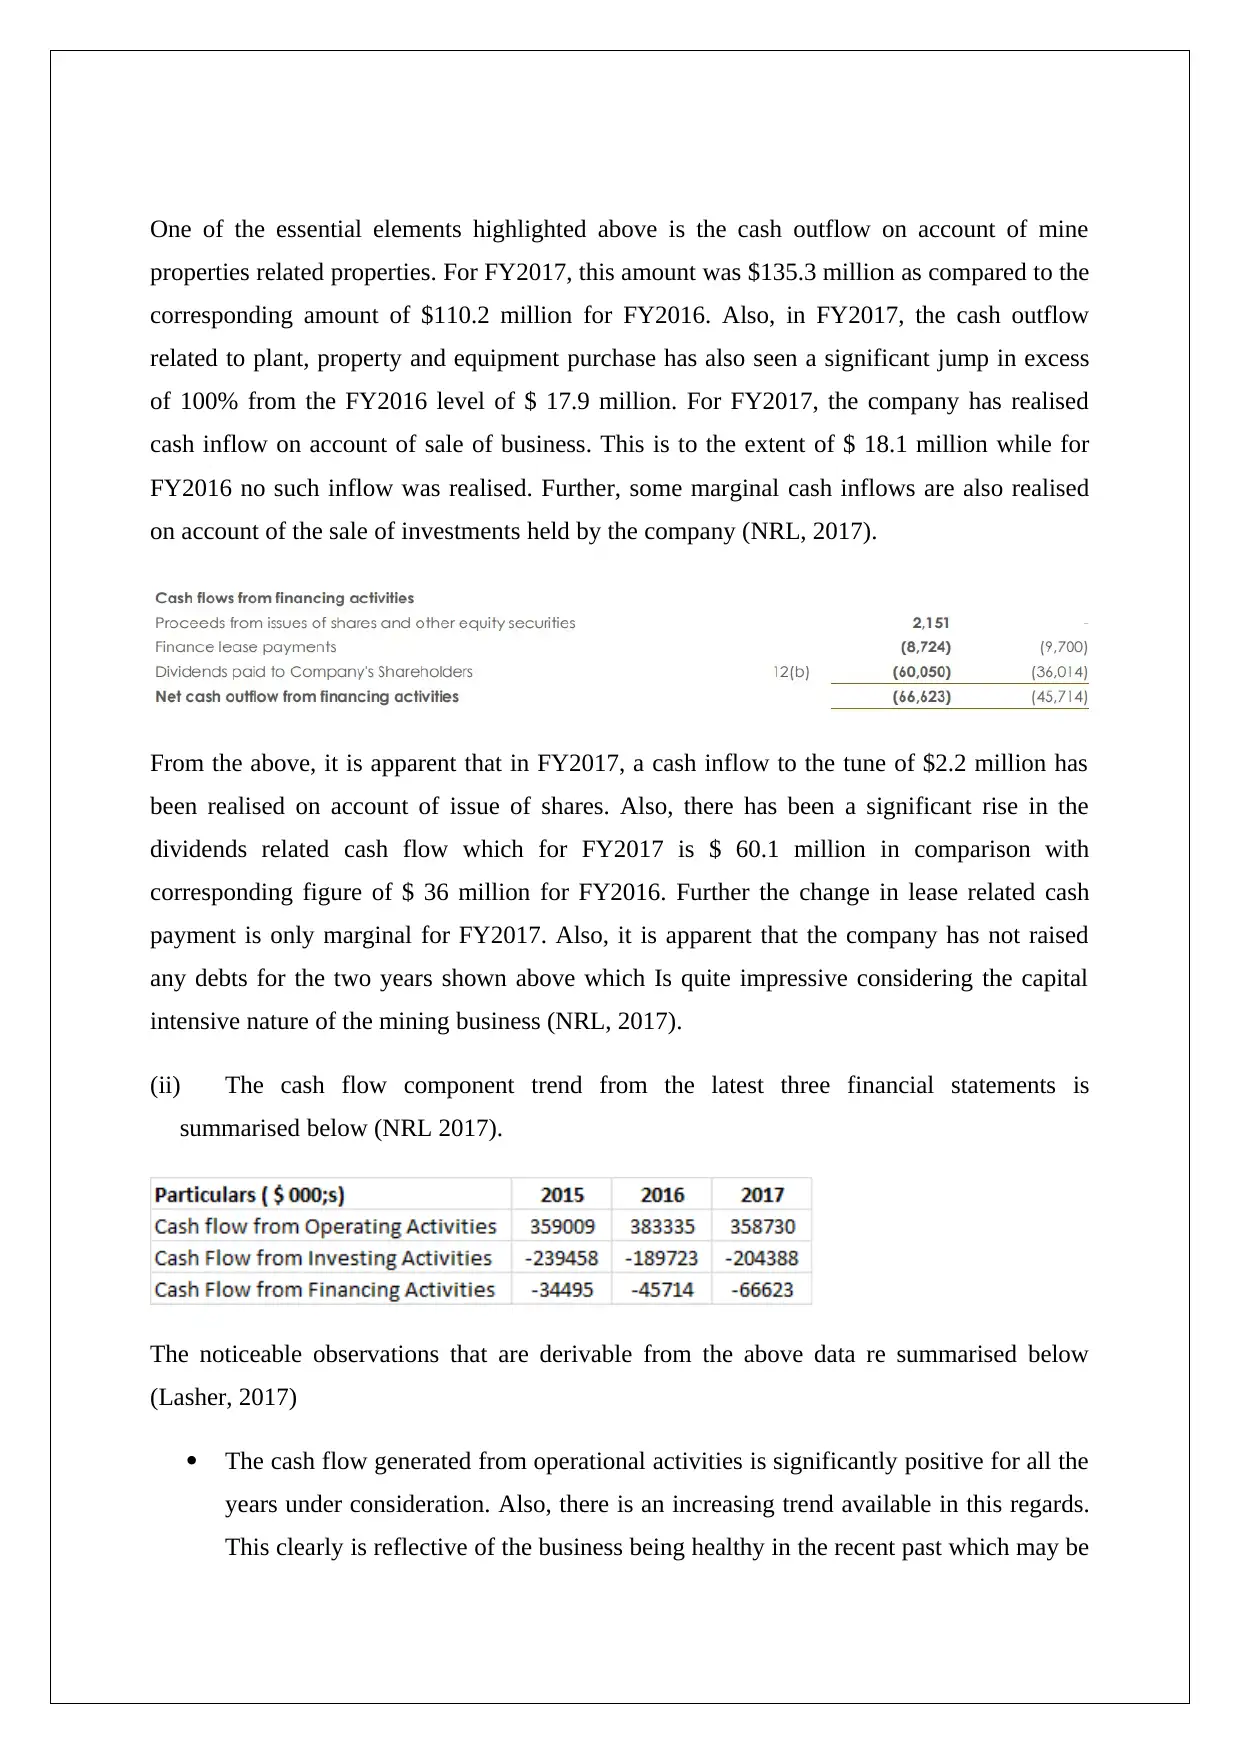
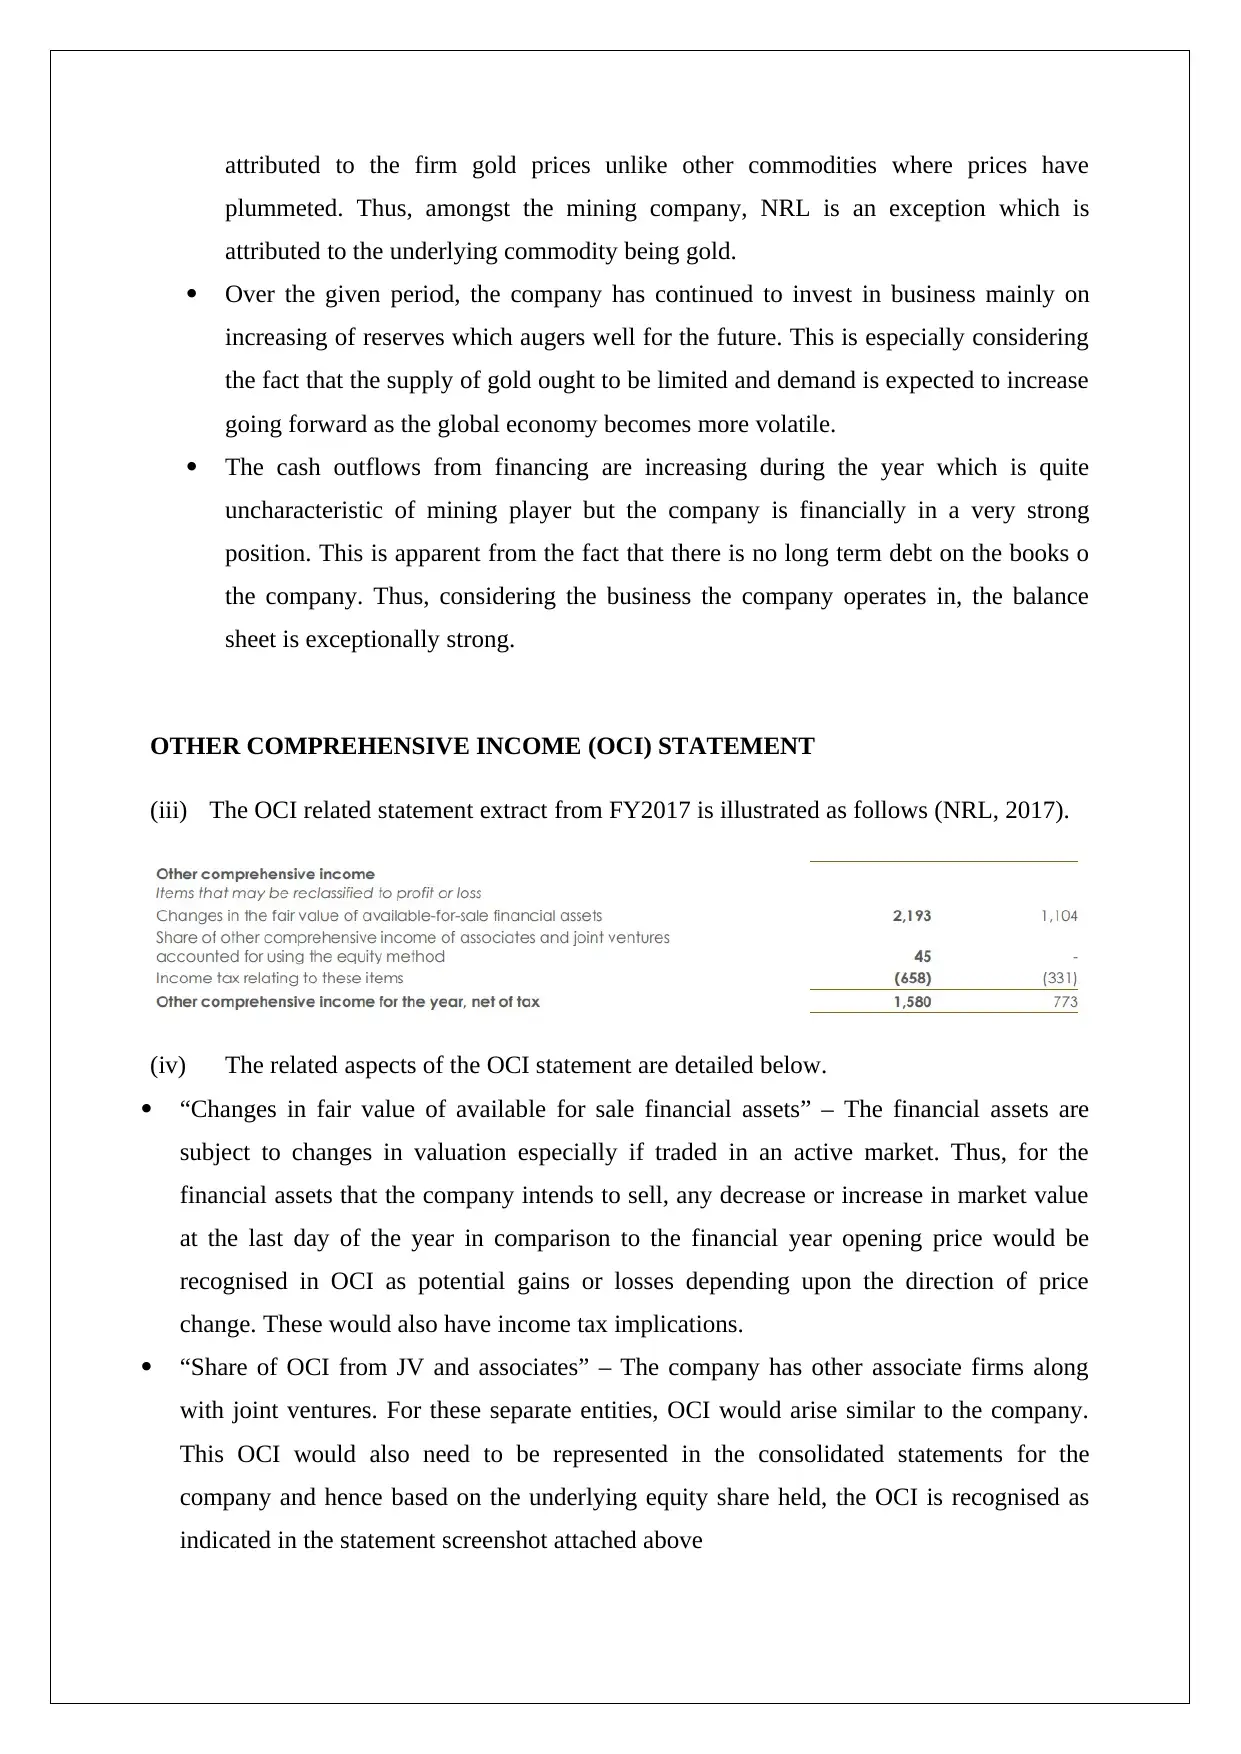
This report provides a detailed analysis of Northern Resources Limited's (NRL) corporate accounting practices, focusing on their cash flow statement, other comprehensive income (OCI) statement, and accounting for corporate income tax. The cash flow analysis examines receipts from customers, payments to suppliers and employees, and income taxes paid, highlighting trends and significant changes in these areas. The OCI statement analysis explains the components like changes in fair value of financial assets and share of OCI from joint ventures and associates, justifying the need for a separate OCI statement. Furthermore, the report delves into NRL's income tax expense, deferred tax assets and liabilities, and the relationship between income tax expense and tax payable, explaining the non-convergence between tax paid and tax expense. The analysis is supported by extracts from NRL's FY2017 annual report and relevant accounting principles.
Contribute Materials
Your contribution can guide someone’s learning journey. Share your
documents today.

CORPORATE ACCOUNTING
Assessment Task 2
STUDENT ID:
[Pick the date]
Assessment Task 2
STUDENT ID:
[Pick the date]
Secure Best Marks with AI Grader
Need help grading? Try our AI Grader for instant feedback on your assignments.

The company selected for this task is Northern Resources Limited which is into gold mining.
CASH FLOWS STATEMENT
(i) The useful extracts from the cash flow statement of the company are as indicated below
(NRL, 2017)
The company’s cash flow from operations has the following key items.
“Receipts from Customers (inclusive of GST)” – The amount listed here is the cash
that has been received during the given year by the company from the customers
through the sale of gold ore and related products. With regards to the value, there has
been only a marginal decline in FY2017 to $878.3 million from the corresponding
value of $897.7 million in FY2016.
“Payments to suppliers and employees (inclusive of GST)” – The amount listed here
refers to the cash that has flows out in order to pay the suppliers and also provide
salary and related benefits to the employees. This amount has seen a decline of about
10% over the value in FY2016 and hence lower payments have been made in
FY2017.
“Income taxes paid” – The amount listed here refers to the income tax that are
actually paid to the tax authorities by the company. The given extract clearly indicates
that income tax paid in FY2017 has seen more than six-fold jump from the
corresponding figure in FY2016.

One of the essential elements highlighted above is the cash outflow on account of mine
properties related properties. For FY2017, this amount was $135.3 million as compared to the
corresponding amount of $110.2 million for FY2016. Also, in FY2017, the cash outflow
related to plant, property and equipment purchase has also seen a significant jump in excess
of 100% from the FY2016 level of $ 17.9 million. For FY2017, the company has realised
cash inflow on account of sale of business. This is to the extent of $ 18.1 million while for
FY2016 no such inflow was realised. Further, some marginal cash inflows are also realised
on account of the sale of investments held by the company (NRL, 2017).
From the above, it is apparent that in FY2017, a cash inflow to the tune of $2.2 million has
been realised on account of issue of shares. Also, there has been a significant rise in the
dividends related cash flow which for FY2017 is $ 60.1 million in comparison with
corresponding figure of $ 36 million for FY2016. Further the change in lease related cash
payment is only marginal for FY2017. Also, it is apparent that the company has not raised
any debts for the two years shown above which Is quite impressive considering the capital
intensive nature of the mining business (NRL, 2017).
(ii) The cash flow component trend from the latest three financial statements is
summarised below (NRL 2017).
The noticeable observations that are derivable from the above data re summarised below
(Lasher, 2017)
The cash flow generated from operational activities is significantly positive for all the
years under consideration. Also, there is an increasing trend available in this regards.
This clearly is reflective of the business being healthy in the recent past which may be

attributed to the firm gold prices unlike other commodities where prices have
plummeted. Thus, amongst the mining company, NRL is an exception which is
attributed to the underlying commodity being gold.
Over the given period, the company has continued to invest in business mainly on
increasing of reserves which augers well for the future. This is especially considering
the fact that the supply of gold ought to be limited and demand is expected to increase
going forward as the global economy becomes more volatile.
The cash outflows from financing are increasing during the year which is quite
uncharacteristic of mining player but the company is financially in a very strong
position. This is apparent from the fact that there is no long term debt on the books o
the company. Thus, considering the business the company operates in, the balance
sheet is exceptionally strong.
OTHER COMPREHENSIVE INCOME (OCI) STATEMENT
(iii) The OCI related statement extract from FY2017 is illustrated as follows (NRL, 2017).
(iv) The related aspects of the OCI statement are detailed below.
“Changes in fair value of available for sale financial assets” – The financial assets are
subject to changes in valuation especially if traded in an active market. Thus, for the
financial assets that the company intends to sell, any decrease or increase in market value
at the last day of the year in comparison to the financial year opening price would be
recognised in OCI as potential gains or losses depending upon the direction of price
change. These would also have income tax implications.
“Share of OCI from JV and associates” – The company has other associate firms along
with joint ventures. For these separate entities, OCI would arise similar to the company.
This OCI would also need to be represented in the consolidated statements for the
company and hence based on the underlying equity share held, the OCI is recognised as
indicated in the statement screenshot attached above
Secure Best Marks with AI Grader
Need help grading? Try our AI Grader for instant feedback on your assignments.

(v) The need for a separate OCI statement over and above a P&L statement can be attributed
to potentially the following reasons (Northington, 2015).
Recognition of OCI is mandatory in accordance with the applicable guidelines for
“preparation of financial statements” and hence if certain items which are ought to be
included in OCI do exist, then these cannot be indicated in the normal P&L statement.
The key components of the OCI are also standardised since the same has been
prescribed so as to ensure comparability in results.
Further, the nature of items listed under OCI tends to be different from the regular
items represented under P&L on mainly two accounts. One is the ability to recognise
any profits or losses which are not yet realised but essentially of nominal nature.
Besides, the profits or losses recognised are not intended by the company as the
company does not want to earn any profits or losses from these but these are
incidental to the business
ACCOUNTING FOR CORPORATE INCOME TAX
(vi) The tax expense as per the latest income statement in public domain stands at $ 79.6
million. This was about 10% higher than the computed tax expense for the previous year
at $ 72.4 million
(vii) The tax rate that the company pays is 30%. Further, for FY2017, the income
statement highlights the income on pre-tax basis as $268.5 million
Hence, tax expense that would be expected at 30% corporate rate would be 0.3*268.5 = $
80.6 million. However, the income tax expense actually reported is $ 1 million lower than
estimates. This divergence can be explained based on the following note to account
pertaining to computation of tax expense.

On account of the above, it becomes evident that the deviation primarily Is caused on account
of the reconciliation related adjustments. The need for reconciliation arises since the
treatment of certain transactions in accounting norms and tax norms tend to be different and
hence adjustments are made to reflect the positions of the tax norms by making relevant
change to the theoretical income tax expense which has been computed. As a result, there is
deviation between the income tax expense and income tax theoretically computed
(Damodaran, 2015).
(viii) For the year ending on June 30, 2017, the company has both deferred tax assets and
corresponding deferred tax liabilities. The relevant schedule related to the deferred tax
assets is shown below.
From the above computation, it is apparent that a marginal decline in the deferred tax assets
was observed for FY2017 compared to the previous year. This was mainly on account of
decline in temporary differences related to provisions. Also, it is noticeable that deferred tax
assets tend to arise due to the temporary differences created in the present which would save
tax outflow in the future.

The relevant schedule related to the deferred tax liabilities is shown below.
From the above computation, it is apparent that a significant increase in the deferred tax
liabilities was observed for FY2017 compared to the previous year. This was mainly on
account of increase in temporary differences related to exploration Also, it is noticeable that
deferred tax liabilities tend to mainly arise due to the temporary differences created in the
present which would lead to higher tax outflow in the future.
(ix) As on June 30, 2017, the underlying tax liability comes out as $ 40.8 million which is
higher than the corresponding amount of $35.9 million reported as on June 30, 2016.
As the name suggests, this is a current liability and hence would produce a tax related
outflow to the tune of $ 35.9 million in FY2018 owing to outstanding or unpaid tax
liabilities.
The basic relationship between income tax expense and tax payable is indicated below.
Tax payable = Income tax expense – Income tax paid
From the above relationship, it is easier and convenient to understand as to why the tax
payable and income tax expense would not be equal. This arises because there is some
income tax which would be paid during the year considering the potential profits generated
by the business. As a result, the tax payable in usual cases would be lesser than the income
expense and would be only a limited fraction of the same. It is noteworthy that income tax
payable can be negative if higher tax outflow has been incurred than the expense (Brealey,
Myers and Allen, 2014).
(x) For NRL, there is non-convergence between the tax paid and tax expense which is on
expected lines. This is because the computation of the precise tax expense can arise
only after the ending of financial year has happened. Thus, when the income tax
expense is not precisely known, the tax paid cannot match the same. Also, it is essential
Paraphrase This Document
Need a fresh take? Get an instant paraphrase of this document with our AI Paraphraser

to realise that tax paid as reflected in the cash flow statement does not only have tax
paid for FY2017 but also pending taxes for FY2016 would also be reflected in the tax
paid. Thus, only a portion of the taxes actually paid correspond to income tax expense
for the given year (Parrino and Kidwell, 2014).
(xi) A relevant aspect which I found quite interesting pertains to the schedule highlighting
the derivation of tax expense from the theoretical case which we are aware of. To see
the underlying precision and complexity of this computation was definitely a highlight
of the exercise. Also, the amount of factors and variables involved in the same was
truly staggering and in a moment, it become clear as to why specialised consultants
exist for the same. Thus, the activity was essentially quite insightful.

References
Brealey, R. A., Myers, S. C., & Allen, F. (2014) Principles of corporate finance, 2nd ed. New
York: McGraw-Hill Inc.
Damodaran, A. (2015). Applied corporate finance: A user’s manual 3rd ed. New York:
Wiley, John & Sons.
Lasher, W. R., (2017) Practical Financial Management 5th ed. London: South- Western
College Publisher.
Northington, S. (2015) Finance, 4th ed. New York: Ferguson
Parrino, R. and Kidwell, D. (2014) Fundamentals of Corporate Finance, 3rd ed. London:
Wiley Publications
NRL (2017) Annual Report FY2017, [online] available at https://www.nsrltd.com/wp-
content/uploads/2017/08/Annual-Report-2017-Amended-Final-22-08-2017.pdf (Accessed
May 28, 2018)
1 out of 9
Related Documents

Your All-in-One AI-Powered Toolkit for Academic Success.
+13062052269
info@desklib.com
Available 24*7 on WhatsApp / Email
Unlock your academic potential
© 2024 | Zucol Services PVT LTD | All rights reserved.