Marketing Research Assignment: Nostalgia Inc. Case Study Analysis

Verified

Added on  2023/01/19

|8
|1422
|53
Case Study
AI Summary
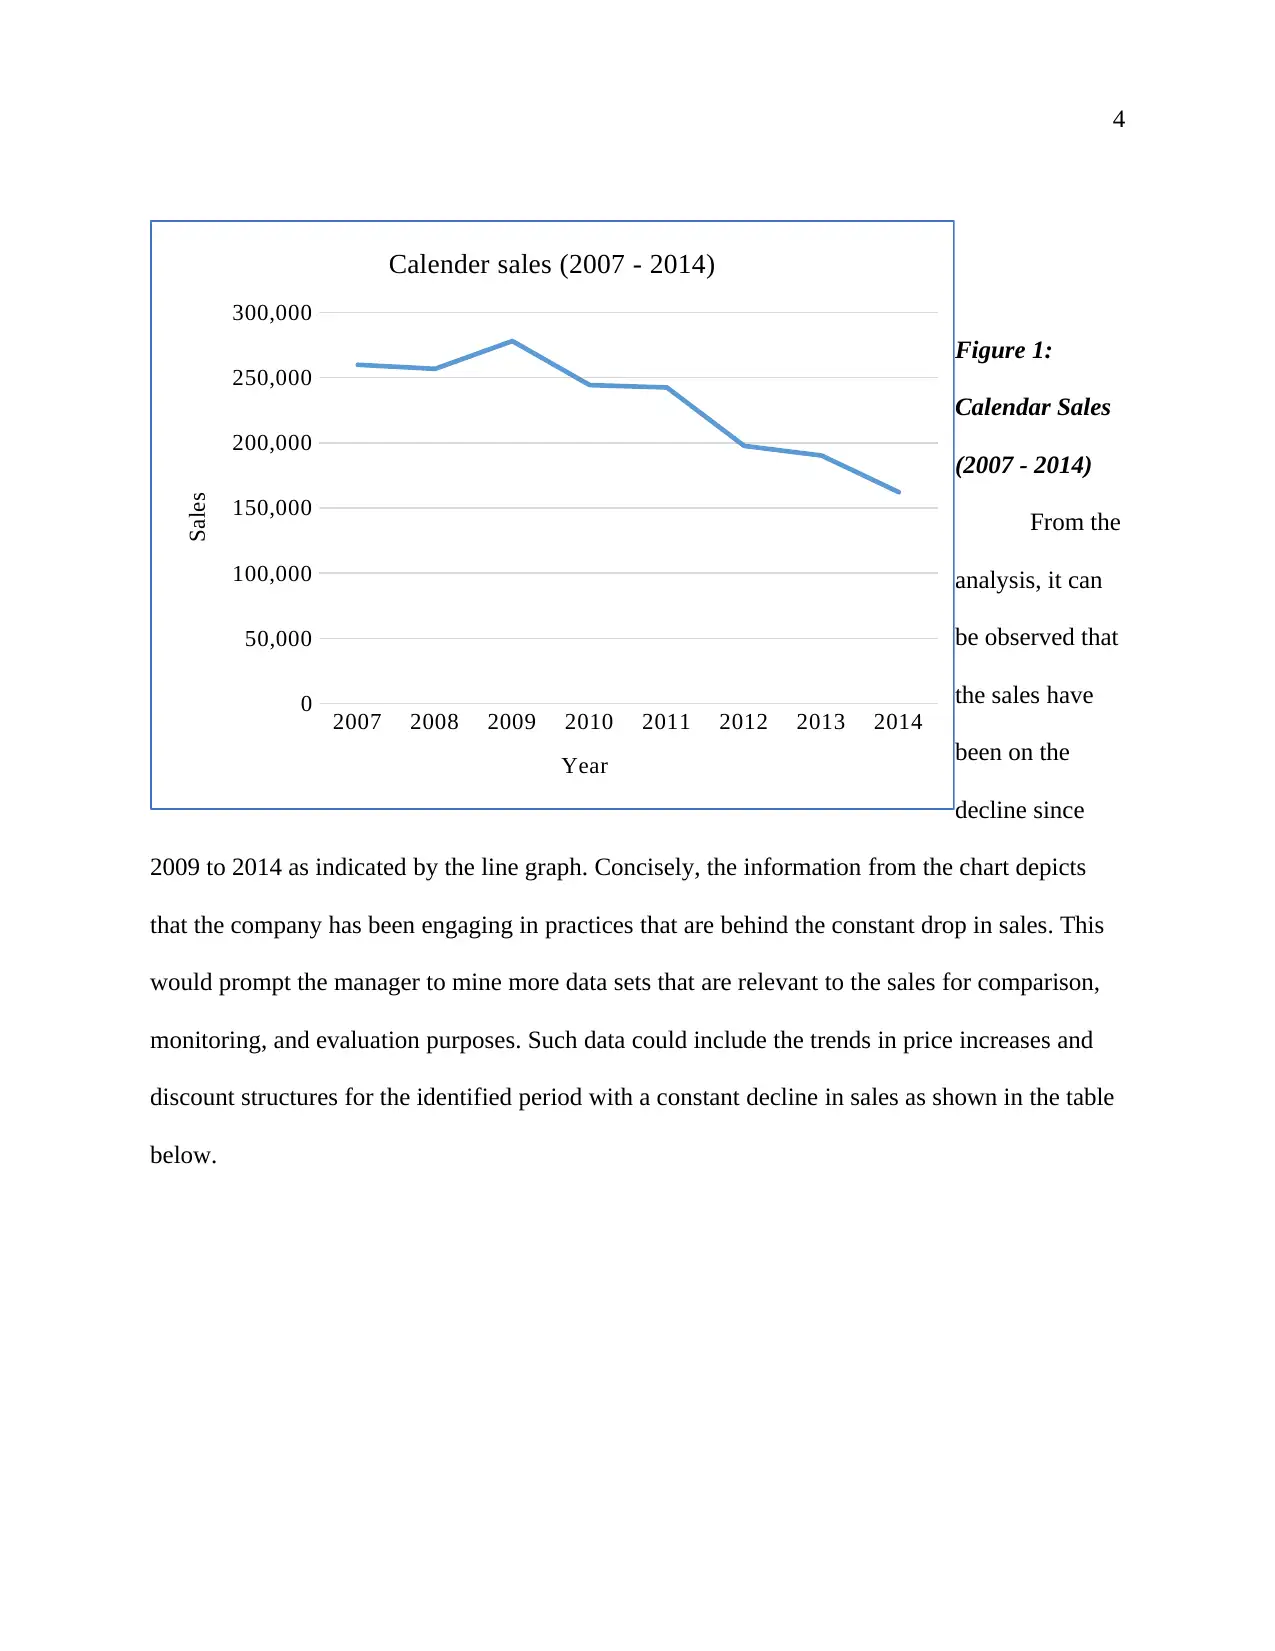
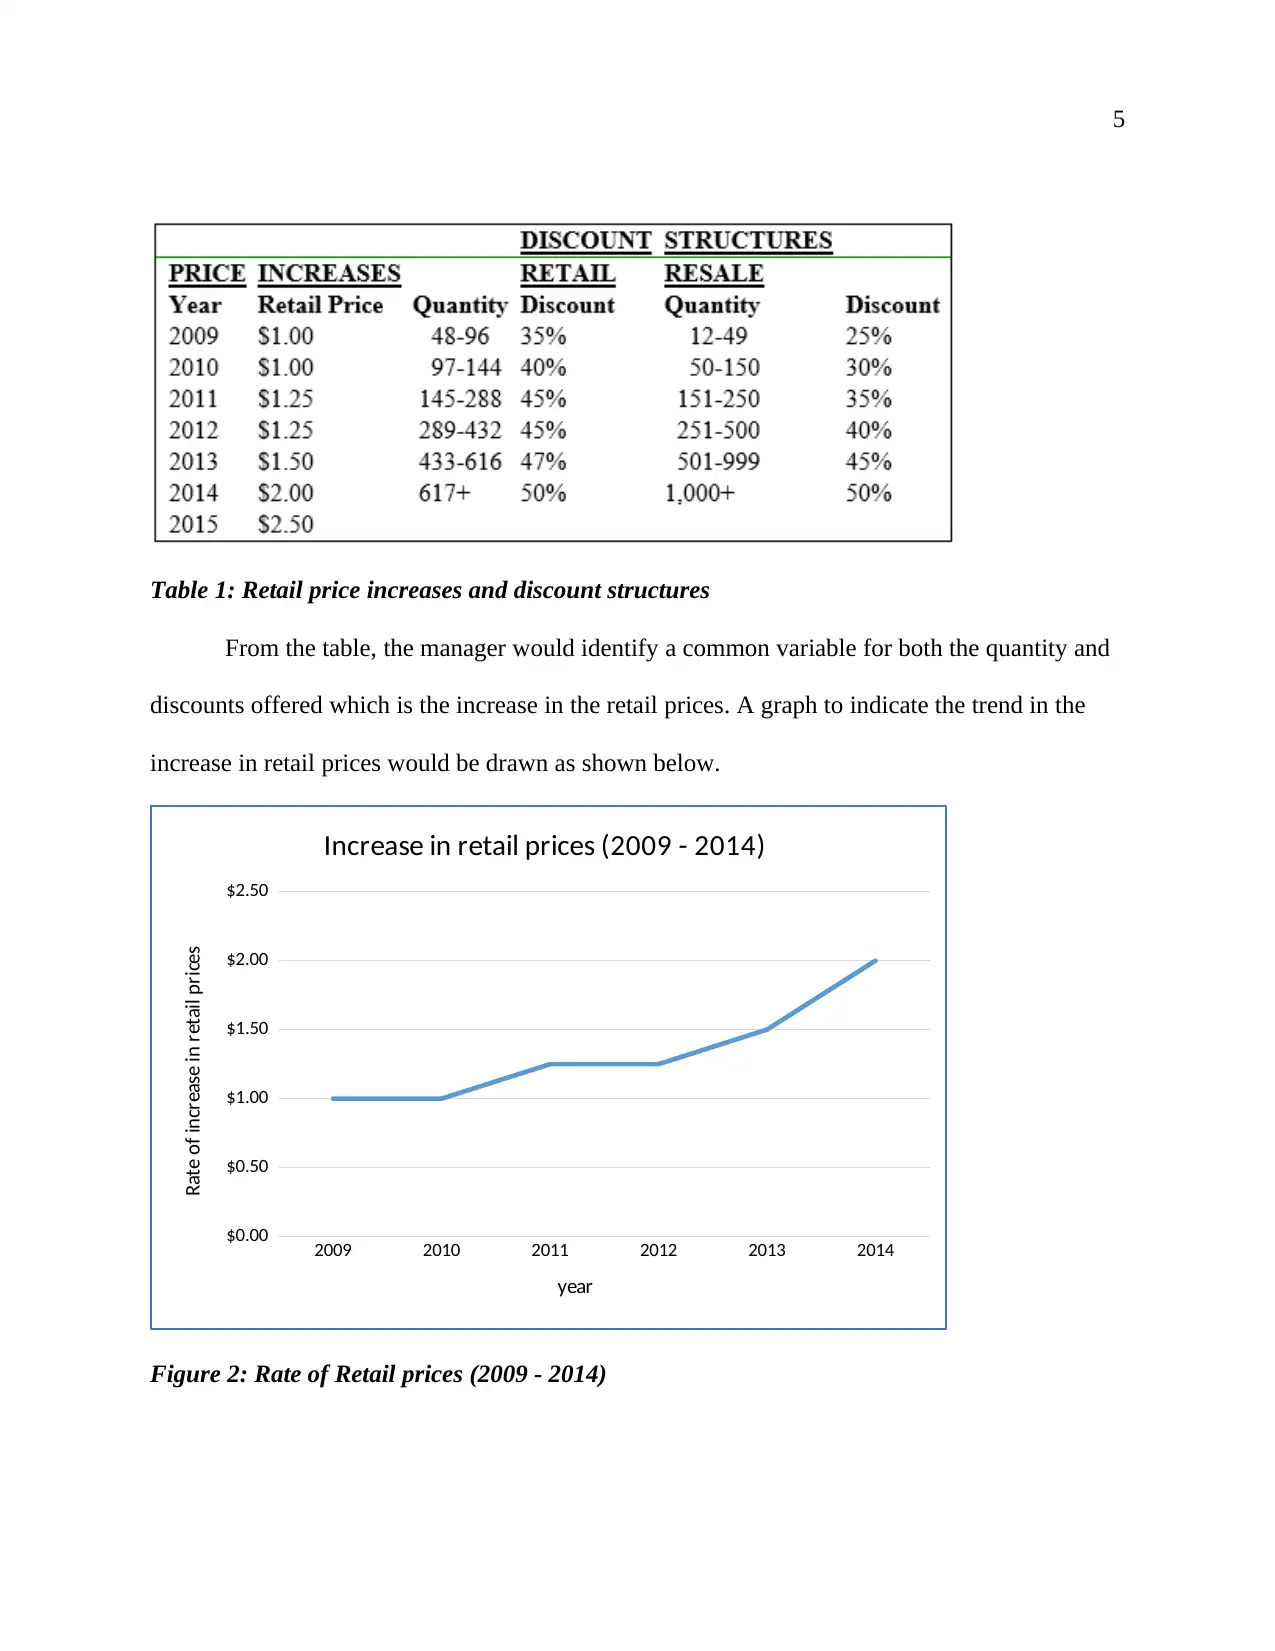
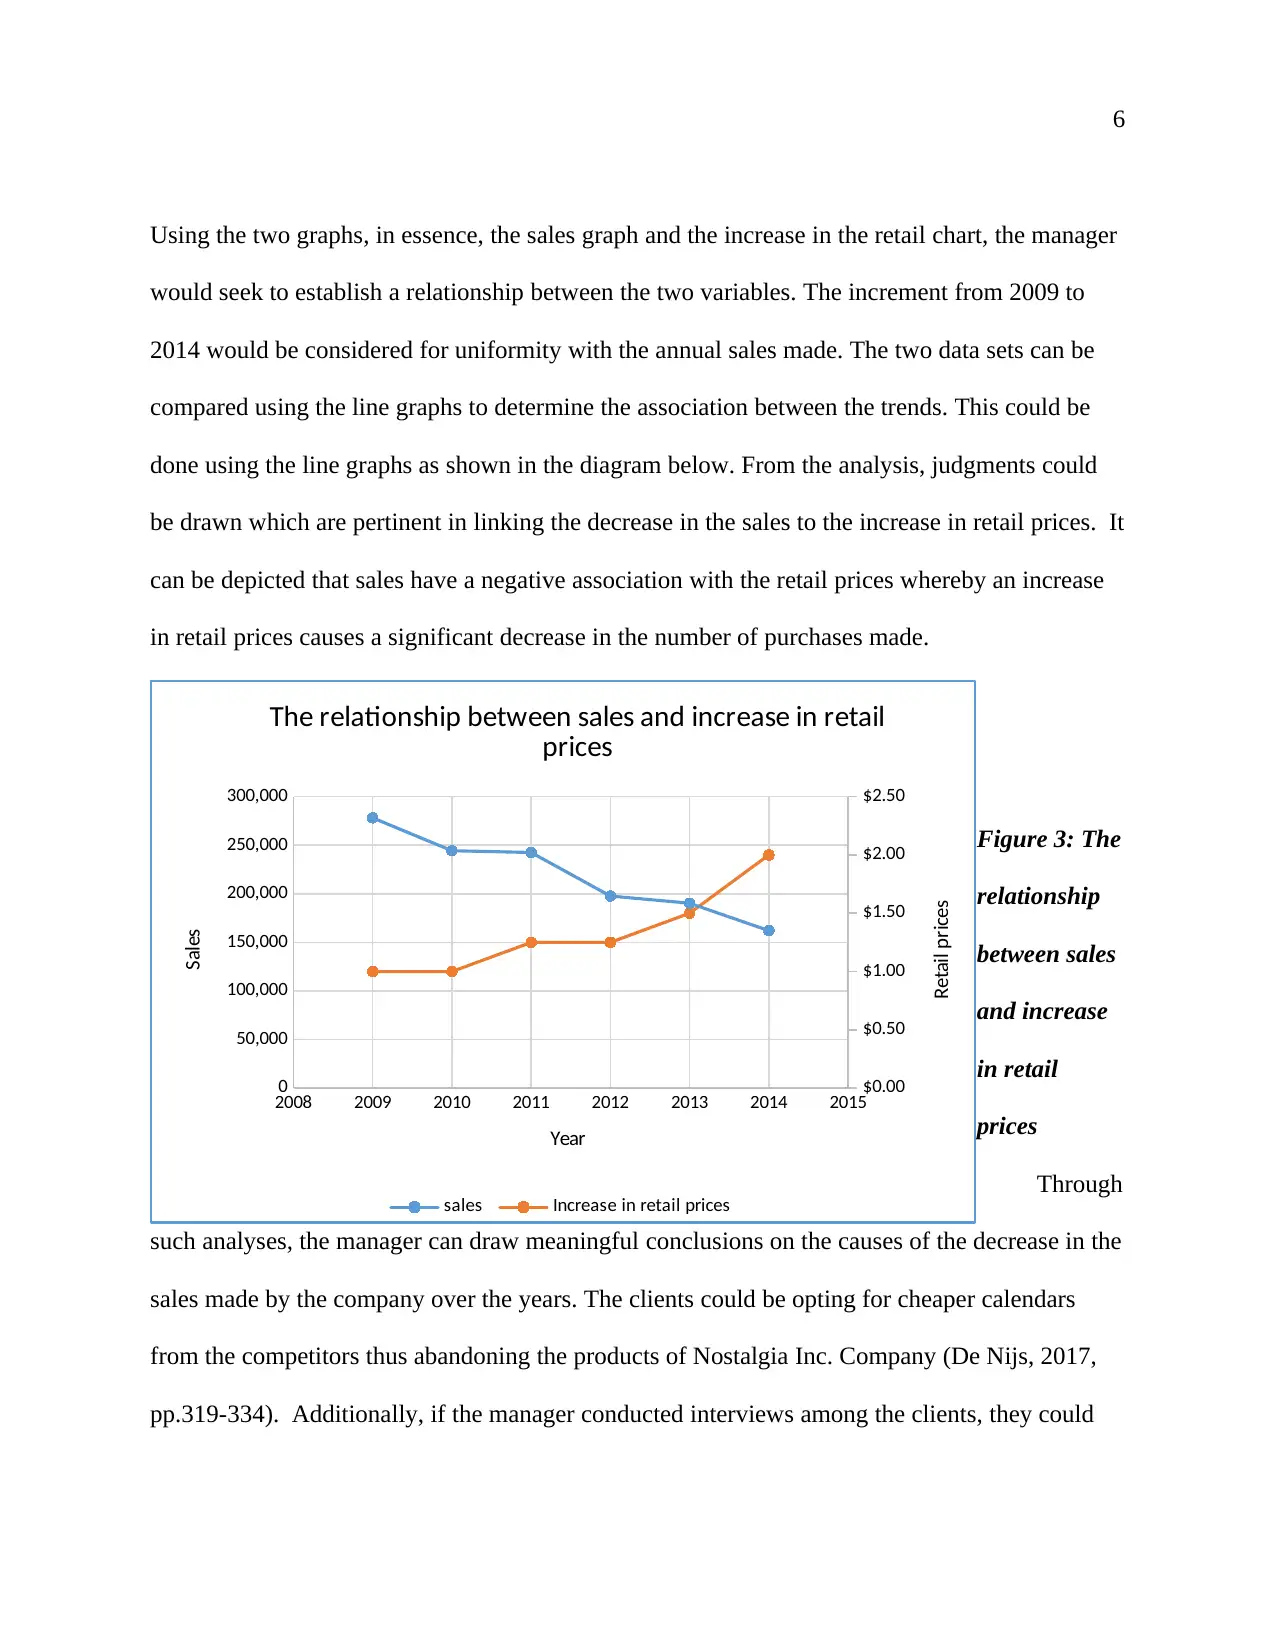
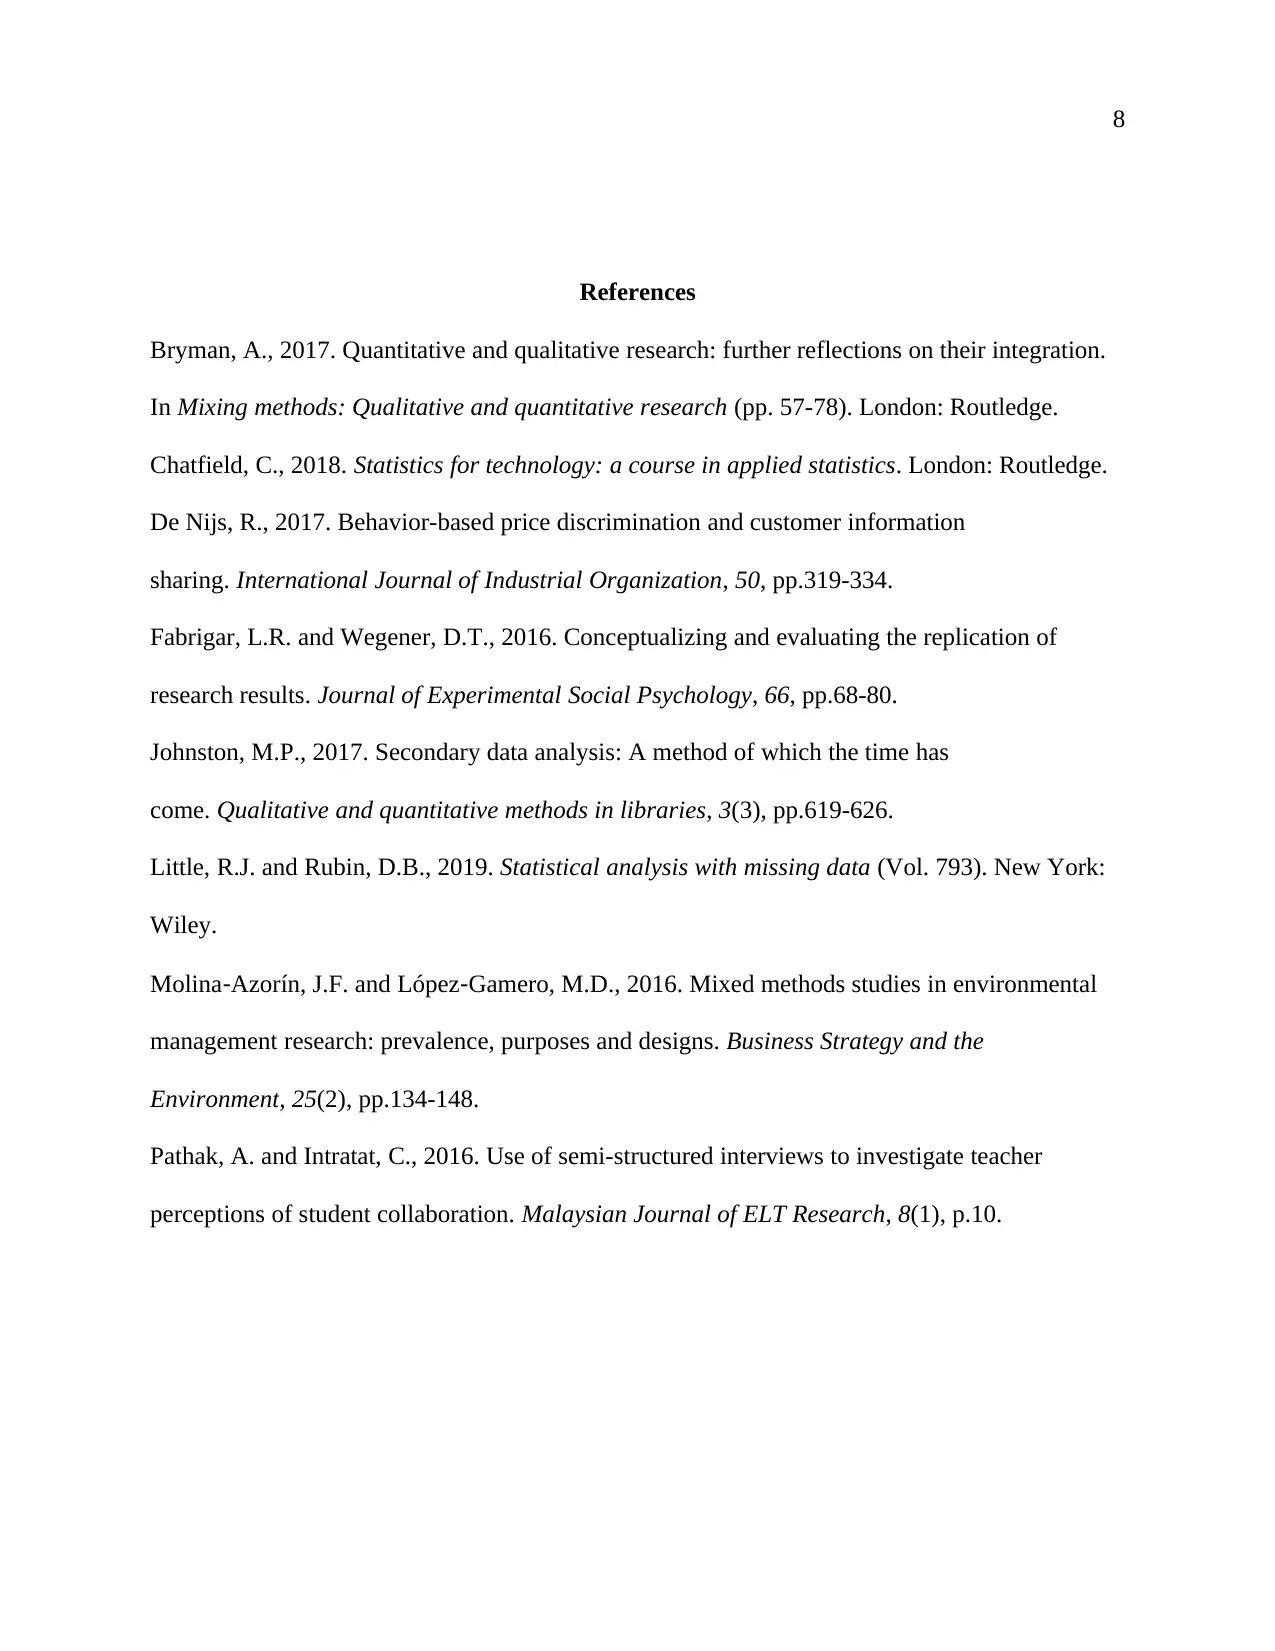
This case study delves into the marketing challenges faced by Nostalgia Inc., a calendar manufacturing company experiencing a decline in sales. The analysis begins by recommending a mixed-methods research approach, combining qualitative and quantitative data collection to identify the root causes of the sales decrease. The methodology involves analyzing secondary data from sales records using descriptive statistics and creating visual representations like line graphs to illustrate trends. Furthermore, the study suggests collecting primary data through semi-structured interviews with customers to gather insights into their purchasing behavior. The analysis establishes a relationship between rising retail prices and the decline in sales, using graphs to compare the trends. The conclusion emphasizes the importance of understanding consumer behavior and adapting marketing strategies to address the identified issues, and the document provides recommendations for further research and analysis.
tabler-icon-diamond-filled.svg

Contribute Materials

Your contribution can guide someone’s learning journey. Share your documents today.
Document Page
1
Marketing Research: Nostalgia Inc Case Study
Student’s Name
Course
Professor’s Name
Institution’s Name
Institution’s Location
Date
tabler-icon-diamond-filled.svg

Secure Best Marks with AI Grader

Need help grading? Try our AI Grader for instant feedback on your assignments.
Document Page
2
Marketing Research: Nostalgia Inc Case Study
Methodology in solving Mr Evan’s problem
The manager, Mr Evans, could deploy both qualitative and quantitative research
approaches in research to solve the problem of reduced sales. The mixed method approach would
enable the manager to collect both the numerical and the non-numerical data that would allow
him to define the problem for proper analysis and interpretation of the findings (MolinaAzorín
and LópezGamero, 2016, pp.134-148). Concisely, using the mixed method approach would
promote the use of secondary and primary sources of data whereby the secondary sources would
be based on the financial reports that utilize the quantitative data whereas the primary sources
would be the data collected from the relevant stakeholders, which would appreciate qualitative
data (Johnston, 2017, pp.619-626). The combination of the primary and the secondary sources
would give the manager an advantage of in-depth data that would provide meaningful insights
and judgments during analysis and interpretation. Moreover, the data that is not provided by the
primary source could be obtained in the secondary sources while the missing data in secondary
materials would likely be derived from primary sources (Little and Rubin, 2019).
During data collection, the manager could make the random sampling of their customers
such as the retailers or the direct customers who could be interviewed using semi-structured
questionnaires for those who consent to take part in the study as demanded by the ethical
requirements (Pathak and Intratat, 2016, p.10). Using semi-structured questions with a series of
prompts puts the manager in a position to collect meaningful data inclined to the reasons for the
decrease in the number of sales at the company as well as giving room to the respondent to add
Document Page
3
information that could be pertinent to the study, which the researcher left out. Additionally, the
interviews would be essential in the collection of qualitative pieces of information, which could
be critical in the interpretation of the quantitative data collected from the secondary source thus
giving the manager accurate results and findings pertaining the research problem affecting the
Nostalgia Inc Company (Bryman, 2017, pp. 57-78).
Moreover, using the mixed method approach provides for adequate data analysis and
evaluation techniques whereby the quantitative data could be analysed using descriptive statistics
method, which utilises the graphs, tables, and charts especially the line charts that have the
capability of forecasting the future trends of series data (Chatfield, 2018). Additionally, the
manager could use the inductive approach to analyse the qualitative data collected from their
clients, which gives additional meaning to the secondary data obtained from the financial reports.
Therefore, using the described research methodology would enable the researcher to address the
problem of decreased sales at the company as well as forecast the trends in the sales for the
future. Moreover, the approach would provision of adequate recommendations as well as
replication of the results to a related problem in other firms (Fabrigar and Wegener, 2016, pp.68-
80).
Procedure for determining the reason for the sales decrease
The process of determining the causes of the decrease in sales is preceded by the
identification of the difference in the value of sales across different years. This entails collection
of the secondary data from the company’s annual sales records for a given period, for example
from 2007 to 2015. The data is then analysed using descriptive statistics as shown in the diagram
below.
Document Page
4
Figure 1:
Calendar Sales
(2007 - 2014)
From the
analysis, it can
be observed that
the sales have
been on the
decline since
2009 to 2014 as indicated by the line graph. Concisely, the information from the chart depicts
that the company has been engaging in practices that are behind the constant drop in sales. This
would prompt the manager to mine more data sets that are relevant to the sales for comparison,
monitoring, and evaluation purposes. Such data could include the trends in price increases and
discount structures for the identified period with a constant decline in sales as shown in the table
below.
2007 2008 2009 2010 2011 2012 2013 2014
0
50,000
100,000
150,000
200,000
250,000
300,000
Calender sales (2007 - 2014)
Year
Sales
tabler-icon-diamond-filled.svg

Secure Best Marks with AI Grader

Need help grading? Try our AI Grader for instant feedback on your assignments.
Document Page
5
Table 1: Retail price increases and discount structures
From the table, the manager would identify a common variable for both the quantity and
discounts offered which is the increase in the retail prices. A graph to indicate the trend in the
increase in retail prices would be drawn as shown below.
2009 2010 2011 2012 2013 2014
$0.00
$0.50
$1.00
$1.50
$2.00
$2.50
Increase in retail prices (2009 - 2014)
year
Rate of increase in retail prices
Figure 2: Rate of Retail prices (2009 - 2014)
Document Page
6
Using the two graphs, in essence, the sales graph and the increase in the retail chart, the manager
would seek to establish a relationship between the two variables. The increment from 2009 to
2014 would be considered for uniformity with the annual sales made. The two data sets can be
compared using the line graphs to determine the association between the trends. This could be
done using the line graphs as shown in the diagram below. From the analysis, judgments could
be drawn which are pertinent in linking the decrease in the sales to the increase in retail prices. It
can be depicted that sales have a negative association with the retail prices whereby an increase
in retail prices causes a significant decrease in the number of purchases made.
Figure 3: The
relationship
between sales
and increase
in retail
prices
Through
such analyses, the manager can draw meaningful conclusions on the causes of the decrease in the
sales made by the company over the years. The clients could be opting for cheaper calendars
from the competitors thus abandoning the products of Nostalgia Inc. Company (De Nijs, 2017,
pp.319-334). Additionally, if the manager conducted interviews among the clients, they could
2008 2009 2010 2011 2012 2013 2014 2015
0
50,000
100,000
150,000
200,000
250,000
300,000
$0.00
$0.50
$1.00
$1.50
$2.00
$2.50
The relationship between sales and increase in retail
prices
sales Increase in retail prices
Year
Sales
Retail prices
Document Page
7
contribute to the determination of the relevant information that explains the causes of the
decrease in sales.
tabler-icon-diamond-filled.svg

Paraphrase This Document

Need a fresh take? Get an instant paraphrase of this document with our AI Paraphraser
Document Page
8
References
Bryman, A., 2017. Quantitative and qualitative research: further reflections on their integration.
In Mixing methods: Qualitative and quantitative research (pp. 57-78). London: Routledge.
Chatfield, C., 2018. Statistics for technology: a course in applied statistics. London: Routledge.
De Nijs, R., 2017. Behavior-based price discrimination and customer information
sharing. International Journal of Industrial Organization, 50, pp.319-334.
Fabrigar, L.R. and Wegener, D.T., 2016. Conceptualizing and evaluating the replication of
research results. Journal of Experimental Social Psychology, 66, pp.68-80.
Johnston, M.P., 2017. Secondary data analysis: A method of which the time has
come. Qualitative and quantitative methods in libraries, 3(3), pp.619-626.
Little, R.J. and Rubin, D.B., 2019. Statistical analysis with missing data (Vol. 793). New York:
Wiley.
MolinaAzorín, J.F. and LópezGamero, M.D., 2016. Mixed methods studies in environmental
management research: prevalence, purposes and designs. Business Strategy and the
Environment, 25(2), pp.134-148.
Pathak, A. and Intratat, C., 2016. Use of semi-structured interviews to investigate teacher
perceptions of student collaboration. Malaysian Journal of ELT Research, 8(1), p.10.
chevron_up_icon
1 out of 8
circle_padding
hide_on_mobile
zoom_out_icon
logo.png

Your All-in-One AI-Powered Toolkit for Academic Success.

Available 24*7 on WhatsApp / Email

[object Object]