Overview of Notifiable Infectious Diseases in Australia, 1991-2011
VerifiedAdded on 2022/10/14
|15
|9110
|411
Report
AI Summary
This report provides a comprehensive overview of the epidemiology of notifiable infectious diseases in Australia from 1991 to 2011, based on the National Notifiable Diseases Surveillance System (NNDSS). The study analyzed 2,421,134 cases across various disease groups, jurisdictions, Indigenous status, age groups, and notification years. Key findings reveal that chlamydial infection, campylobacteriosis, varicella zoster, hepatitis C, influenza, pertussis, salmonellosis, hepatitis B, gonococcal infection, and Ross River virus infection comprised 88% of all notifications. The analysis highlights increasing notification incidence, particularly for sexually transmissible infections and vaccine-preventable diseases, and identifies populations with higher incidence requiring targeted public health interventions. The report emphasizes the importance of surveillance in public health efforts, discusses the limitations of the data, and provides valuable insights for future public health strategies in Australia, including the need for tailored interventions based on high-risk behaviors, food safety, and immunization programs.
An overview of the epidemiology of notifiable infectious diseases
in Australia, 1991–2011
K. B. GIBNEY*, A. C. CHENG, R. HALL AND K. LEDER
Department of Epidemiology and Preventive Medicine, Monash University, The Alfred Centre, Melbourne,
Victoria, Australia
Received 24 February 2016; Final revision 28 April 2016; Accepted 5 May 2016;
first published online 22 June 2016
SUMMARY
We reviewed the first 21 years (1991–2011) of Australia’s National Notifiable Diseases
Surveillance System (NNDSS). All nationally notified diseases (except HIV/AIDS and
Creutzfeldt–Jakob disease) were analysed by disease group (n = 8), jurisdiction (six states
and two territories), Indigenous status, age group and notification year. In total, 2 421 134
cases were analysed. The 10 diseases with highest notification incidence (chlamydial infection,
campylobacteriosis, varicella zoster, hepatitis C, influenza, pertussis, salmonellosis, hepatitis B,
gonococcal infection, and Ross River virus infection) comprised 88% of all notifications. Annual
notification incidence was 591 cases/100 000, highest in the Northern Territory (2598/100 000) and
in children aged <5 years (698/100 000). A total of 8·4% of cases were Indigenous Australians.
Notification incidence increased by 6·4% per year (12% for sexually transmissible infections and
15% for vaccine-preventable diseases). The number of notifiable diseases also increased from 37
to 65. The number and incidence of notifications increased throughout the study period, partly
due to addition of diseases to the NNDSS and increasing availability of sensitive diagnostic tests.
The most commonly notified diseases require a range of public health responses addressing high-
risk sexual and drug-use behaviours, food safety and immunization. Our results highlight
populations with higher notification incidence that might require tailored public health
interventions.
Key words: Analysis of data, Australia, epidemiology, public health, surveillance system.
INTRODUCTION
Surveillance is the cornerstone of public health efforts
to minimize morbidity and mortality resulting from
preventable infectious diseases. Infectious disease sur-
veillance wasinstrumentalin smallpox eradication
and in current efforts towards global polio eradication
and measleselimination.National surveillance sys-
tems allow examination of the epidemiological
profile of important infections at a country leveland
provide oversight to ensure consistent reporting across
jurisdictions [1].
In Australia,notification of selected infectious dis-
eases is required by public health legislation in the
six statesand two territories.Each jurisdiction
definesits own notification listand receivesdata
from doctors and/or laboratories. Primary responsibil-
ity for public health action lies with the state/territory
health departments. Jurisdictions forward de-identified
* Author for correspondence: Dr K. B. Gibney, The Peter Doherty
Institute for Infection and Immunity, 792 Elizabeth Street,
Melbourne 3000 Victoria, Australia.
(Email: Katherine.Gibney@unimelb.edu.au)
Epidemiol. Infect. (2016), 144, 3263–3277.© Cambridge University Press 2016
doi:10.1017/S0950268816001072
https://doi.org/10.1017/S0950268816001072
Downloaded from https:/www.cambridge.org/core. Kainan University, on 10 Feb 2017 at 06:18:55, subject to the Cambridge Core terms of use, available at https:/www.cambridge.org/core/terms.
Paraphrase This Document
Need a fresh take? Get an instant paraphrase of this document with our AI Paraphraser
notificationdata for casesmeetingnational case
definitionsfor diseaseson the National Notifiable
DiseasesList (NNDL) to the National Notifiable
Disease Surveillance System (NNDSS), a passive sur-
veillance system operational since 1991.
A summary ofnationalnotifiable disease surveil-
lance data from 1917 to 1991 highlighted the lack of
consistency,detail,and methodicalreporting ofna-
tionally notifiable diseases before the introduction of
the NNDSS [2]. Annual reportsof NNDSS data
have been produced since 1991;however,trend ana-
lysis of all nationally notifiable diseases has not previ-
ously been performed. We present an overview of the
epidemiology ofall notifiable infectiousdiseasesin
Australia [excludingHIV/AIDS and Creutzfeldt–
Jakob disease (CJD)]during the first 21 years of the
NNDSS, with a view to highlighting diseasesand
population groups with greatest need of public health
intervention to reduce disease incidence.
METHODS
All case notifications of nationally notifiable diseases
to the NNDSS from 1 January 1991 to 31 December
2011 were analysed according to their diagnosis date
[3]. HIV/AIDS and CJD are under different national
surveillancesystemsand were excluded from this
analysis[4]. Notificationswere reported by disease
and categorized into eight disease groups (as per the
NNDL) based on mode of acquisitionand/or
public health strategiesfor controland prevention:
bloodborne viralhepatitis (BBVH),gastrointestinal,
other bacterial,quarantinable,sexually transmissible
infections (STIs), vector-bornediseases(VBDs),
vaccine-preventablediseases(VPDs), and zoonotic
diseases.Diseasesincluded in each group and the
year they becamenotifiableare summarizedin
Table 1. NNDSS diseases were analysed by pathogen
for hepatitis B, hepatitis C, rubella, syphilis, and vari-
cella zoster.
We report the numberand annualincidence of
notified cases nationally and by jurisdiction.For all-
causeand disease-group incidencecalculations,all
notified cases were included and Australian Bureau
of Statistics (ABS)population estimates at30 June
for each study yearwere used [5].Data from the
Northern Territory (NT)were excluded from both
the numerator (number of cases notified) and denom-
inator (population) of incidence calculations for 1994
due to large discrepancies between the study dataset
(extracted in 2012)and online (live)NNDSS data
that has undergone subsequent data cleaning [6]. For
disease-specific incidence calculations,diseases notifi-
able both nationally and in thatjurisdiction were
included (Table 1) with the exceptions of hepatitis B
and C (Victoria 1991–1997),hepatitisB [South
Australian (SA) 1991–1995],tuberculosis(Victoria
1991),and varicella zoster (Victoria 2006–2007) due
to discrepancies with online NNDSS data; the denom-
inator comprisedthe combinedpopulationsfor
included years and jurisdictions.Relative risks (RRs)
were calculated for univariate comparison of notifica-
tion incidence between study sub-periods (1991–1997,
1998–2004, 2005–2011), age groups (<5, 5–19, 20–64,
65–98 years) and jurisdictions for diseases with >400
notifications during the 21-year study period.Three
sub-periods were selected to allow more meaningful
comparison between disease groups/diseases within a
sub-period as well as analysis of change in notification
incidence across these sub-periods for a single disease
or disease group.
Average changesin annualnotification incidence
over the study period were investigated by Poisson re-
gression forall diseasescombined and by disease
group from 1991 to 2011;for individual diseases this
calculation was confined to years the disease was na-
tionally notifiable.Tests for statisticalsignificance
were notperformed aspopulation-based data were
used. To allow international comparison, age-standar-
dized incidence rates were calculated using the WHO
world standard population distribution [7].
Incidence ratesfor Aboriginaland TorresStrait
Islander(‘Indigenous’)Australianswere calculated
for the three jurisdictions reporting Indigenous status
for >75% ofnotified cases[NT, SA, and Western
Australia (WA)] using ABS populationestimates
[8, 9]; cases with unknown Indigenous status were pre-
sumed non-Indigenous.
NNDSS data were provided by the Australian
Government’s Office of Health Protection on behalf
of CommunicableDiseases Network Australia
(CDNA) jurisdictionalmembersin March 2012 as
an extract from the national data file.
Ethical considerations
The projectwas approved by the Monash Human
ResearchEthics Committee(project no. CF11/
2357–201) and CDNA jurisdictionalmembers.Data
were analysed using Stata v.12 (StataCorp.,USA).
This work did not involve human or animal
experimentation.
3264 K. B. Gibney and others
https://doi.org/10.1017/S0950268816001072
Downloaded from https:/www.cambridge.org/core. Kainan University, on 10 Feb 2017 at 06:18:55, subject to the Cambridge Core terms of use, available at https:/www.cambridge.org/core/terms.
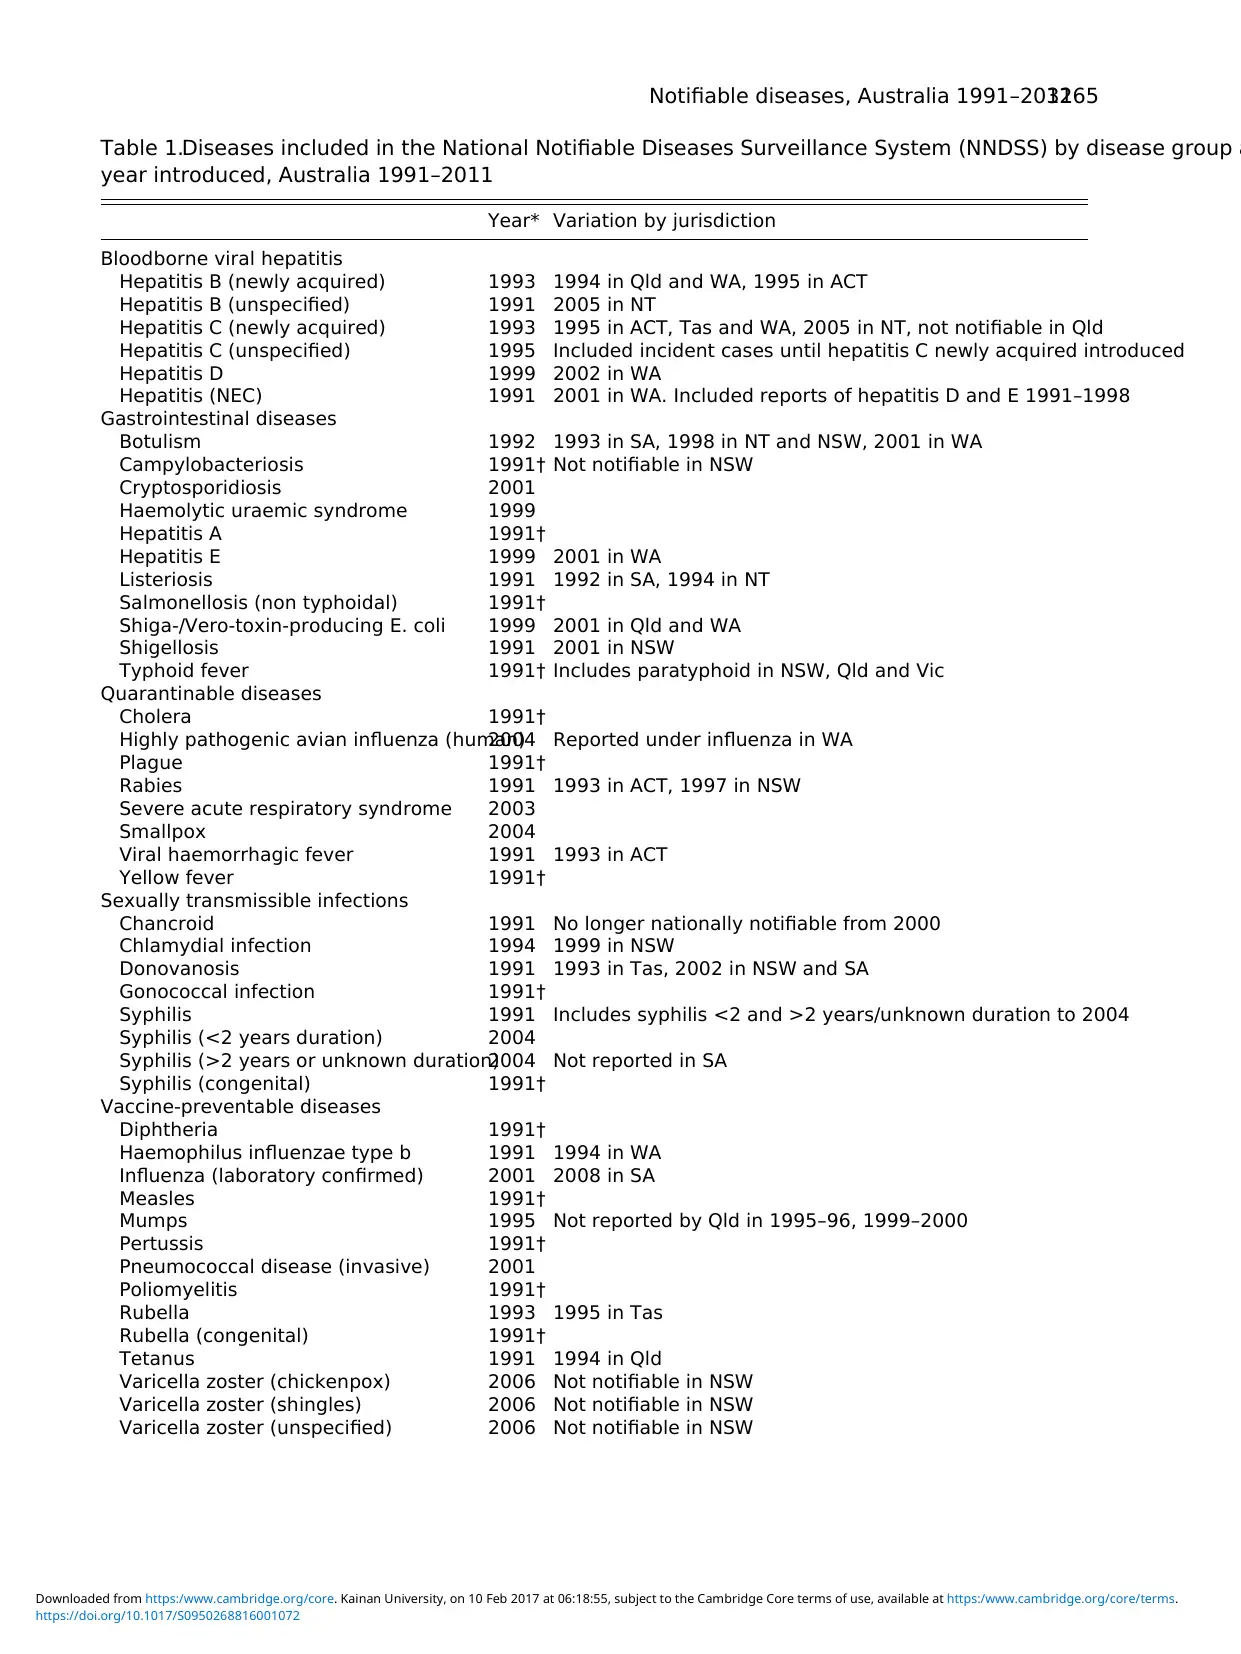
Table 1.Diseases included in the National Notifiable Diseases Surveillance System (NNDSS) by disease group a
year introduced, Australia 1991–2011
Year* Variation by jurisdiction
Bloodborne viral hepatitis
Hepatitis B (newly acquired) 1993 1994 in Qld and WA, 1995 in ACT
Hepatitis B (unspecified) 1991 2005 in NT
Hepatitis C (newly acquired) 1993 1995 in ACT, Tas and WA, 2005 in NT, not notifiable in Qld
Hepatitis C (unspecified) 1995 Included incident cases until hepatitis C newly acquired introduced
Hepatitis D 1999 2002 in WA
Hepatitis (NEC) 1991 2001 in WA. Included reports of hepatitis D and E 1991–1998
Gastrointestinal diseases
Botulism 1992 1993 in SA, 1998 in NT and NSW, 2001 in WA
Campylobacteriosis 1991† Not notifiable in NSW
Cryptosporidiosis 2001
Haemolytic uraemic syndrome 1999
Hepatitis A 1991†
Hepatitis E 1999 2001 in WA
Listeriosis 1991 1992 in SA, 1994 in NT
Salmonellosis (non typhoidal) 1991†
Shiga-/Vero-toxin-producing E. coli 1999 2001 in Qld and WA
Shigellosis 1991 2001 in NSW
Typhoid fever 1991† Includes paratyphoid in NSW, Qld and Vic
Quarantinable diseases
Cholera 1991†
Highly pathogenic avian influenza (human)2004 Reported under influenza in WA
Plague 1991†
Rabies 1991 1993 in ACT, 1997 in NSW
Severe acute respiratory syndrome 2003
Smallpox 2004
Viral haemorrhagic fever 1991 1993 in ACT
Yellow fever 1991†
Sexually transmissible infections
Chancroid 1991 No longer nationally notifiable from 2000
Chlamydial infection 1994 1999 in NSW
Donovanosis 1991 1993 in Tas, 2002 in NSW and SA
Gonococcal infection 1991†
Syphilis 1991 Includes syphilis <2 and >2 years/unknown duration to 2004
Syphilis (<2 years duration) 2004
Syphilis (>2 years or unknown duration)2004 Not reported in SA
Syphilis (congenital) 1991†
Vaccine-preventable diseases
Diphtheria 1991†
Haemophilus influenzae type b 1991 1994 in WA
Influenza (laboratory confirmed) 2001 2008 in SA
Measles 1991†
Mumps 1995 Not reported by Qld in 1995–96, 1999–2000
Pertussis 1991†
Pneumococcal disease (invasive) 2001
Poliomyelitis 1991†
Rubella 1993 1995 in Tas
Rubella (congenital) 1991†
Tetanus 1991 1994 in Qld
Varicella zoster (chickenpox) 2006 Not notifiable in NSW
Varicella zoster (shingles) 2006 Not notifiable in NSW
Varicella zoster (unspecified) 2006 Not notifiable in NSW
Notifiable diseases, Australia 1991–20113265
https://doi.org/10.1017/S0950268816001072
Downloaded from https:/www.cambridge.org/core. Kainan University, on 10 Feb 2017 at 06:18:55, subject to the Cambridge Core terms of use, available at https:/www.cambridge.org/core/terms.
⊘ This is a preview!⊘
Do you want full access?
Subscribe today to unlock all pages.
Trusted by 1+ million students worldwide
RESULTS
The NNDSS contains 2 421 134 notified cases of60
diseases from 1991 to 2011. STIs were most common
[790 990 (32·7%) notifications] and quarantinable dis-
easesleast common (79 notifications,all cholera)
(Table 2, Fig. 1). Chlamydialinfection,notifiable
from 1994,was the most commonly notified disease
[621 431(26%) notifications].The 10 pathogens
with highestnotification incidence were Chlamydia
trachomatis,Campylobacter,varicellazostervirus,
hepatitis C virus, influenza virus, Bordetella pertussis,
Salmonella,hepatitis B virus,Neisseria gonorrhoeae,
and Ross River virus (RRV) (Tables 3 and 4);these
comprised 88% ofall notifications despite campylo-
bacteriosisand varicella zosterinfection notbeing
notifiablein New South Wales (NSW), the most
populousstate.Fewer than 20 notificationswere
received for eightdiseases and no notifications were
received for seven diseases (Table 3).
Notification numbers increased over the study per-
iod, from 43 443 in 1991 (37 notifiable diseases)to
238 164 in 2011 (65 notifiable diseases) (Fig.1). The
nationalannualnotification incidence increased by
an average of6·4% peryear (Fig. 2), rising from
386/100 000 in the earliest sub-period (1991–1997) to
853/100 000in the latest sub-period(2005–2011)
(Table 3). Annual notification incidencefell most
markedly for rubella (average 30% decrease/year), fol-
lowed by Haemophilus influenzae type B (Hib,25%),
measles(23%),and donovanosis(17%)(Table 3).
Rubella and hepatitis A were among the 10 highest in-
cidencediseasesin the earlieststudy sub-period
(Table 4). Conversely,influenza (average33%
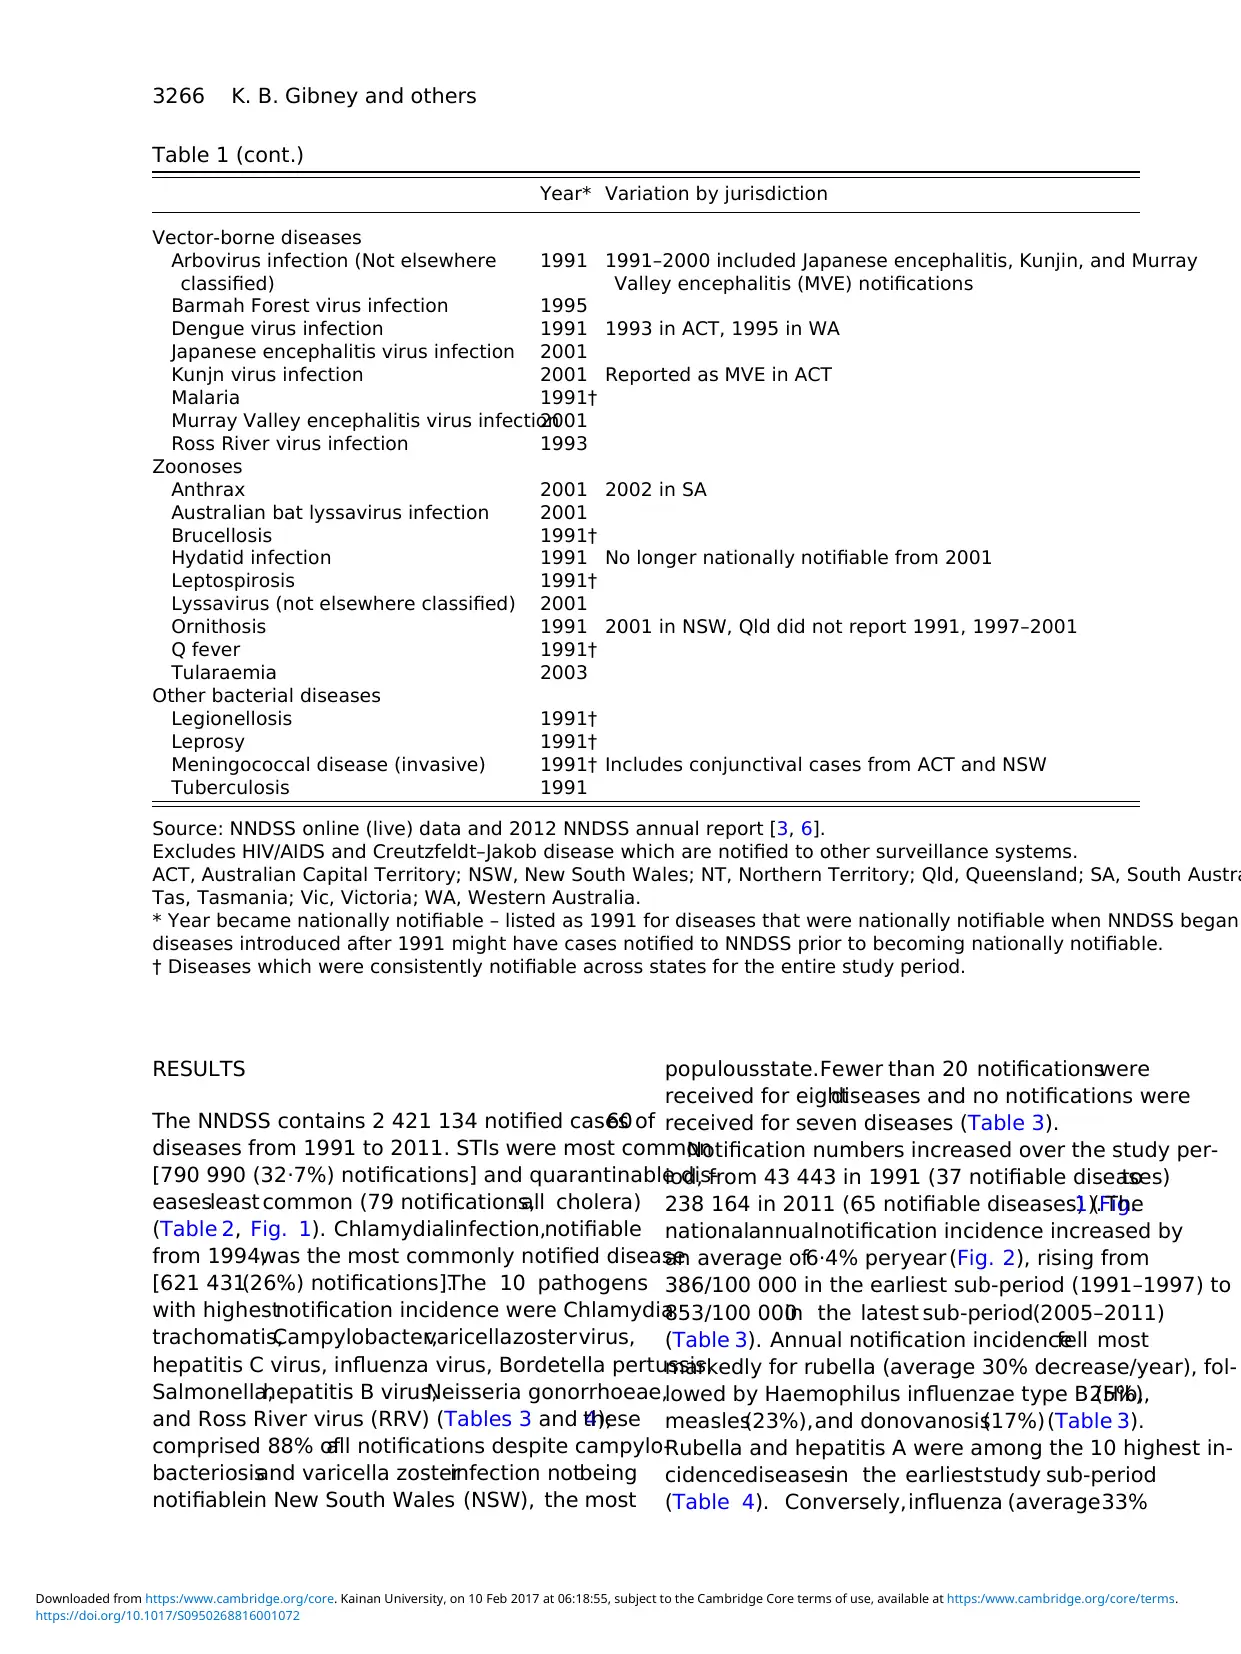
Table 1 (cont.)
Year* Variation by jurisdiction
Vector-borne diseases
Arbovirus infection (Not elsewhere
classified)
1991 1991–2000 included Japanese encephalitis, Kunjin, and Murray
Valley encephalitis (MVE) notifications
Barmah Forest virus infection 1995
Dengue virus infection 1991 1993 in ACT, 1995 in WA
Japanese encephalitis virus infection 2001
Kunjn virus infection 2001 Reported as MVE in ACT
Malaria 1991†
Murray Valley encephalitis virus infection2001
Ross River virus infection 1993
Zoonoses
Anthrax 2001 2002 in SA
Australian bat lyssavirus infection 2001
Brucellosis 1991†
Hydatid infection 1991 No longer nationally notifiable from 2001
Leptospirosis 1991†
Lyssavirus (not elsewhere classified) 2001
Ornithosis 1991 2001 in NSW, Qld did not report 1991, 1997–2001
Q fever 1991†
Tularaemia 2003
Other bacterial diseases
Legionellosis 1991†
Leprosy 1991†
Meningococcal disease (invasive) 1991† Includes conjunctival cases from ACT and NSW
Tuberculosis 1991
Source: NNDSS online (live) data and 2012 NNDSS annual report [3, 6].
Excludes HIV/AIDS and Creutzfeldt–Jakob disease which are notified to other surveillance systems.
ACT, Australian Capital Territory; NSW, New South Wales; NT, Northern Territory; Qld, Queensland; SA, South Austra
Tas, Tasmania; Vic, Victoria; WA, Western Australia.
* Year became nationally notifiable – listed as 1991 for diseases that were nationally notifiable when NNDSS began
diseases introduced after 1991 might have cases notified to NNDSS prior to becoming nationally notifiable.
† Diseases which were consistently notifiable across states for the entire study period.
3266 K. B. Gibney and others
https://doi.org/10.1017/S0950268816001072
Downloaded from https:/www.cambridge.org/core. Kainan University, on 10 Feb 2017 at 06:18:55, subject to the Cambridge Core terms of use, available at https:/www.cambridge.org/core/terms.
The NNDSS contains 2 421 134 notified cases of60
diseases from 1991 to 2011. STIs were most common
[790 990 (32·7%) notifications] and quarantinable dis-
easesleast common (79 notifications,all cholera)
(Table 2, Fig. 1). Chlamydialinfection,notifiable
from 1994,was the most commonly notified disease
[621 431(26%) notifications].The 10 pathogens
with highestnotification incidence were Chlamydia
trachomatis,Campylobacter,varicellazostervirus,
hepatitis C virus, influenza virus, Bordetella pertussis,
Salmonella,hepatitis B virus,Neisseria gonorrhoeae,
and Ross River virus (RRV) (Tables 3 and 4);these
comprised 88% ofall notifications despite campylo-
bacteriosisand varicella zosterinfection notbeing
notifiablein New South Wales (NSW), the most
populousstate.Fewer than 20 notificationswere
received for eightdiseases and no notifications were
received for seven diseases (Table 3).
Notification numbers increased over the study per-
iod, from 43 443 in 1991 (37 notifiable diseases)to
238 164 in 2011 (65 notifiable diseases) (Fig.1). The
nationalannualnotification incidence increased by
an average of6·4% peryear (Fig. 2), rising from
386/100 000 in the earliest sub-period (1991–1997) to
853/100 000in the latest sub-period(2005–2011)
(Table 3). Annual notification incidencefell most
markedly for rubella (average 30% decrease/year), fol-
lowed by Haemophilus influenzae type B (Hib,25%),
measles(23%),and donovanosis(17%)(Table 3).
Rubella and hepatitis A were among the 10 highest in-
cidencediseasesin the earlieststudy sub-period
(Table 4). Conversely,influenza (average33%
Table 1 (cont.)
Year* Variation by jurisdiction
Vector-borne diseases
Arbovirus infection (Not elsewhere
classified)
1991 1991–2000 included Japanese encephalitis, Kunjin, and Murray
Valley encephalitis (MVE) notifications
Barmah Forest virus infection 1995
Dengue virus infection 1991 1993 in ACT, 1995 in WA
Japanese encephalitis virus infection 2001
Kunjn virus infection 2001 Reported as MVE in ACT
Malaria 1991†
Murray Valley encephalitis virus infection2001
Ross River virus infection 1993
Zoonoses
Anthrax 2001 2002 in SA
Australian bat lyssavirus infection 2001
Brucellosis 1991†
Hydatid infection 1991 No longer nationally notifiable from 2001
Leptospirosis 1991†
Lyssavirus (not elsewhere classified) 2001
Ornithosis 1991 2001 in NSW, Qld did not report 1991, 1997–2001
Q fever 1991†
Tularaemia 2003
Other bacterial diseases
Legionellosis 1991†
Leprosy 1991†
Meningococcal disease (invasive) 1991† Includes conjunctival cases from ACT and NSW
Tuberculosis 1991
Source: NNDSS online (live) data and 2012 NNDSS annual report [3, 6].
Excludes HIV/AIDS and Creutzfeldt–Jakob disease which are notified to other surveillance systems.
ACT, Australian Capital Territory; NSW, New South Wales; NT, Northern Territory; Qld, Queensland; SA, South Austra
Tas, Tasmania; Vic, Victoria; WA, Western Australia.
* Year became nationally notifiable – listed as 1991 for diseases that were nationally notifiable when NNDSS began
diseases introduced after 1991 might have cases notified to NNDSS prior to becoming nationally notifiable.
† Diseases which were consistently notifiable across states for the entire study period.
3266 K. B. Gibney and others
https://doi.org/10.1017/S0950268816001072
Downloaded from https:/www.cambridge.org/core. Kainan University, on 10 Feb 2017 at 06:18:55, subject to the Cambridge Core terms of use, available at https:/www.cambridge.org/core/terms.
Paraphrase This Document
Need a fresh take? Get an instant paraphrase of this document with our AI Paraphraser
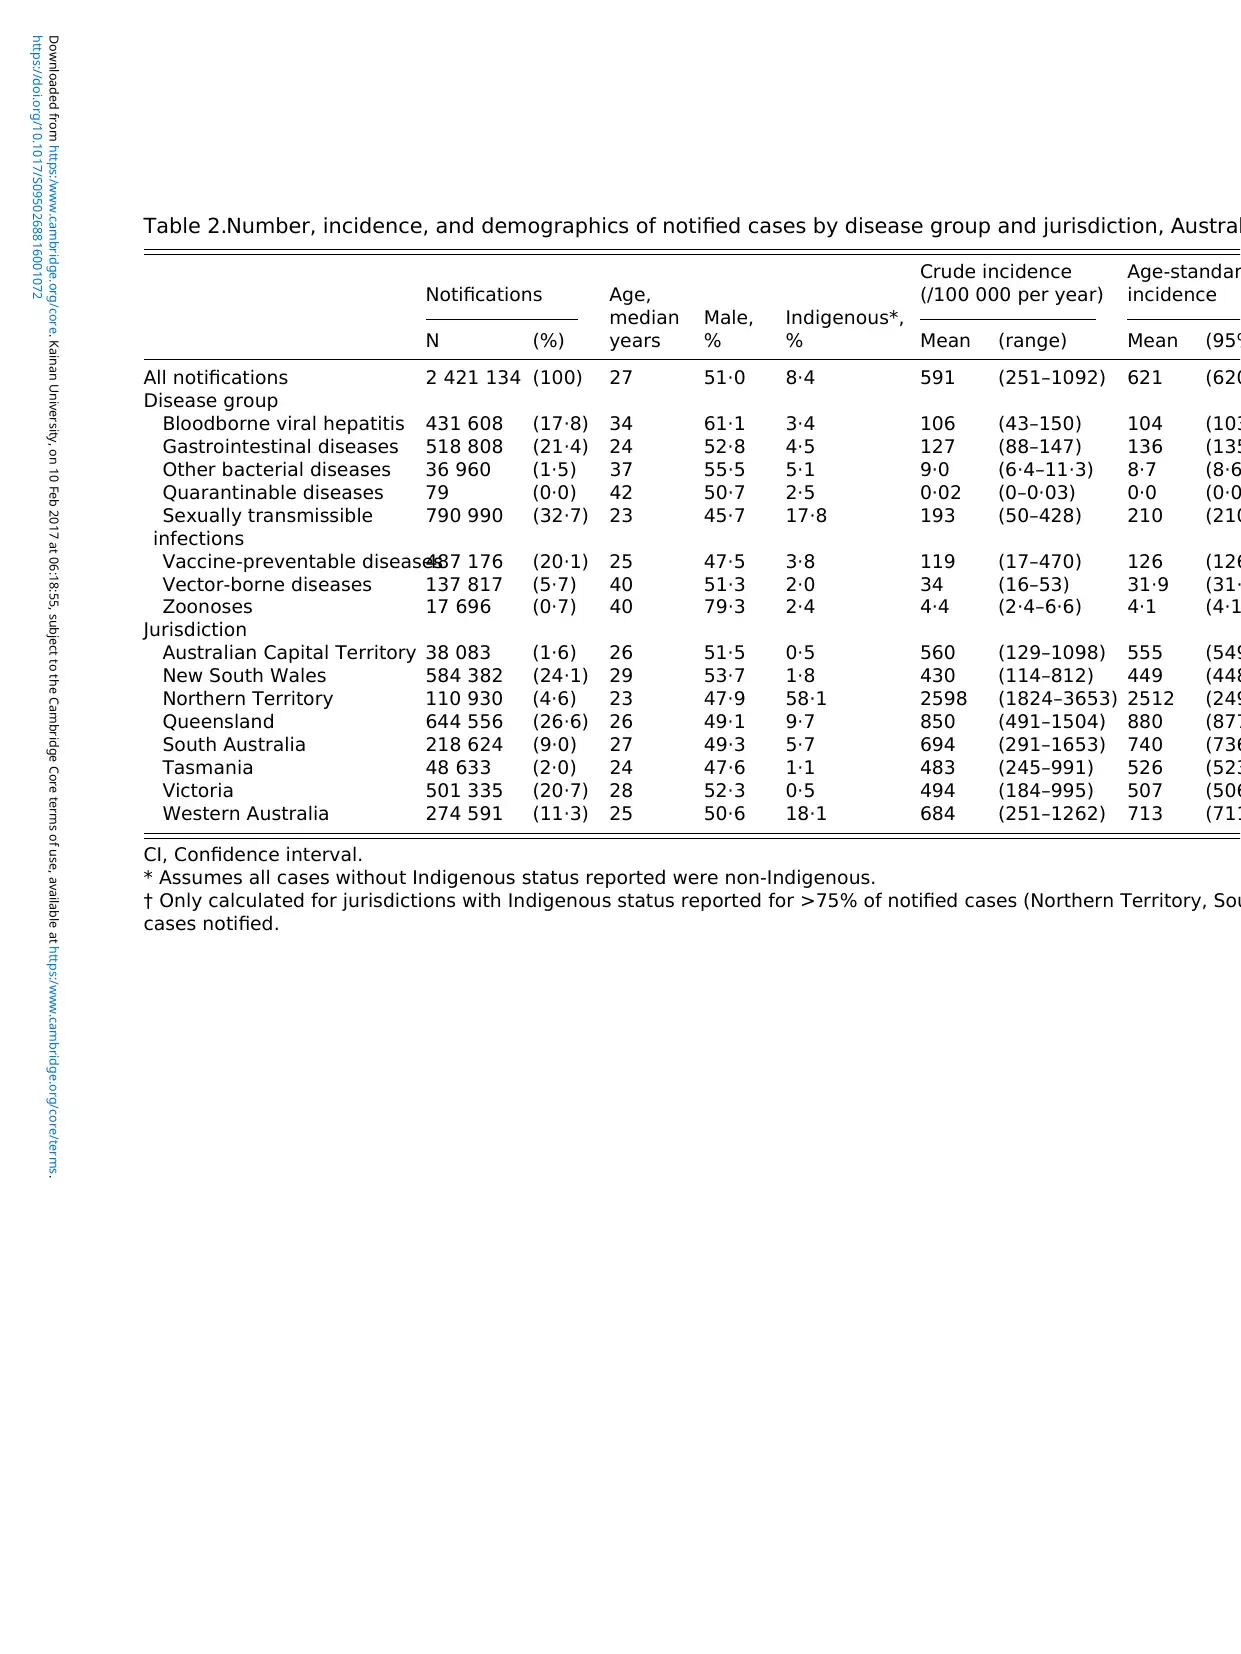
Table 2.Number, incidence, and demographics of notified cases by disease group and jurisdiction, Austral
Notifications Age,
median
years
Male,
%
Indigenous*,
%
Crude incidence
(/100 000 per year)
Age-standar
incidence
N (%) Mean (range) Mean (95%
All notifications 2 421 134 (100) 27 51·0 8·4 591 (251–1092) 621 (620
Disease group
Bloodborne viral hepatitis 431 608 (17·8) 34 61·1 3·4 106 (43–150) 104 (103
Gastrointestinal diseases 518 808 (21·4) 24 52·8 4·5 127 (88–147) 136 (135
Other bacterial diseases 36 960 (1·5) 37 55·5 5·1 9·0 (6·4–11·3) 8·7 (8·6
Quarantinable diseases 79 (0·0) 42 50·7 2·5 0·02 (0–0·03) 0·0 (0·0
Sexually transmissible
infections
790 990 (32·7) 23 45·7 17·8 193 (50–428) 210 (210
Vaccine-preventable diseases487 176 (20·1) 25 47·5 3·8 119 (17–470) 126 (126
Vector-borne diseases 137 817 (5·7) 40 51·3 2·0 34 (16–53) 31·9 (31·
Zoonoses 17 696 (0·7) 40 79·3 2·4 4·4 (2·4–6·6) 4·1 (4·1
Jurisdiction
Australian Capital Territory 38 083 (1·6) 26 51·5 0·5 560 (129–1098) 555 (549
New South Wales 584 382 (24·1) 29 53·7 1·8 430 (114–812) 449 (448
Northern Territory 110 930 (4·6) 23 47·9 58·1 2598 (1824–3653) 2512 (249
Queensland 644 556 (26·6) 26 49·1 9·7 850 (491–1504) 880 (877
South Australia 218 624 (9·0) 27 49·3 5·7 694 (291–1653) 740 (736
Tasmania 48 633 (2·0) 24 47·6 1·1 483 (245–991) 526 (523
Victoria 501 335 (20·7) 28 52·3 0·5 494 (184–995) 507 (506
Western Australia 274 591 (11·3) 25 50·6 18·1 684 (251–1262) 713 (711
CI, Confidence interval.
* Assumes all cases without Indigenous status reported were non-Indigenous.
† Only calculated for jurisdictions with Indigenous status reported for >75% of notified cases (Northern Territory, Sou
cases notified.
https://doi.org/10.1017/S0950268816001072
Downloaded from https:/www.cambridge.org/core. Kainan University, on 10 Feb 2017 at 06:18:55, subject to the Cambridge Core terms of use, available at https:/www.cambridge.org/core/terms.
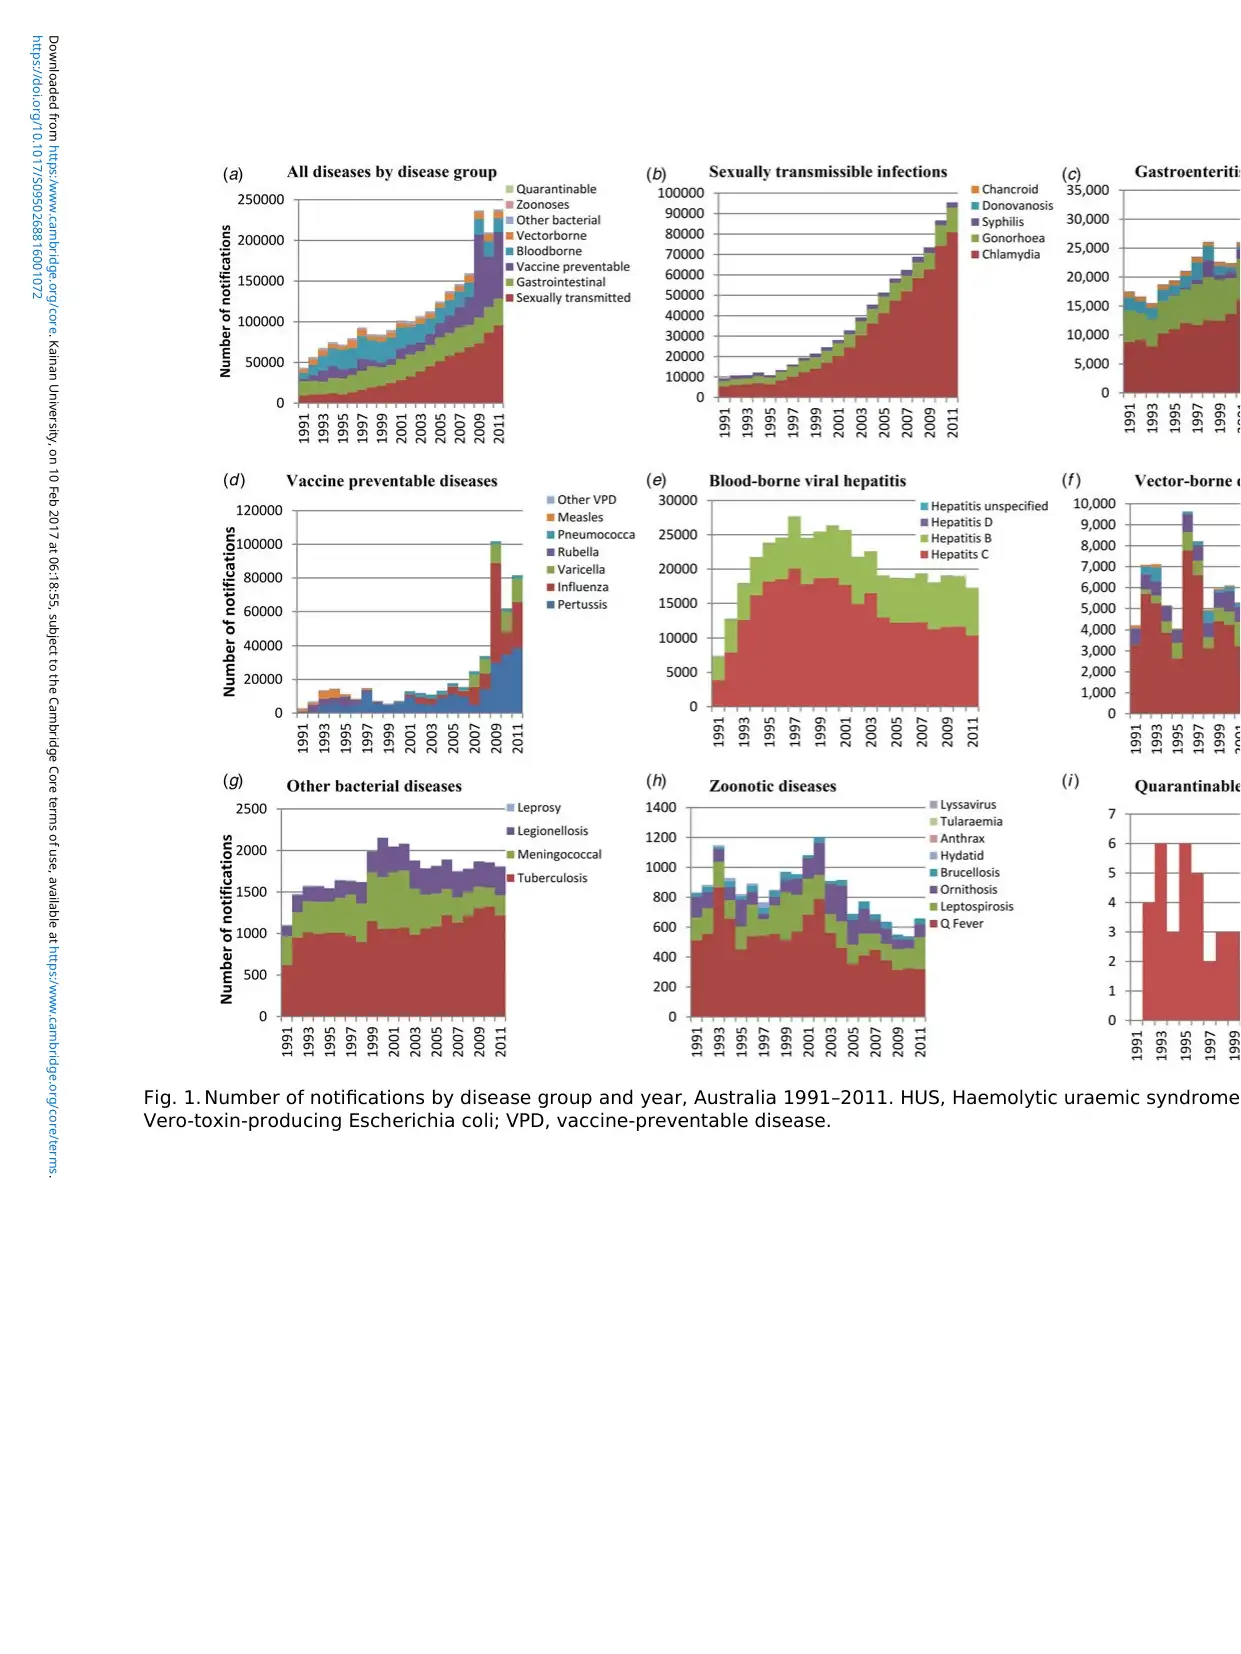
Fig. 1. Number of notifications by disease group and year, Australia 1991–2011. HUS, Haemolytic uraemic syndrome
Vero-toxin-producing Escherichia coli; VPD, vaccine-preventable disease.
https://doi.org/10.1017/S0950268816001072
Downloaded from https:/www.cambridge.org/core. Kainan University, on 10 Feb 2017 at 06:18:55, subject to the Cambridge Core terms of use, available at https:/www.cambridge.org/core/terms.
⊘ This is a preview!⊘
Do you want full access?
Subscribe today to unlock all pages.
Trusted by 1+ million students worldwide
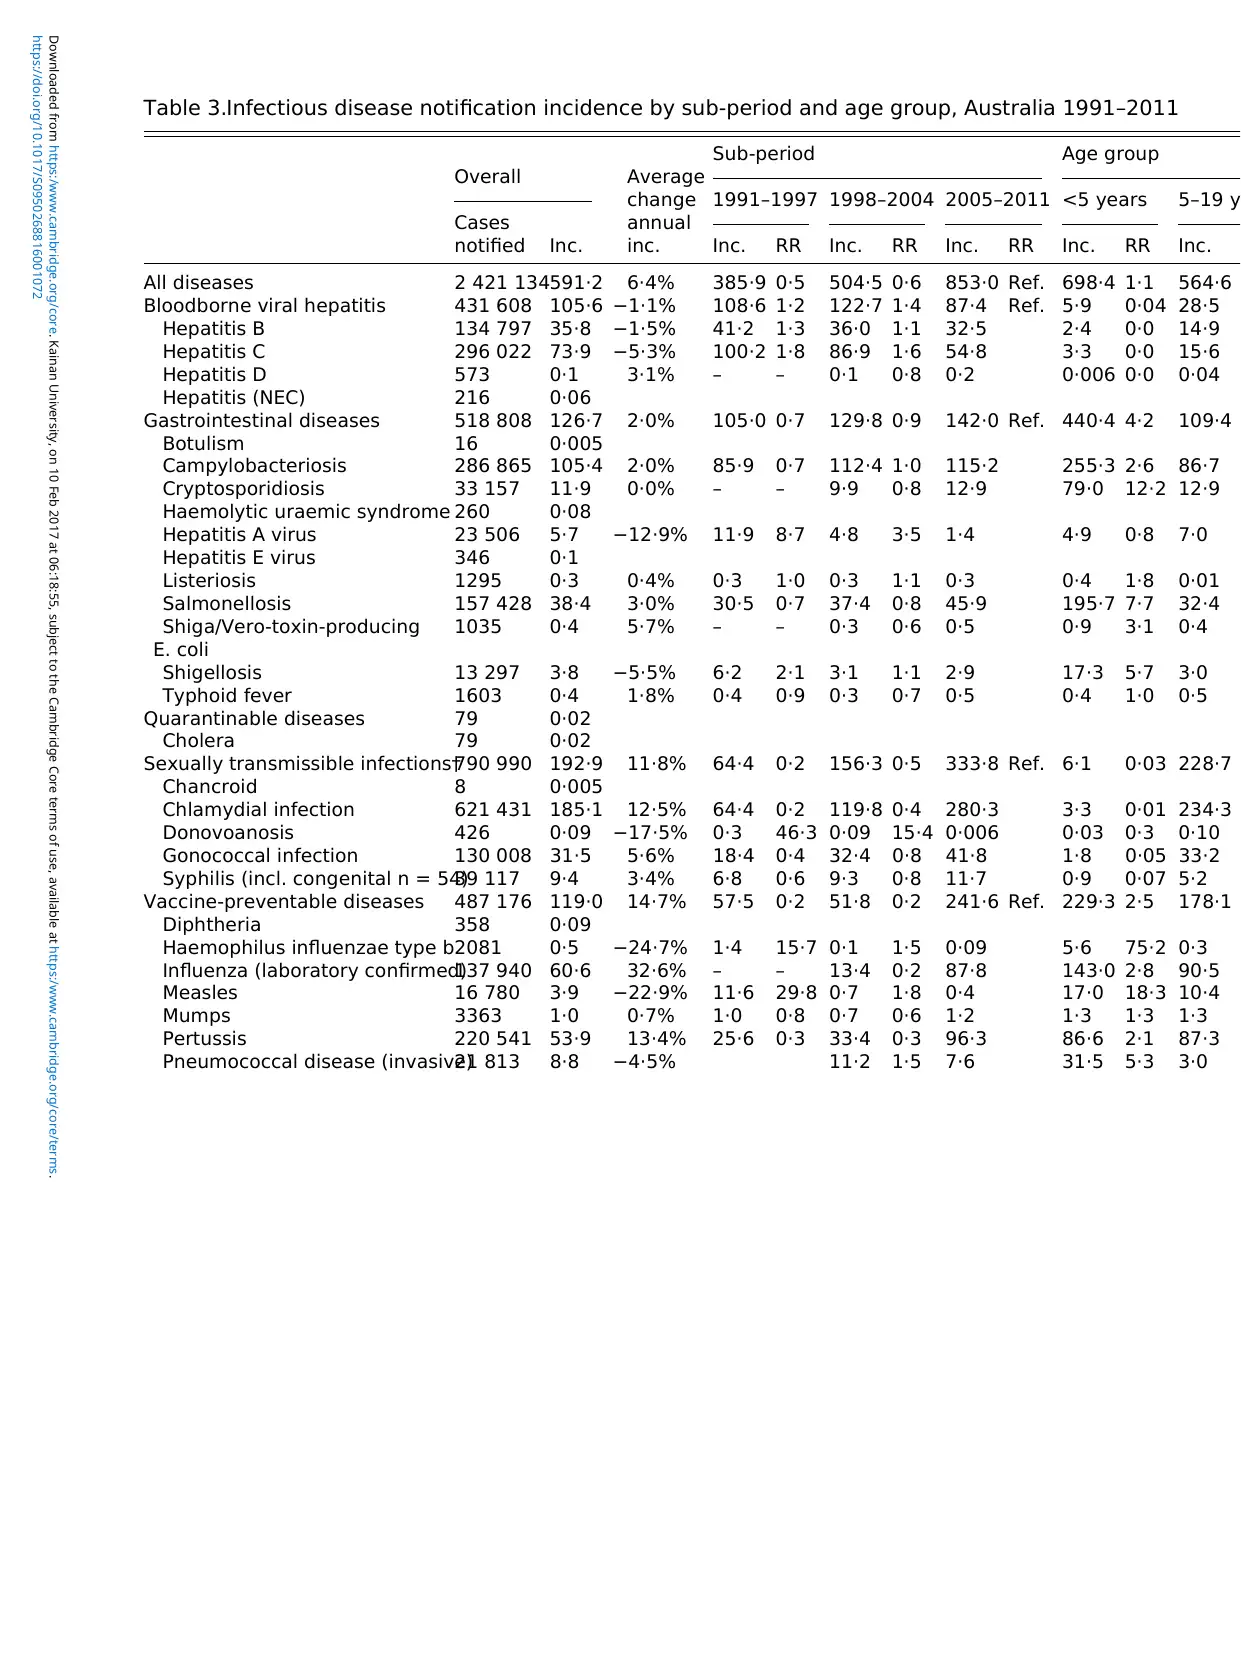
Table 3.Infectious disease notification incidence by sub-period and age group, Australia 1991–2011
Overall Average
change
annual
inc.
Sub-period Age group
Cases
notified Inc.
1991–1997 1998–2004 2005–2011 <5 years 5–19 y
Inc. RR Inc. RR Inc. RR Inc. RR Inc.
All diseases 2 421 134591·2 6·4% 385·9 0·5 504·5 0·6 853·0 Ref. 698·4 1·1 564·6
Bloodborne viral hepatitis 431 608 105·6 −1·1% 108·6 1·2 122·7 1·4 87·4 Ref. 5·9 0·04 28·5
Hepatitis B 134 797 35·8 −1·5% 41·2 1·3 36·0 1·1 32·5 2·4 0·0 14·9
Hepatitis C 296 022 73·9 −5·3% 100·2 1·8 86·9 1·6 54·8 3·3 0·0 15·6
Hepatitis D 573 0·1 3·1% – – 0·1 0·8 0·2 0·006 0·0 0·04
Hepatitis (NEC) 216 0·06
Gastrointestinal diseases 518 808 126·7 2·0% 105·0 0·7 129·8 0·9 142·0 Ref. 440·4 4·2 109·4
Botulism 16 0·005
Campylobacteriosis 286 865 105·4 2·0% 85·9 0·7 112·4 1·0 115·2 255·3 2·6 86·7
Cryptosporidiosis 33 157 11·9 0·0% – – 9·9 0·8 12·9 79·0 12·2 12·9
Haemolytic uraemic syndrome 260 0·08
Hepatitis A virus 23 506 5·7 −12·9% 11·9 8·7 4·8 3·5 1·4 4·9 0·8 7·0
Hepatitis E virus 346 0·1
Listeriosis 1295 0·3 0·4% 0·3 1·0 0·3 1·1 0·3 0·4 1·8 0·01
Salmonellosis 157 428 38·4 3·0% 30·5 0·7 37·4 0·8 45·9 195·7 7·7 32·4
Shiga/Vero-toxin-producing
E. coli
1035 0·4 5·7% – – 0·3 0·6 0·5 0·9 3·1 0·4
Shigellosis 13 297 3·8 −5·5% 6·2 2·1 3·1 1·1 2·9 17·3 5·7 3·0
Typhoid fever 1603 0·4 1·8% 0·4 0·9 0·3 0·7 0·5 0·4 1·0 0·5
Quarantinable diseases 79 0·02
Cholera 79 0·02
Sexually transmissible infections†790 990 192·9 11·8% 64·4 0·2 156·3 0·5 333·8 Ref. 6·1 0·03 228·7
Chancroid 8 0·005
Chlamydial infection 621 431 185·1 12·5% 64·4 0·2 119·8 0·4 280·3 3·3 0·01 234·3
Donovoanosis 426 0·09 −17·5% 0·3 46·3 0·09 15·4 0·006 0·03 0·3 0·10
Gonococcal infection 130 008 31·5 5·6% 18·4 0·4 32·4 0·8 41·8 1·8 0·05 33·2
Syphilis (incl. congenital n = 54)39 117 9·4 3·4% 6·8 0·6 9·3 0·8 11·7 0·9 0·07 5·2
Vaccine-preventable diseases 487 176 119·0 14·7% 57·5 0·2 51·8 0·2 241·6 Ref. 229·3 2·5 178·1
Diphtheria 358 0·09
Haemophilus influenzae type b2081 0·5 −24·7% 1·4 15·7 0·1 1·5 0·09 5·6 75·2 0·3
Influenza (laboratory confirmed)137 940 60·6 32·6% – – 13·4 0·2 87·8 143·0 2·8 90·5
Measles 16 780 3·9 −22·9% 11·6 29·8 0·7 1·8 0·4 17·0 18·3 10·4
Mumps 3363 1·0 0·7% 1·0 0·8 0·7 0·6 1·2 1·3 1·3 1·3
Pertussis 220 541 53·9 13·4% 25·6 0·3 33·4 0·3 96·3 86·6 2·1 87·3
Pneumococcal disease (invasive)21 813 8·8 −4·5% 11·2 1·5 7·6 31·5 5·3 3·0
https://doi.org/10.1017/S0950268816001072
Downloaded from https:/www.cambridge.org/core. Kainan University, on 10 Feb 2017 at 06:18:55, subject to the Cambridge Core terms of use, available at https:/www.cambridge.org/core/terms.
Paraphrase This Document
Need a fresh take? Get an instant paraphrase of this document with our AI Paraphraser
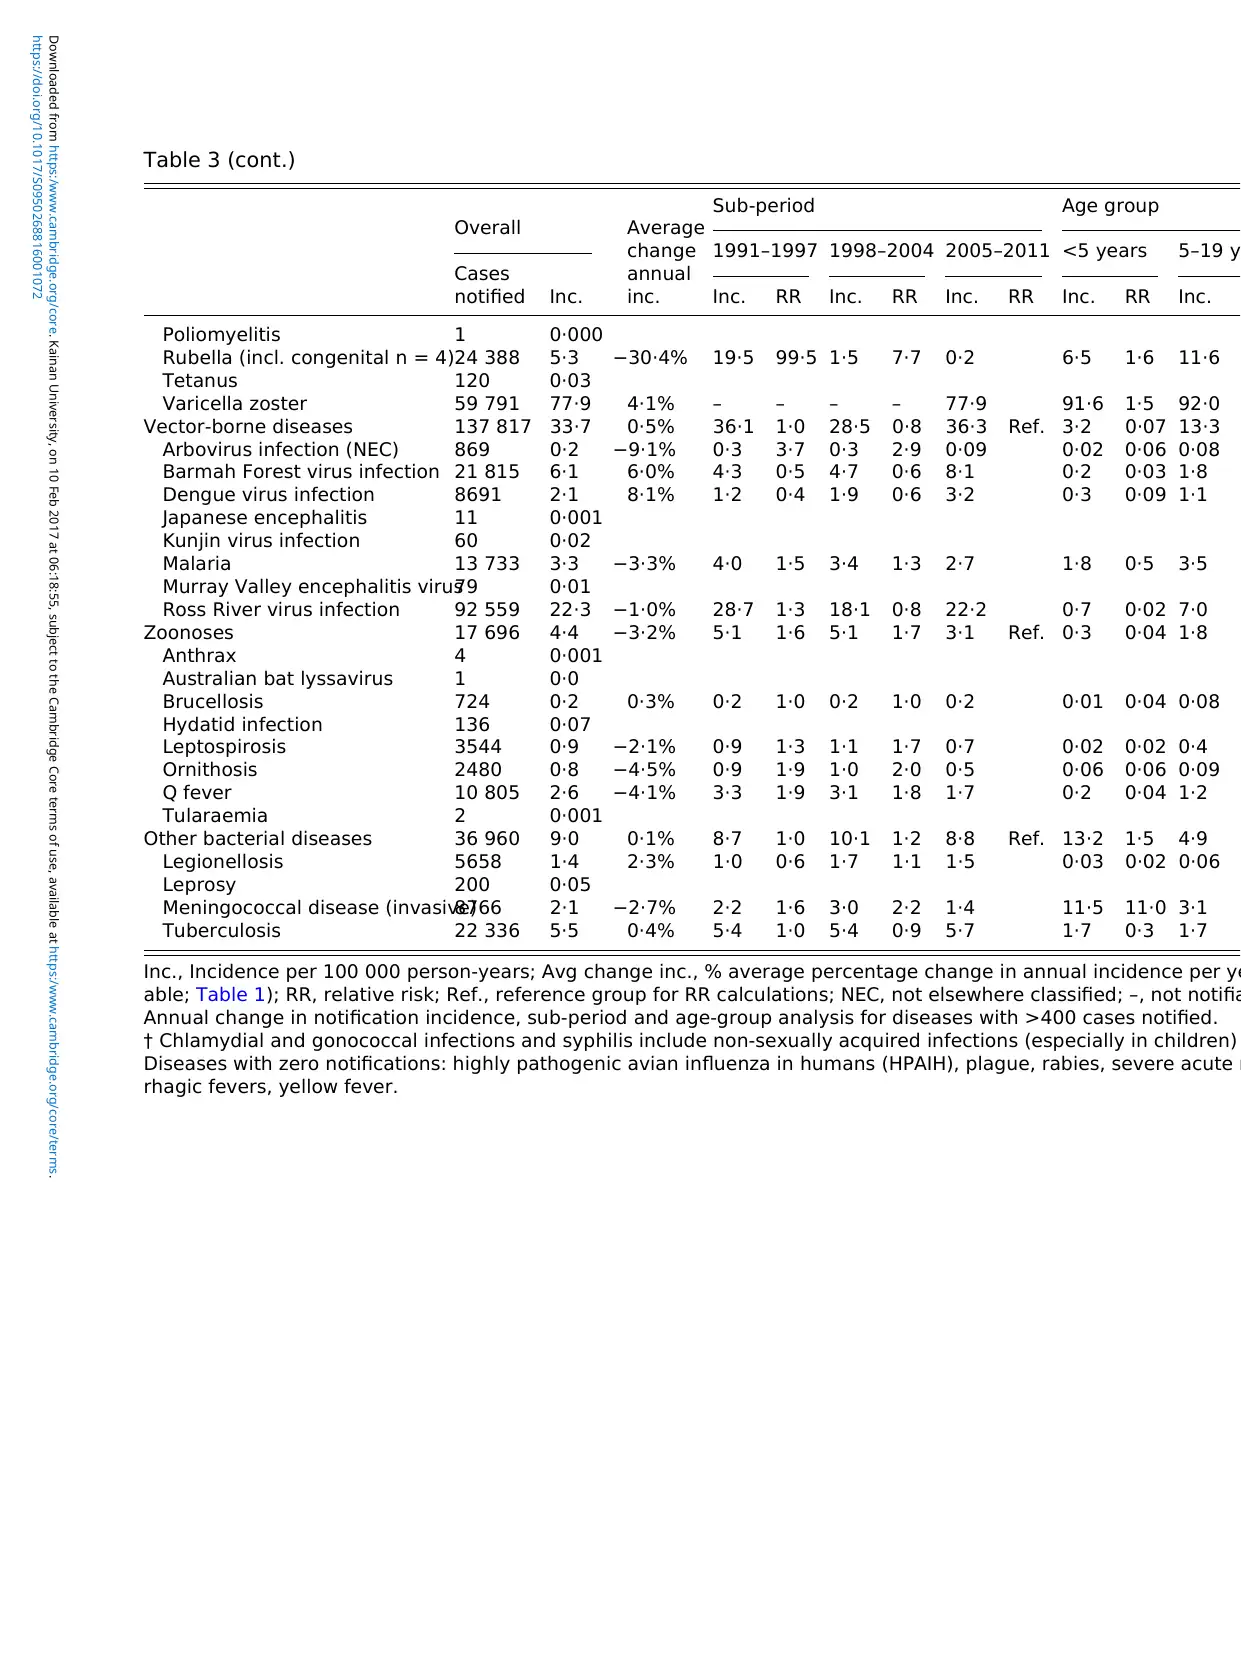
Table 3 (cont.)
Overall Average
change
annual
inc.
Sub-period Age group
Cases
notified Inc.
1991–1997 1998–2004 2005–2011 <5 years 5–19 y
Inc. RR Inc. RR Inc. RR Inc. RR Inc.
Poliomyelitis 1 0·000
Rubella (incl. congenital n = 4)24 388 5·3 −30·4% 19·5 99·5 1·5 7·7 0·2 6·5 1·6 11·6
Tetanus 120 0·03
Varicella zoster 59 791 77·9 4·1% – – – – 77·9 91·6 1·5 92·0
Vector-borne diseases 137 817 33·7 0·5% 36·1 1·0 28·5 0·8 36·3 Ref. 3·2 0·07 13·3
Arbovirus infection (NEC) 869 0·2 −9·1% 0·3 3·7 0·3 2·9 0·09 0·02 0·06 0·08
Barmah Forest virus infection 21 815 6·1 6·0% 4·3 0·5 4·7 0·6 8·1 0·2 0·03 1·8
Dengue virus infection 8691 2·1 8·1% 1·2 0·4 1·9 0·6 3·2 0·3 0·09 1·1
Japanese encephalitis 11 0·001
Kunjin virus infection 60 0·02
Malaria 13 733 3·3 −3·3% 4·0 1·5 3·4 1·3 2·7 1·8 0·5 3·5
Murray Valley encephalitis virus79 0·01
Ross River virus infection 92 559 22·3 −1·0% 28·7 1·3 18·1 0·8 22·2 0·7 0·02 7·0
Zoonoses 17 696 4·4 −3·2% 5·1 1·6 5·1 1·7 3·1 Ref. 0·3 0·04 1·8
Anthrax 4 0·001
Australian bat lyssavirus 1 0·0
Brucellosis 724 0·2 0·3% 0·2 1·0 0·2 1·0 0·2 0·01 0·04 0·08
Hydatid infection 136 0·07
Leptospirosis 3544 0·9 −2·1% 0·9 1·3 1·1 1·7 0·7 0·02 0·02 0·4
Ornithosis 2480 0·8 −4·5% 0·9 1·9 1·0 2·0 0·5 0·06 0·06 0·09
Q fever 10 805 2·6 −4·1% 3·3 1·9 3·1 1·8 1·7 0·2 0·04 1·2
Tularaemia 2 0·001
Other bacterial diseases 36 960 9·0 0·1% 8·7 1·0 10·1 1·2 8·8 Ref. 13·2 1·5 4·9
Legionellosis 5658 1·4 2·3% 1·0 0·6 1·7 1·1 1·5 0·03 0·02 0·06
Leprosy 200 0·05
Meningococcal disease (invasive)8766 2·1 −2·7% 2·2 1·6 3·0 2·2 1·4 11·5 11·0 3·1
Tuberculosis 22 336 5·5 0·4% 5·4 1·0 5·4 0·9 5·7 1·7 0·3 1·7
Inc., Incidence per 100 000 person-years; Avg change inc., % average percentage change in annual incidence per ye
able; Table 1); RR, relative risk; Ref., reference group for RR calculations; NEC, not elsewhere classified; –, not notifia
Annual change in notification incidence, sub-period and age-group analysis for diseases with >400 cases notified.
† Chlamydial and gonococcal infections and syphilis include non-sexually acquired infections (especially in children)
Diseases with zero notifications: highly pathogenic avian influenza in humans (HPAIH), plague, rabies, severe acute r
rhagic fevers, yellow fever.
https://doi.org/10.1017/S0950268816001072
Downloaded from https:/www.cambridge.org/core. Kainan University, on 10 Feb 2017 at 06:18:55, subject to the Cambridge Core terms of use, available at https:/www.cambridge.org/core/terms.
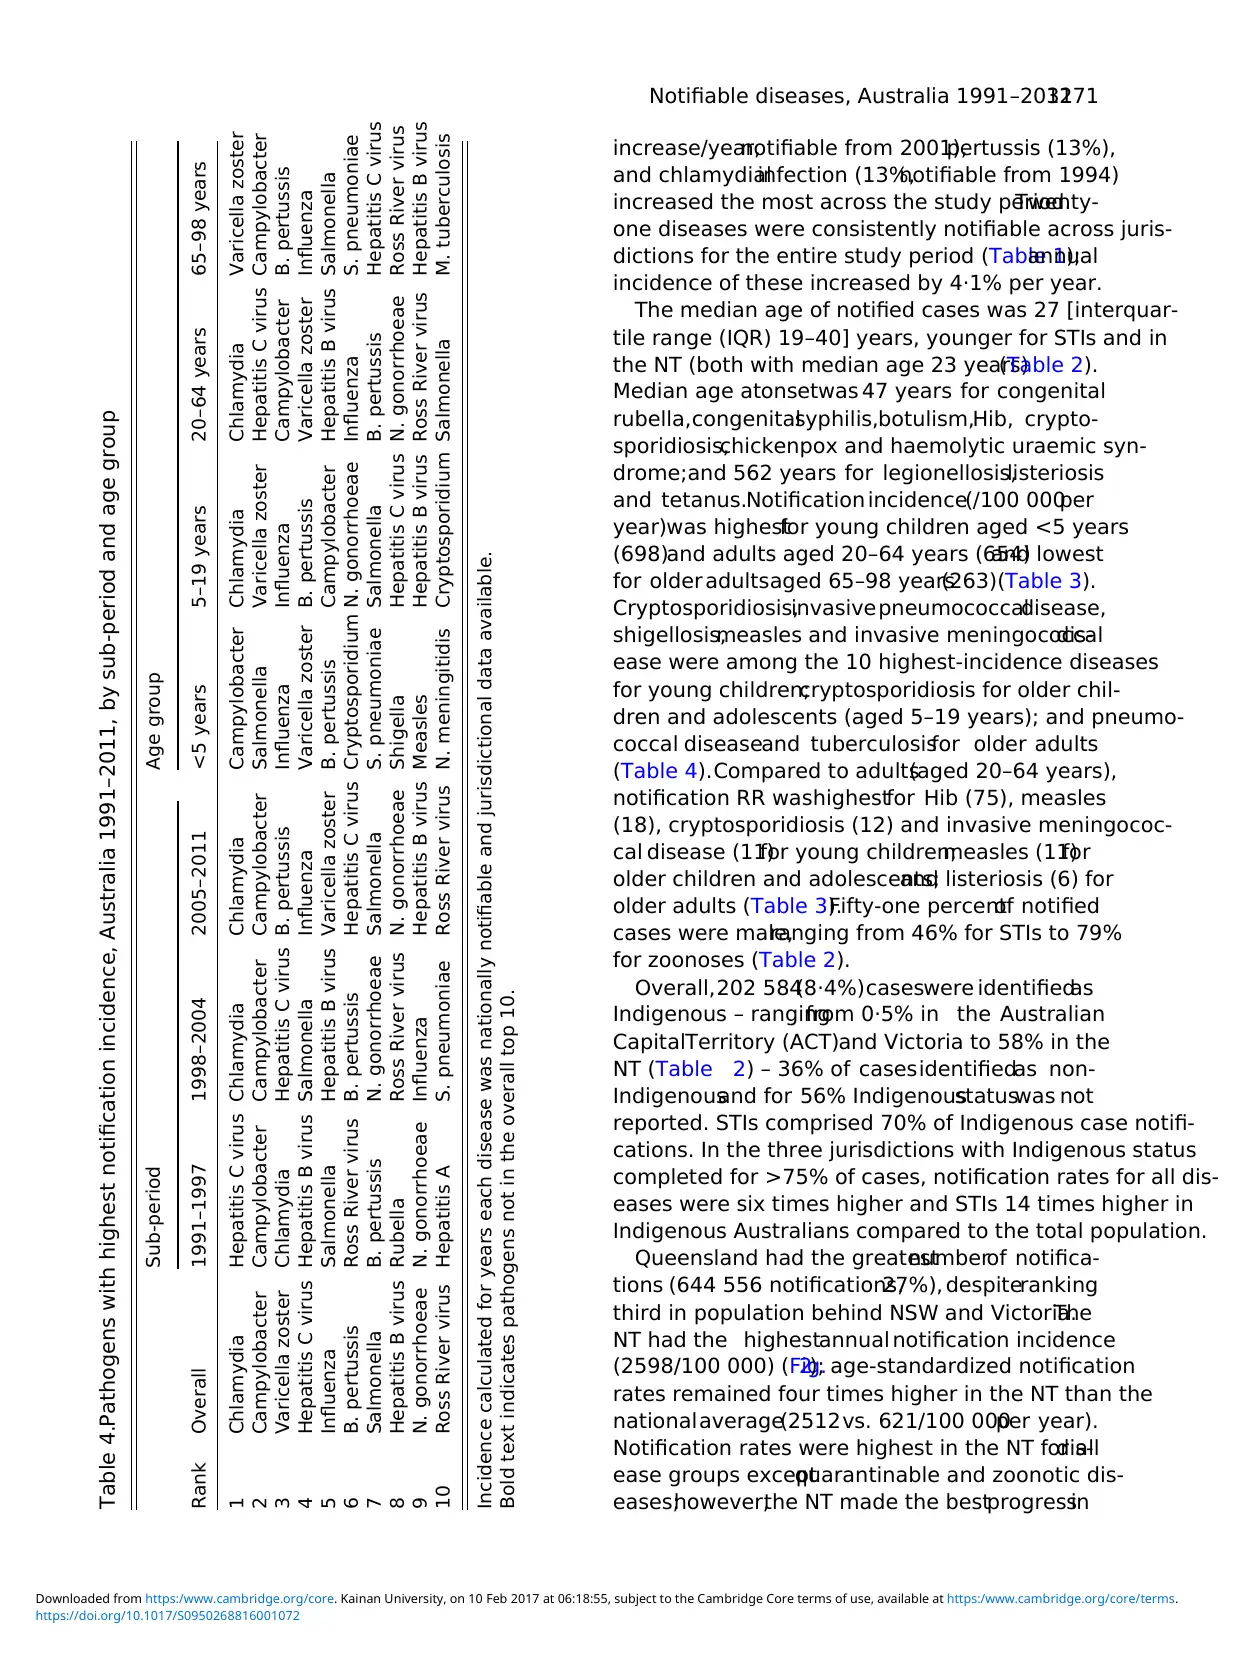
increase/year,notifiable from 2001),pertussis (13%),
and chlamydialinfection (13%,notifiable from 1994)
increased the most across the study period.Twenty-
one diseases were consistently notifiable across juris-
dictions for the entire study period (Table 1);annual
incidence of these increased by 4·1% per year.
The median age of notified cases was 27 [interquar-
tile range (IQR) 19–40] years, younger for STIs and in
the NT (both with median age 23 years)(Table 2).
Median age atonsetwas 47 years for congenital
rubella,congenitalsyphilis,botulism,Hib, crypto-
sporidiosis,chickenpox and haemolytic uraemic syn-
drome;and 562 years for legionellosis,listeriosis
and tetanus.Notification incidence(/100 000per
year)was highestfor young children aged <5 years
(698)and adults aged 20–64 years (654)and lowest
for older adultsaged 65–98 years(263)(Table 3).
Cryptosporidiosis,invasivepneumococcaldisease,
shigellosis,measles and invasive meningococcaldis-
ease were among the 10 highest-incidence diseases
for young children;cryptosporidiosis for older chil-
dren and adolescents (aged 5–19 years); and pneumo-
coccal diseaseand tuberculosisfor older adults
(Table 4).Compared to adults(aged 20–64 years),
notification RR washighestfor Hib (75), measles
(18), cryptosporidiosis (12) and invasive meningococ-
cal disease (11)for young children;measles (11)for
older children and adolescents;and listeriosis (6) for
older adults (Table 3).Fifty-one percentof notified
cases were male,ranging from 46% for STIs to 79%
for zoonoses (Table 2).
Overall,202 584(8·4%)caseswere identifiedas
Indigenous – rangingfrom 0·5% in the Australian
CapitalTerritory (ACT)and Victoria to 58% in the
NT (Table 2) – 36% of casesidentifiedas non-
Indigenousand for 56% Indigenousstatuswas not
reported. STIs comprised 70% of Indigenous case notifi-
cations. In the three jurisdictions with Indigenous status
completed for >75% of cases, notification rates for all dis-
eases were six times higher and STIs 14 times higher in
Indigenous Australians compared to the total population.
Queensland had the greatestnumberof notifica-
tions (644 556 notifications,27%), despiteranking
third in population behind NSW and Victoria.The
NT had the highestannual notification incidence
(2598/100 000) (Fig.2); age-standardized notification
rates remained four times higher in the NT than the
nationalaverage(2512vs. 621/100 000per year).
Notification rates were highest in the NT for alldis-
ease groups exceptquarantinable and zoonotic dis-
eases;however,the NT made the bestprogressin
Table 4.Pathogens with highest notification incidence, Australia 1991–2011, by sub-period and age group
Rank Overall
Sub-period Age group
1991–1997 1998–2004 2005–2011 <5 years 5–19 years 20–64 years 65–98 years
1 Chlamydia Hepatitis C virus Chlamydia Chlamydia Campylobacter Chlamydia Chlamydia Varicella zoster
2 Campylobacter Campylobacter Campylobacter Campylobacter Salmonella Varicella zoster Hepatitis C virus Campylobacter
3 Varicella zoster Chlamydia Hepatitis C virus B. pertussis Influenza Influenza Campylobacter B. pertussis
4 Hepatitis C virus Hepatitis B virus Salmonella Influenza Varicella zoster B. pertussis Varicella zoster Influenza
5 Influenza Salmonella Hepatitis B virus Varicella zoster B. pertussis Campylobacter Hepatitis B virus Salmonella
6 B. pertussis Ross River virus B. pertussis Hepatitis C virus Cryptosporidium N. gonorrhoeae Influenza S. pneumoniae
7 Salmonella B. pertussis N. gonorrhoeae Salmonella S. pneumoniae Salmonella B. pertussis Hepatitis C virus
8 Hepatitis B virus Rubella Ross River virus N. gonorrhoeae Shigella Hepatitis C virus N. gonorrhoeae Ross River virus
9 N. gonorrhoeae N. gonorrhoeae Influenza Hepatitis B virus Measles Hepatitis B virus Ross River virus Hepatitis B virus
10 Ross River virus Hepatitis A S. pneumoniae Ross River virus N. meningitidis Cryptosporidium Salmonella M. tuberculosis
Incidence calculated for years each disease was nationally notifiable and jurisdictional data available.
Bold text indicates pathogens not in the overall top 10.
Notifiable diseases, Australia 1991–20113271
https://doi.org/10.1017/S0950268816001072
Downloaded from https:/www.cambridge.org/core. Kainan University, on 10 Feb 2017 at 06:18:55, subject to the Cambridge Core terms of use, available at https:/www.cambridge.org/core/terms.
⊘ This is a preview!⊘
Do you want full access?
Subscribe today to unlock all pages.
Trusted by 1+ million students worldwide
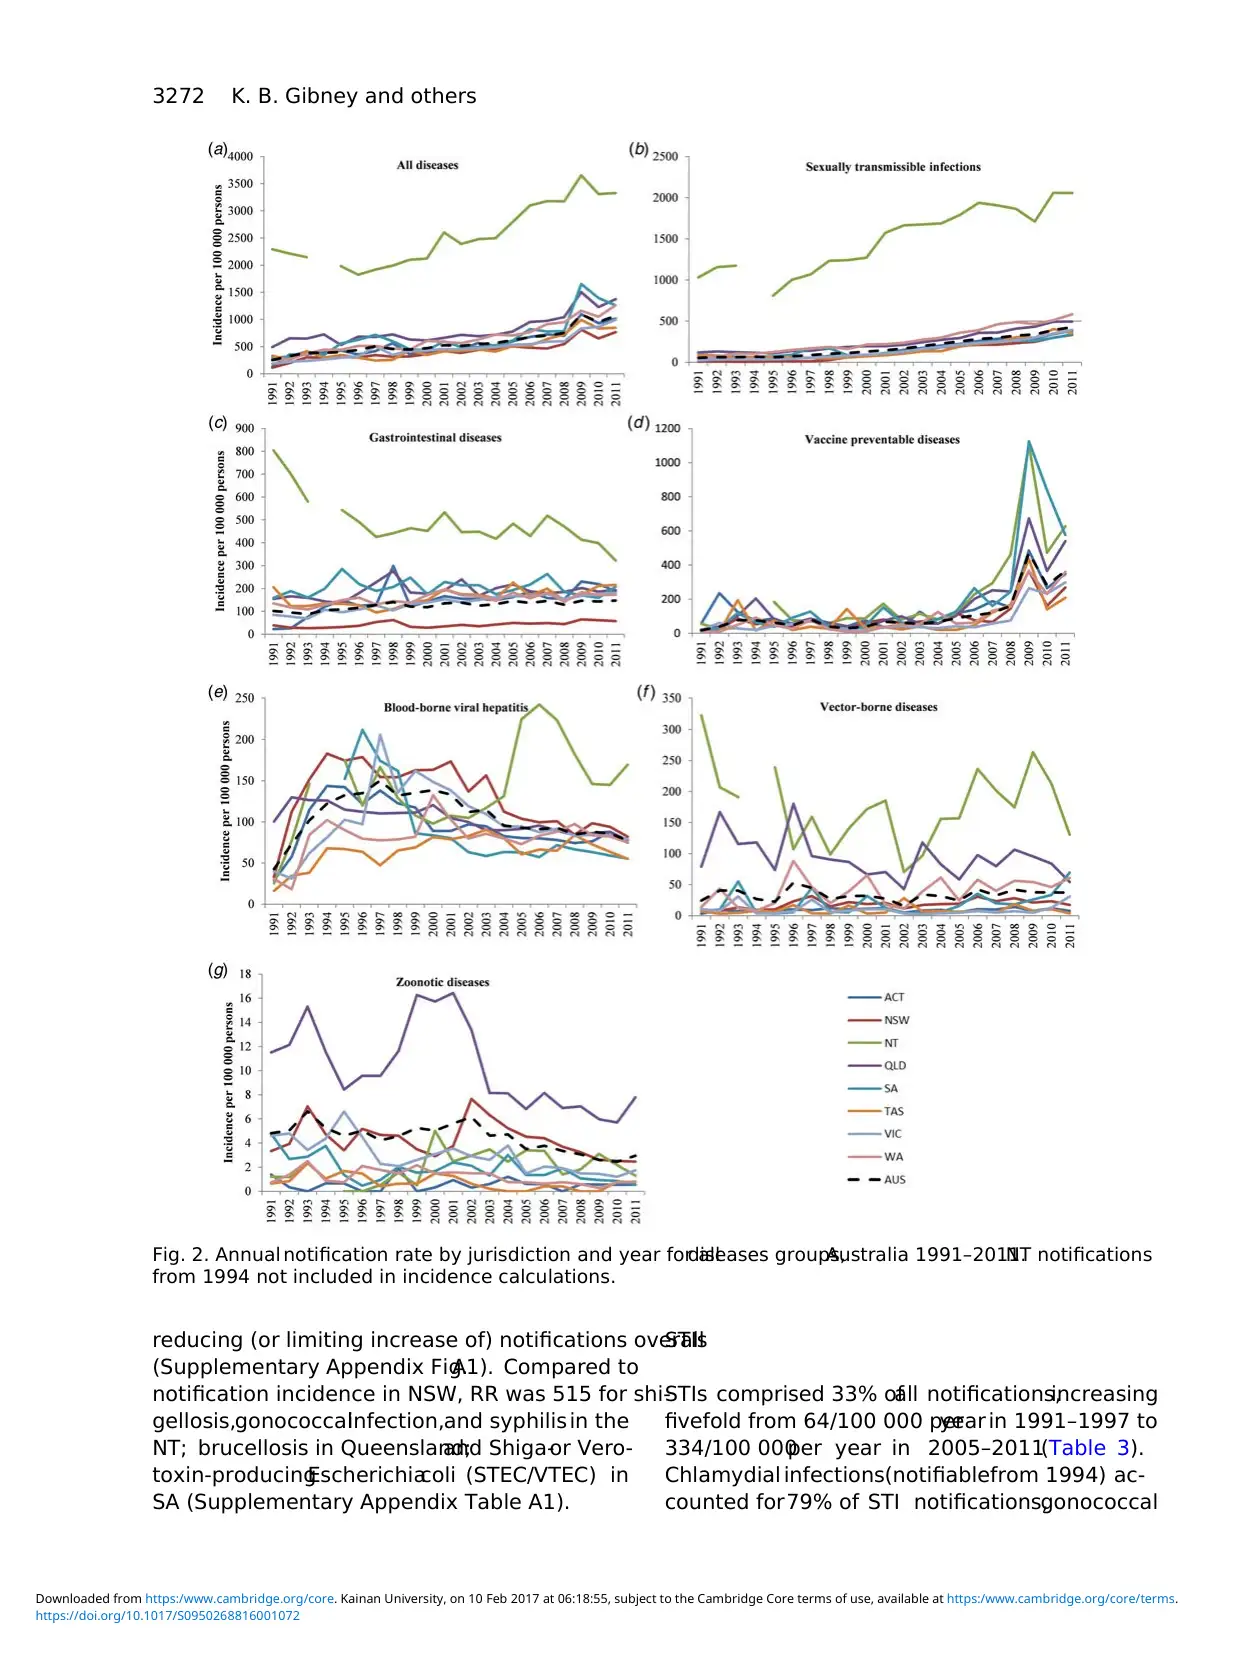
reducing (or limiting increase of) notifications overall
(Supplementary Appendix Fig.A1). Compared to
notification incidence in NSW, RR was 515 for shi-
gellosis,gonococcalinfection,and syphilis in the
NT; brucellosis in Queensland;and Shiga-or Vero-
toxin-producingEscherichiacoli (STEC/VTEC) in
SA (Supplementary Appendix Table A1).
STIs
STIs comprised 33% ofall notifications,increasing
fivefold from 64/100 000 peryear in 1991–1997 to
334/100 000per year in 2005–2011(Table 3).
Chlamydial infections(notifiablefrom 1994) ac-
counted for79% of STI notifications,gonococcal
Fig. 2. Annual notification rate by jurisdiction and year for alldiseases groups,Australia 1991–2011.NT notifications
from 1994 not included in incidence calculations.
3272 K. B. Gibney and others
https://doi.org/10.1017/S0950268816001072
Downloaded from https:/www.cambridge.org/core. Kainan University, on 10 Feb 2017 at 06:18:55, subject to the Cambridge Core terms of use, available at https:/www.cambridge.org/core/terms.
Paraphrase This Document
Need a fresh take? Get an instant paraphrase of this document with our AI Paraphraser
disease16% (32/100 000per year), and syphilis
5% (9/100 000 per year)(Fig. 1b).Annual incidence
of STIs was highestin those aged 20–29 years
(239/100 000)and was eightfold higherin the NT
than the national average(1527vs. 193/100 000)
(Fig. 2b).
Gastrointestinal diseases
Gastrointestinaldiseases comprised 21% ofnotifica-
tions, with campylobacteriosisaccounting for55%
despite notbeing notifiable in NSW (Fig.1c). The
national incidence of notified gastrointestinal diseases
increased by 2% peryear. Gastrointestinaldisease
notificationsin the NT were nearly fourtimesthe
national incidence(481 vs. 127/100 000per year,
Fig. 2c).NSW had the lowestnotification incidence
(Supplementary Appendix Fig. A1); however, nation-
al notification incidence of gastrointestinal diseases ex-
cluding campylobacteriosis (55/100 000 per year) was
similar to NSW (43/100 000 per year).
VPDs
Just underhalf a million VPD caseswere notified
(Table 2), of which 45% were pertussis, 28% influenza
(notifiablefrom 2001), and 12% varicella zoster
(notifiable from 2006)(Fig. 1d). VPD notifications
increased 15% peryear, from 3016 in 1991 to a
peak of 101 942 casesin 2009 during the H1N1
influenzapandemic.Median age at diseaseonset
increased from 14 yearsin 1991–1997 to 30 years
in 2005–2011.National incidence ofVPD notifica-
tions was 119/100 000 peryear,highestin the NT
(239/100 000)and lowest in Victoria (77/100 000)
(Fig. 2d).
BBVH
BBVH comprised 18% of notifications nationally and
30% of notifications in NSW (Supplementary Appen-
dix Fig. A1). Annual incidence ofnotified BBVH
cases was higher in the NT and NSW (144 and 128
notifications/100 000, respectively) than other jurisdic-
tions (64–101/100 000, Fig. 2e). Hepatitis C, notifiable
from 1995,accounted for 69% and hepatitis B 31%
(Fig. 1e). BBVH notification incidenceincreased
threefold from 43/100 000 per year persons in 1991
to 150/100 000 per year in 1997 before dropping to
77/100 000 peryear in 2011, reflecting changesin
hepatitis C notifications.
VBDs
There were 137 817 VBD notifications (5·7% of notifi-
cations),67% being RRV infections (notifiable from
1993), 16% Barmah Forest virus infections (notifiable
from 1995),10% malaria,and 6% dengue (Fig.1f).
VBD notification incidence was 34/100 000 per year
for Australia,highestin the NT (175/100 000)and
Queensland(92/100 000)and lowest in Tasmania
(9/100 000) (Fig. 2f).
Other bacterial diseases
There were 36 960 notifications of other bacterial dis-
eases,of which 60% were tuberculosis,24% invasive
meningococcaldisease,and 15% legionellosis.Other
bacterialdisease notification incidence was 9/100 000
per year,highestin the NT (27/100 000)and lowest
in Tasmania (5/100 000)(Fig. 2). Tuberculosis
notification incidencewas 6/100 000per year for
Australia (range 21/100 000 in the NT to 2/100 000
in Tasmania)and was stable over the study period
(Supplementary Appendix Fig. A1). Fifty-five percent
of notified caseswere male;highestfor Legionella
(67%) and leprosy (62%).
Zoonotic diseases
There were 17 696 zoonotic disease notifications (0·7%
of all notifications). Q fever was most common (61%),
followed by leptospirosis (20%) and ornithosis (14%).
Males predominated, especially for anthrax (100% of
four casesnotified),leptospirosis(90%),brucellosis
(84%), and Q fever (80%). Queenslandnotified
43% of all zoonotic cases,83% of brucellosisand
56% of leptospirosis cases.Zoonotic disease notifica-
tion incidence was4·4/100 000 peryear;highestin
Queensland (10·0/100 000)and lowestin the ACT
(0·6/100 000) (Fig.2h).Zoonotic disease notifications
fell by an average3% annually (Supplementary
Appendix Fig. A1).
DISCUSSION
Intelligenceobtained from nationalcommunicable
disease surveillance regarding infectious disease epi-
demiology guidesnationalpolicy development,re-
source allocation,diseasecontrolprogrammesand
quarantine activities, as well as allowing identification
of and coordinated responses to national or multijur-
isdictional outbreaks [3]. This paper provides the first
trend analysis ofall nationally notifiable diseases in
Notifiable diseases, Australia 1991–20113273
https://doi.org/10.1017/S0950268816001072
Downloaded from https:/www.cambridge.org/core. Kainan University, on 10 Feb 2017 at 06:18:55, subject to the Cambridge Core terms of use, available at https:/www.cambridge.org/core/terms.
Australia (except HIV/AIDS and CJD) since the in-
ception ofthe NNDSS in 1991. Both the number
and incidence of notifications increased steadily over
the 21 years,partly due to the addition ofdiseases
to the system. Incidence rates were highest in the NT
and in Indigenous and young Australians. The ten dis-
eases with highest notification incidence accounted for
nearly 90% ofnotifications and required a range of
public health strategiesfor diseaseprevention and
control;including safesex, contacttracing,harm-
reduction forpeople who injectdrugs,food safety,
and immunization [10–14].This highlights the com-
plex challengesfacing state,territory,and federal
health departments in preventing and controlling in-
fectious diseases in Australia.
Indigenous people comprised 8% of notified cases
but only 3% of the Australian population [15]. Signifi-
cant under-reportingof Indigenousstatusamong
notified casesmeanslikely underestimation ofthis
proportion. IndigenousAustralians have poorer
health outcomes:life expectancyis 9·7 and 11·5
years lower for Indigenous females and males, respect-
ively [16], and disease burden measured in years of life
lost was 2·6 times that of non-Indigenous Australians
for all causesand 3·8 timesfor infectionsin 2010
[17].Childhood vaccination coverageis lower for
Indigenous children [18],potentially explaining some
difference in VPD notification rates.In a previously
published study,the notification RR for Indigenous
compared to non-Indigenous Australians from 2000
to 2009 was24 for chlamydialinfection and 174
for gonococcalinfection [19],and higherpositivity
ratesfor Indigenouspatientstested forChlamydia
confirm greater STI burden rather than ascertainment
bias [20].
Higher notification rates in the NT reinforce previ-
ous findings that the health adjusted life expectancy
for the NT population was 5 years less than the
Australian average in 2003 (67·7 vs.72·9 years) [21].
The NT is the least populous Australian jurisdiction
(estimated residentpopulation 231 000 in 2011)[5].
The NT population is younger and has a high propor-
tion of Indigenous persons (30% in NT vs. 3% nation-
ally) than other jurisdictions [15, 22]; factors reflected
in NT notifications. However, age-standardized notifi-
cation rates were higher in the NT than elsewhere and
notification rates in Indigenous people were higher in
the NT than SA and WA. As NT data from 1994 were
excluded from both the numerator (number of cases
notified)and denominator (population)of incidence
calculations,this would not have substantially
impacted our RR calculations comparing notification
incidence between the NT and other jurisdictions. It is
likely that climactic and environmentaldiseases also
impact disease incidence in the NT,while variability
in health-seeking, diagnostic and notification practices
might further contributeto the interjurisdictional
differences.
Importantly, our results highlight some major pub-
lic health achievements.The marked reduction in
notification incidence forrubella,measlesand Hib
demonstratethe impact of Australia’s National
Immunization Programme.In 2014 Australia was
recognized by the WHO to have eliminated measles
[23].Similarly,the reduction in donovanosiscases
resultsfrom sustainedpublic health programmes
such as the National DonovanosisEradication
Project [24].
The annual number of notifications increased more
than fivefold over the 21-year study period.The rea-
sons for this are multifactorial,including addition of
notifiable diseases to national and jurisdictional notifi-
cation lists, population growth, introduction of screen-
ing programmes (e.g.for chlamydialinfection),and
improved diagnostics as well as true changes in disease
incidence. There were 37 nationally notifiable diseases
in 1991 and 65 in 2011.The number ofnationally
notifiable diseases has also increased internationally;
from 56 to 87 (1992–2011) in the United States and
from 41 to 58 (1991–2011)in Canada [25,26].The
numberof nationally notifiable diseasesvaried be-
tween European countries,ranging from 26 in
France to 82 in Hungary in 2005 [27].Some differ-
ences are due to increased number of disease categor-
ies associated with a single pathogen (e.g. syphilis has
eightcategoriesin the US system and three in the
Australian NNDSS), but also reflect inclusion of dis-
eases that are endemic in selected countries (particu-
larly VBDs).
While many diseases are common between national
surveillancesystems,somedifferencesare seen.In
Australia,10 diseases accounted for 88% of NNDSS
notifications.National surveillancesystemsin the
United States and Canada as wellas the European
Surveillance System (TESSy) receive notifications for
eightof these diseases;varicella is notnotifiable in
to the Canadian orEuropean surveillance systems
and RRV is not notifiable to any [25–28]. In New Zea-
land, chlamydialinfection,influenza,varicella and
RRV are not nationally notifiable [29].Conversely,
some common infectious diseases are notnotifiable
in Australia and theirinclusion on the Australian
3274 K. B. Gibney and others
https://doi.org/10.1017/S0950268816001072
Downloaded from https:/www.cambridge.org/core. Kainan University, on 10 Feb 2017 at 06:18:55, subject to the Cambridge Core terms of use, available at https:/www.cambridge.org/core/terms.
⊘ This is a preview!⊘
Do you want full access?
Subscribe today to unlock all pages.
Trusted by 1+ million students worldwide
1 out of 15
Related Documents


Your All-in-One AI-Powered Toolkit for Academic Success.
+13062052269
info@desklib.com
Available 24*7 on WhatsApp / Email
![[object Object]](/_next/static/media/star-bottom.7253800d.svg)
Unlock your academic potential
Copyright © 2020–2026 A2Z Services. All Rights Reserved. Developed and managed by ZUCOL.