Numeracy and Data Analysis Report: Humidity Data of Nottingham, UK
VerifiedAdded on 2023/01/16
|8
|1398
|79
Report
AI Summary
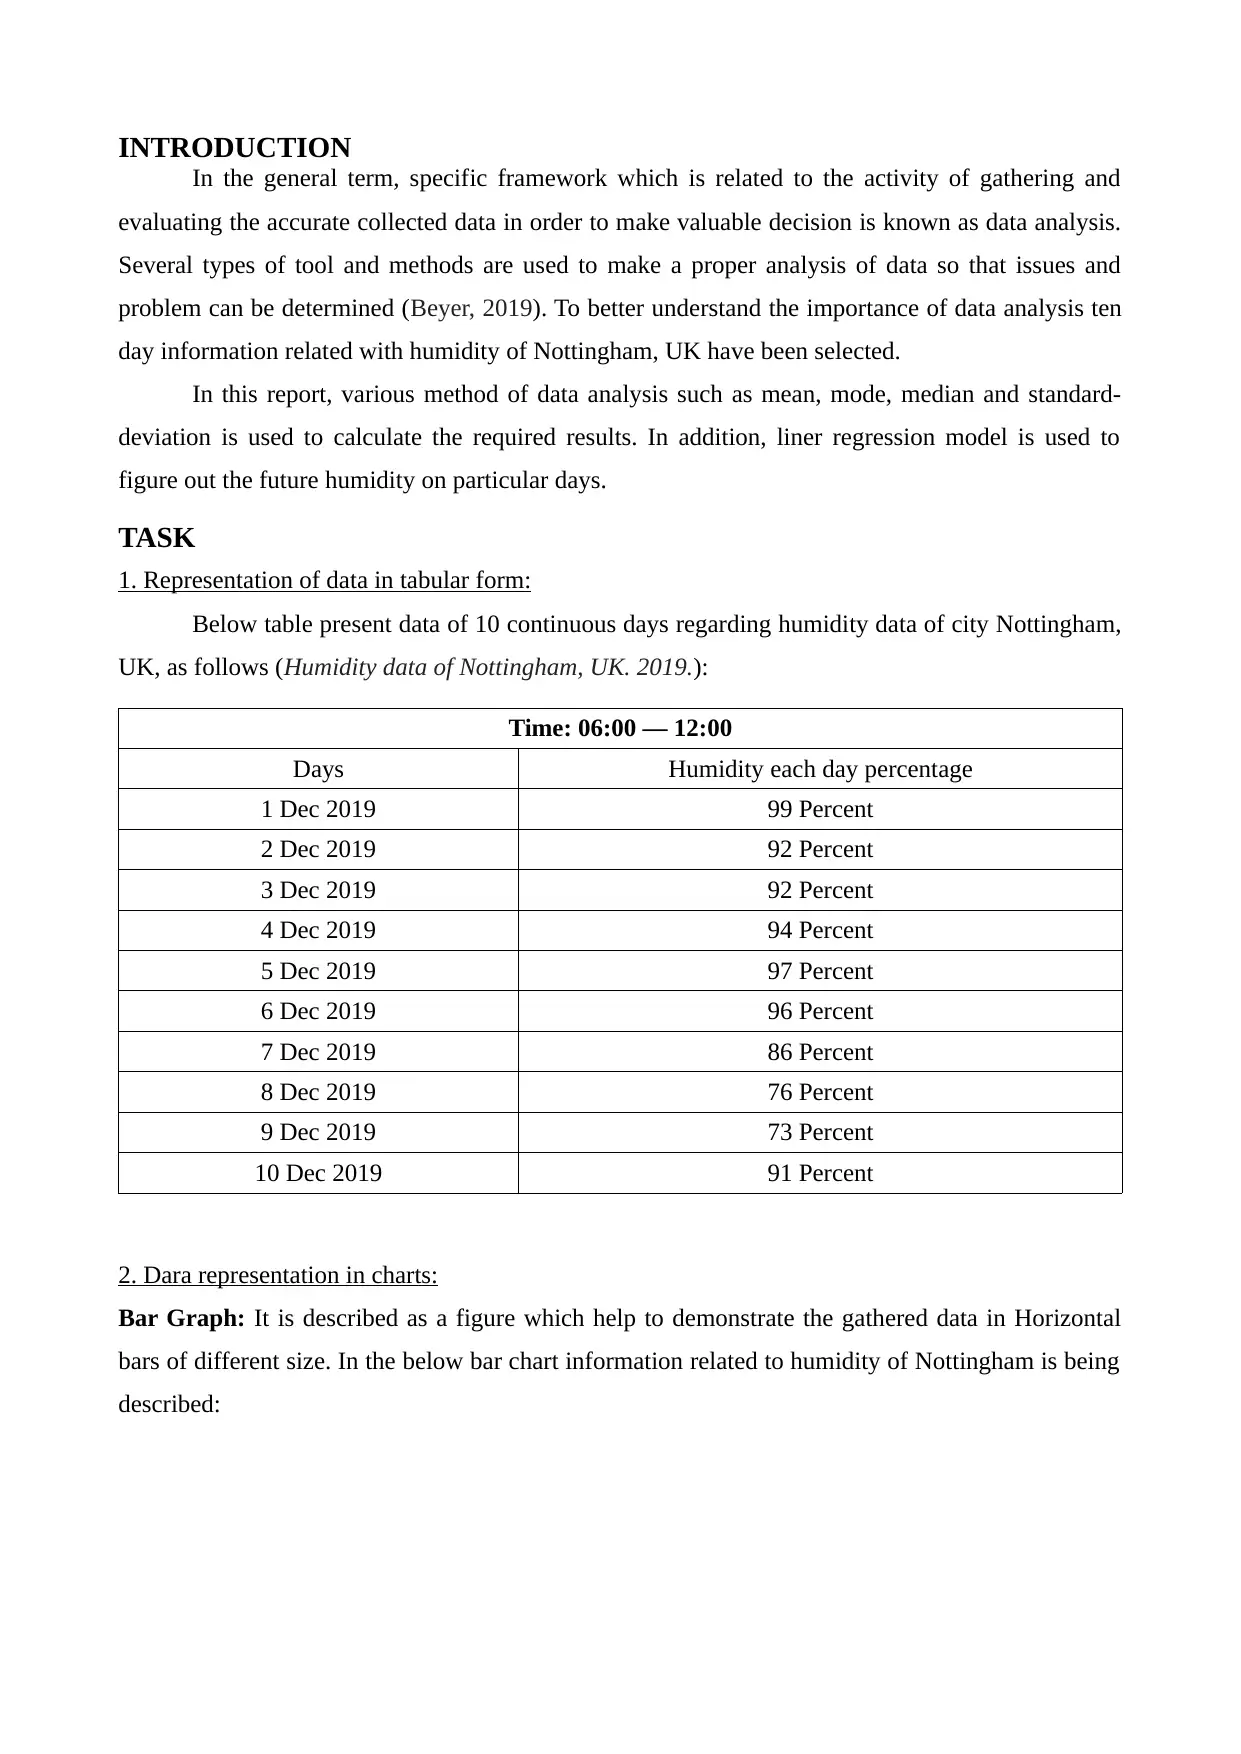
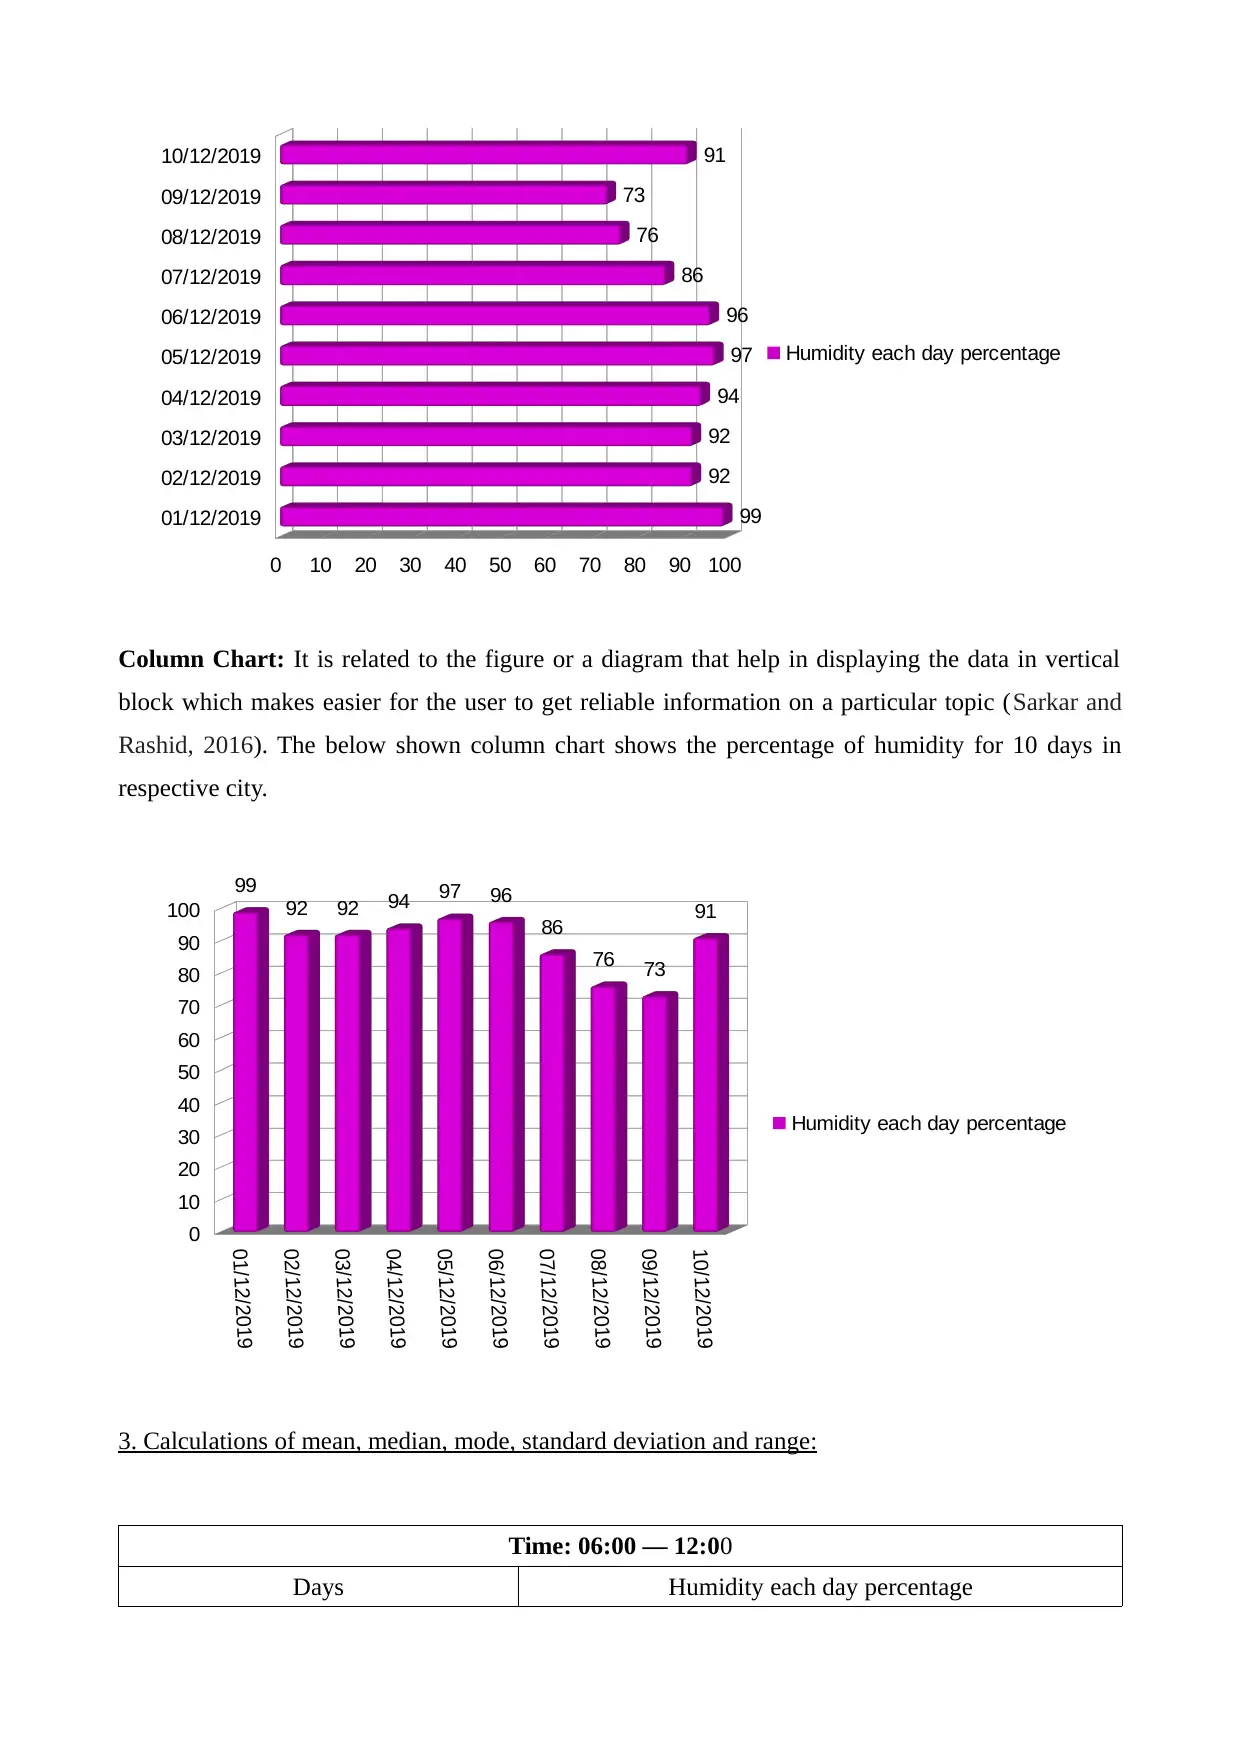
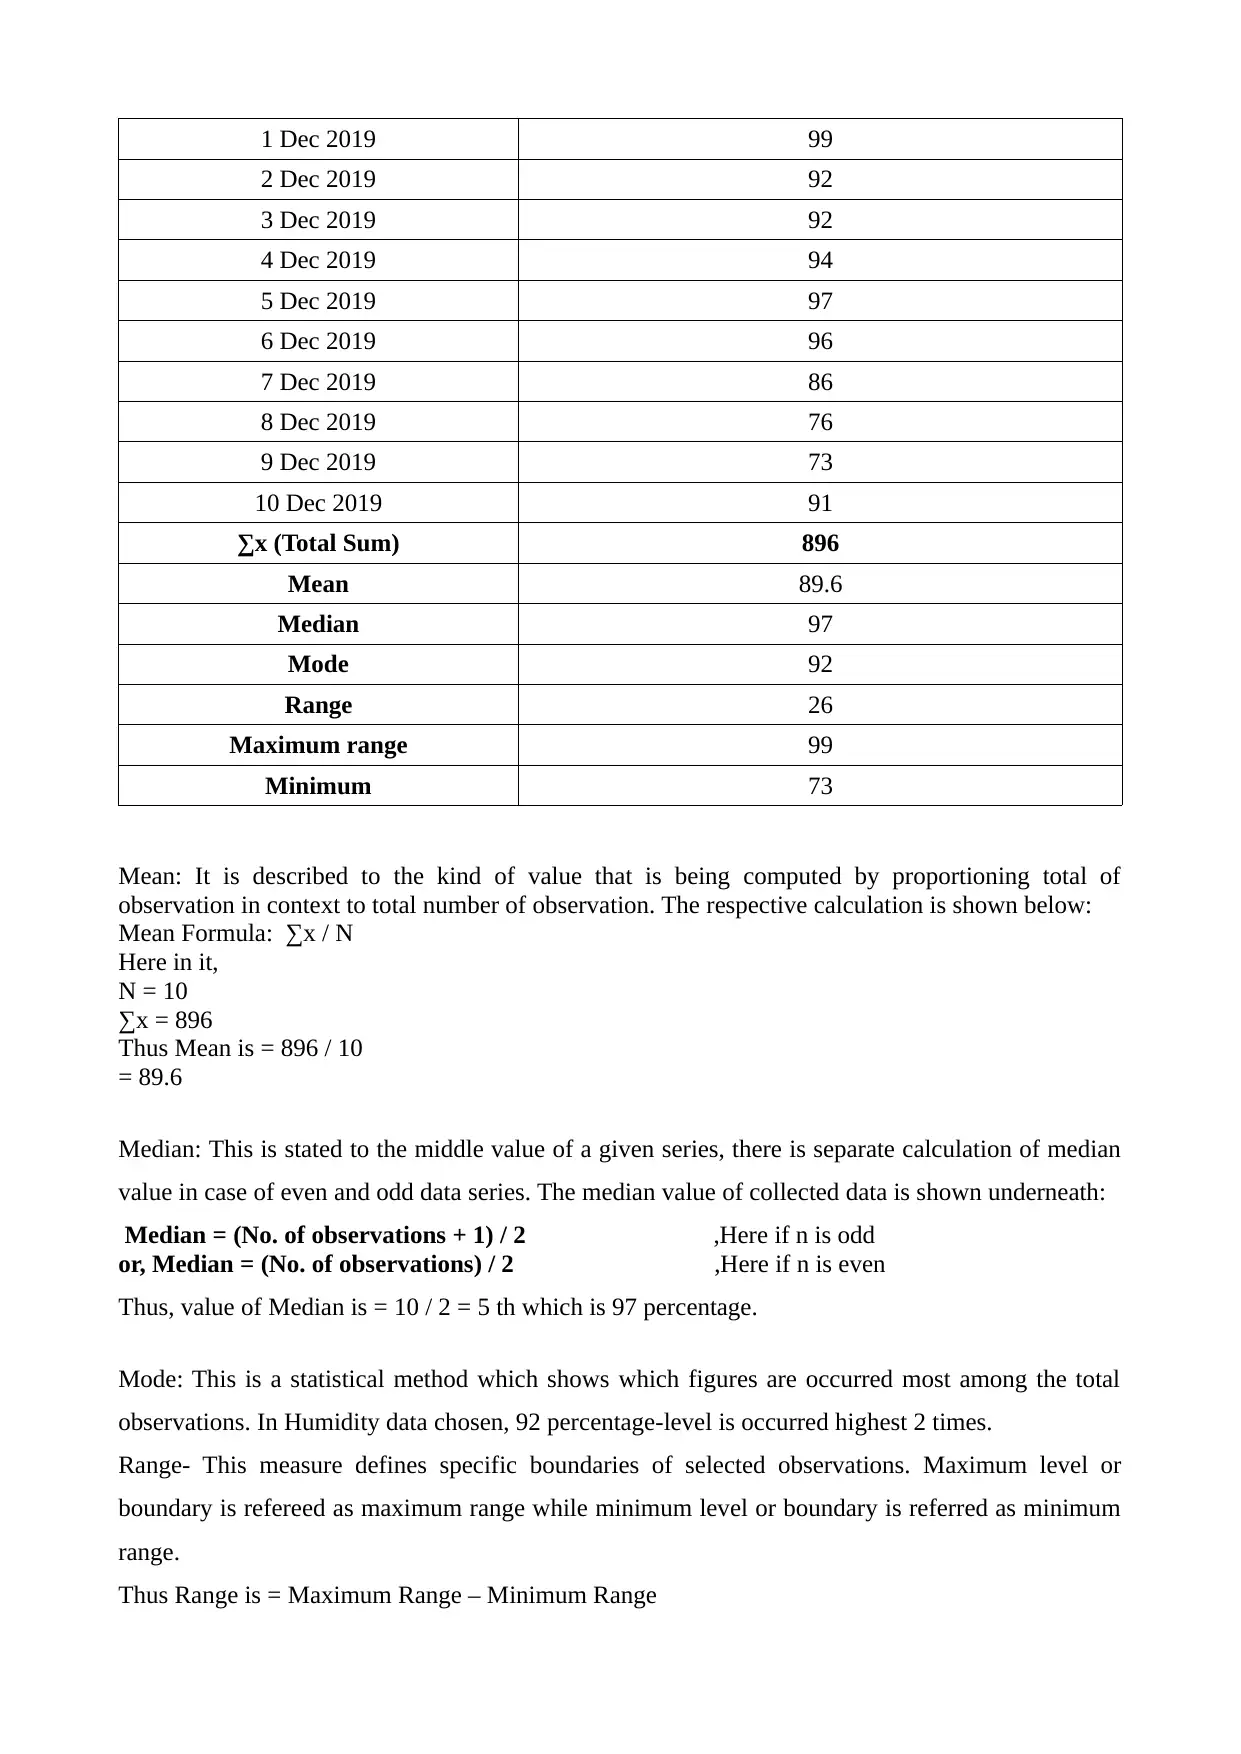
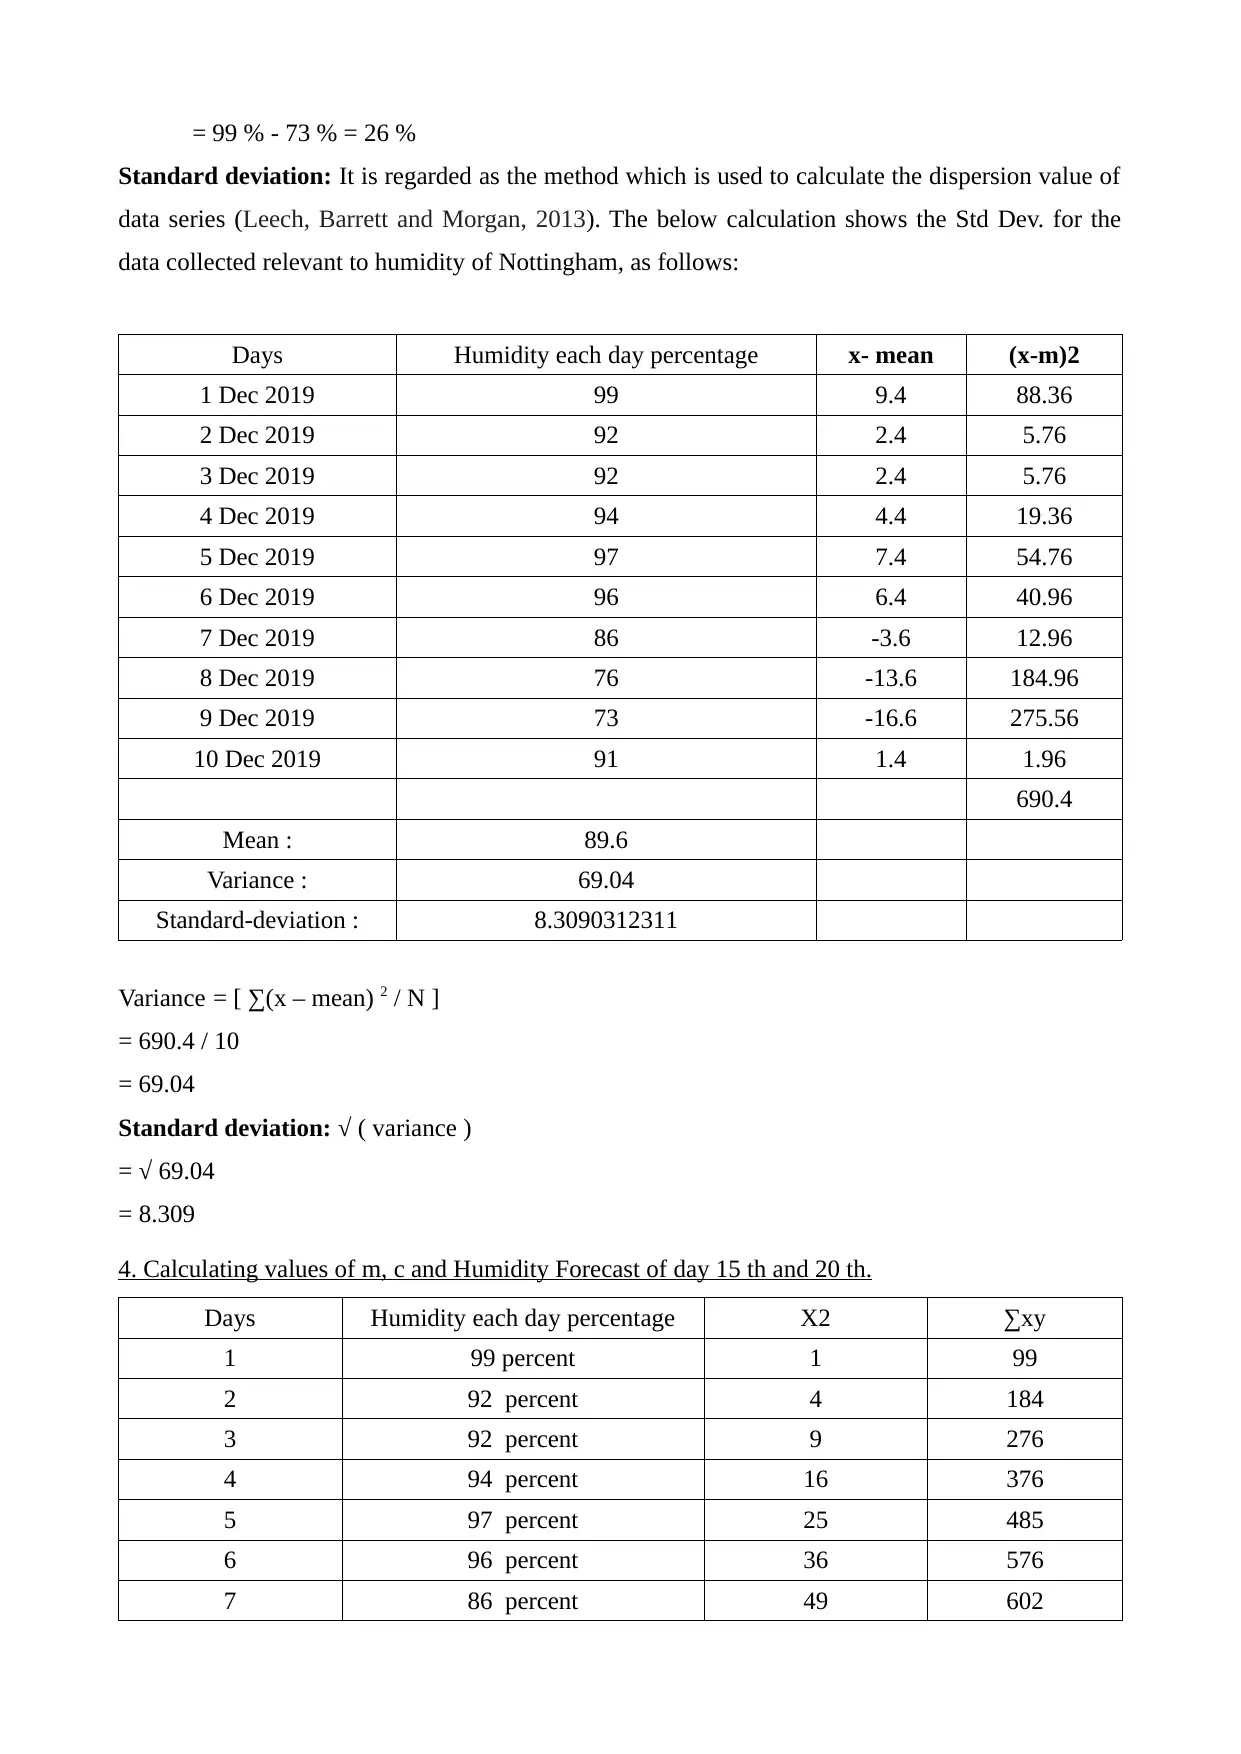
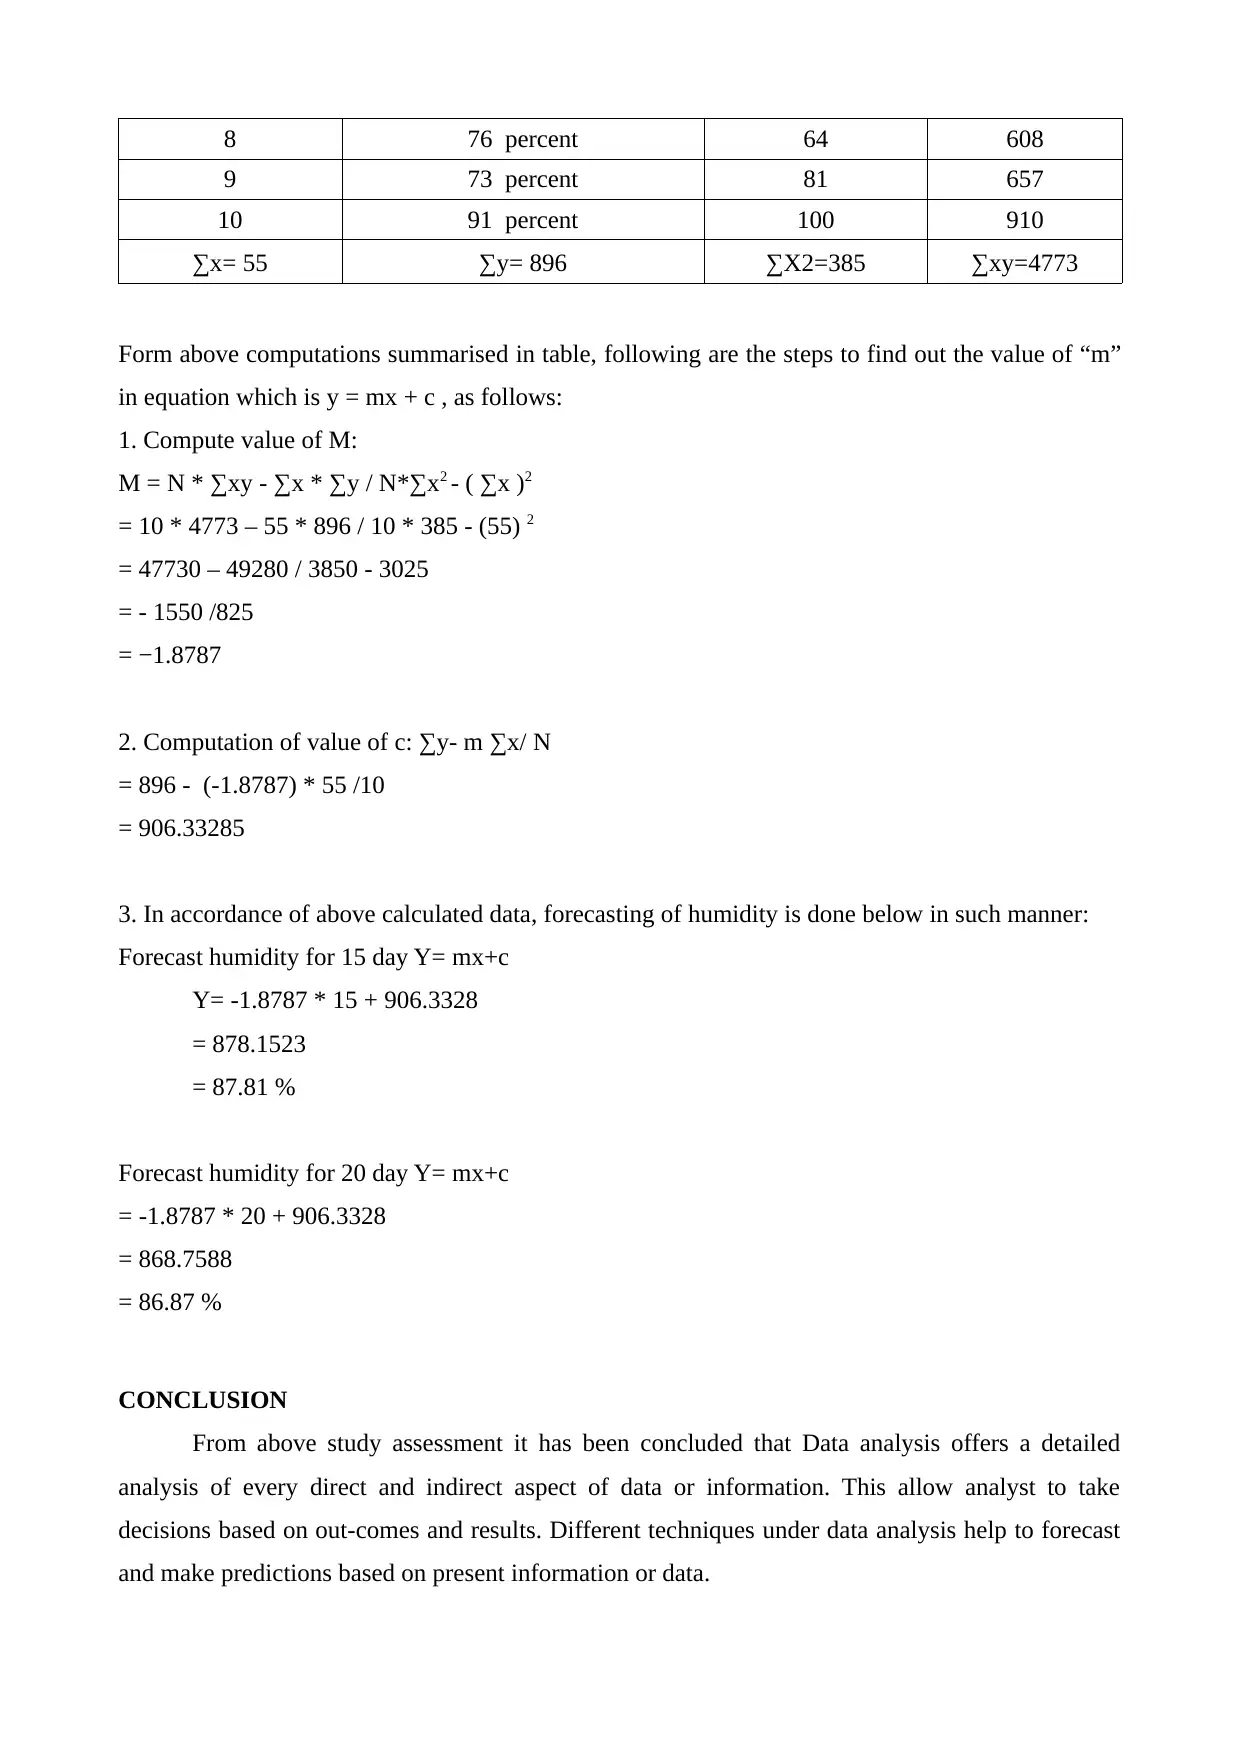
This report presents a data analysis of humidity data collected over ten days in Nottingham, UK. The analysis begins with the representation of data in tabular form, followed by visual representations using bar and column charts. The report then proceeds to calculate key statistical measures including mean, median, mode, range, and standard deviation. Furthermore, the report applies a linear regression model to forecast humidity levels for the 15th and 20th days, providing detailed calculations of the 'm' and 'c' values in the linear equation. The findings demonstrate the application of various data analysis techniques to interpret and predict environmental data, concluding with a summary of the results and references to the sources used.
1 out of 8
Related Documents


Your All-in-One AI-Powered Toolkit for Academic Success.
+13062052269
info@desklib.com
Available 24*7 on WhatsApp / Email
![[object Object]](/_next/static/media/star-bottom.7253800d.svg)
Copyright © 2020–2026 A2Z Services. All Rights Reserved. Developed and managed by ZUCOL.