Deakin University MIS784 Marketing Analytics: NPS vs CSAT Report
VerifiedAdded on 2022/09/09
|12
|2538
|21
Report
AI Summary
This report, prepared for a Marketing Analytics course at Deakin University, evaluates the effectiveness of Net Promoter Score (NPS) and Customer Satisfaction Metric (CSAT) in assessing customer satisfaction and loyalty within the Australian banking sector. The study analyzes primary data collected through a survey of 208 bank customers, examining their preferences, satisfaction levels, and likelihood to recommend their banks. The report compares the two metrics, highlighting the strengths and weaknesses of each. It finds that while NPS effectively identifies promoters and detractors, CSAT provides more specific insights into factors influencing satisfaction. The report recommends that National Australia Bank (NAB) retain its CSAT system to improve customer satisfaction and loyalty. The analysis includes data visualization and a discussion of existing research on customer loyalty measurement.

Running head: MARKETING ANALYTICS
Marketing Analytics
Name of the Student:
Name of the University:
Author note:
Marketing Analytics
Name of the Student:
Name of the University:
Author note:
Paraphrase This Document
Need a fresh take? Get an instant paraphrase of this document with our AI Paraphraser

1MARKETING ANALYTICS
1. Introduction
The report aims to provide a comparative discussion on the effectiveness of Net Promoter
Score (NPS) and Customer Satisfaction Metric (CSAT) used in the major Australian banks for
quite some time now. Both NPS and Customer Satisfaction Metric are two important tools for
measuring the customer satisfaction level and are precise predictors of loyalty of the customers
and the lifetime value at a particular point in time (Eklof, Podkorytova and Malova 2018). These
scores are used for predicting change and current profitability of an organization, however, the
major difference between these two tools is the that the CSAT measures the short term loyalty,
while NPS measures the long term customer satisfaction and loyalty. Thus, for evaluating the
long term customer satisfaction level derived from personal banking experience, the Australian
banks are replacing their CSAT measurement system by NPS. This report will provide an
overview of customer responses on their experience from their banks and their loyalty level and
will reflect on the relative effectiveness of the two systems to help the CMO of National
Australia Bank (NAB), Jane Porter, to choose either NPS or existing CSAT system.
2. Existing knowledge, research, and/or views
Measuring customer satisfaction level and loyalty in extremely essential to understand
the position of an organization in the market and with this information the organization can take
measures to improve its brand value and image. Business success depends on its customer base
and it is important for a business to deliver highest level of customer satisfaction as a long term
goal, which turns into customer loyalty. Customer Satisfaction Metric (CSAT) and Net Promoter
Score (NPS) are two useful measures that help organizations to understand the customers’
perception about their services and their competitive position in the market. Both these measures

2MARKETING ANALYTICS
have advantages and disadvantages, and their effectiveness are compared to choose the best
metric.
Reichheld (2003) conducted a study to determine the most accurate and reliable metric to
measure customer satisfaction and loyalty and he classified the customers into three groups
based on the score in between 0 and 10 they give on asking how likely they would recommend
the company to friends and colleagues. The customers that give a rating of 9-10 that is highly
likely to recommend are categorized as Promoters, those who give rating of 7-8, are Passively
Satisfied and those who give rating below 7, that is, 0 – 6, are called Detractors and they are
highly unlikely to recommend. The NPS is obtained by subtracting the detractor percentage from
the promoter percentage. Reichheld mentioned that companies with a very high customer loyalty
generally achieve the NPS scores from 75% to more than 80%. Thus, using this metric, the
companies can identify the pool of promoters and detractors and can put focus on these groups to
increase the promoters and reduce the detractors by changing their quality of service.
On the contrary, Keiningham et al. (2008) mentioned that no single metric must be
considered as the best and most accurate one, however, depending on the business goals and
nature of the business, the most relevant metric is applied. Linking the customer loyalty to
business growth is possible when the companies measure their satisfaction level in the most
accurate manner. The authors found that the organizations guided by NPS might develop
unrealistic views about the performance of the business, the shareholder wealth and value and
that could lead them to misallocate resources. On the other hand, NPS is easy for communication
and simple for implementation, however, the authors argued that it can bring out some of the
customer intentions, which can be reliable for some business aspect, but that cannot indicate the
validity of loyalty and satisfaction for all business aspects.
⊘ This is a preview!⊘
Do you want full access?
Subscribe today to unlock all pages.
Trusted by 1+ million students worldwide

3MARKETING ANALYTICS
Shaw (2008) emphasized on the effectiveness of NPS among all other channels of
marketing. Efficient marketing requires accurate segmentation of the customer group and
targeting them with the goods and services that precisely meet their demands. According to the
author, NPS is useful for identifying the percentage of the net promoters and segmenting those
promoters as per their specific demands. The author considered the importance of word-of-
mouth (WOM) marketing in influencing some net promoters, not all and hence, also concluded
that net promoters are not the ultimate measures for business growth. On the other hand,
Keiningham et al. (2007) found from longitudinal study on the impact of net promoter and
growth of a firm’s revenue that NPS is effective only to identify the net promoters and
distractors, but the CSAT metric is useful to identify the areas of potential growth as well. NPS
score indicates the loyalty level for the company, however, CSAT often provides specific
outcome that is helpful for the companies.
Stewart and Worthington (2015) highlighted that the NPS score should not be entirely
trusted by the CMOs of the companies due to the simplified assumptions it takes.
Misclassification of customers is its biggest weakness. For example, the classification of the
customers into only three groups of promoter, passive and detractor is quite simplified, whereas
these should be more groups, as many customers may have mixed opinion about their
recommendation for the company. NPS also cannot reflect the growth of the company and the
proper value the company delivering to the customers. They also pointed out the structural
weaknesses of NPS. Firstly, the positive value of a promoter is offset by the negative value of a
detractor, and secondly, the passives have no value, whereas their opinion should also be
counted. Moreover, there are many factors that affect the customer satisfaction and loyalty,
which is not addressed by NPS (Stewart and Worthington 2015).
Paraphrase This Document
Need a fresh take? Get an instant paraphrase of this document with our AI Paraphraser

4MARKETING ANALYTICS
3. Methodology
To evaluate the efficiency of the above mentioned metrics, primary data has been
collected through a survey process. 208 customers of the Australian banks were chosen
randomly, using simple random sampling technique, and were asked 4 close ended questions that
revealed their choices for personal banking, their satisfaction level with their main bank’s
personal banking services, their preference ranking for recommending their bank to friends and
colleagues and their potential choice for main bank for attaining personal banking services. The
responses are presented in a MS Excel file and Pivot table and charts have been used to create
visual presentation of the data for all the four categories (Provided in the Appendix). A
comparison of their current main banks and their choice for another bank has been illustrated in a
chart. Descriptive method has been used to analyze and interpret the data.
4. Interpretation
The survey responses have been presented in the charts in a most comprehensive manner
provided in Appendix. Figure 1 shows that among the 208 customers, majority, that is, 65 use the
personal banking services of CBA, 40 use ANZ, 36 use APAC, 35 use the 2nd Tier banks and the
lowest number of customers, that is, 32 are the customers of NAB personal banking. This shows
that in a random sample, lowest number of customers use NAB, which is a concern for the bank
and they should improve their personal banking services.
The ratings on customer satisfaction and their chances of recommending their current
banks are collected using a rating scale of 0-10; 0 signifying extremely dissatisfied and 10
signifying extremely satisfied. Figure 2 and 3 depict the rating of customer satisfaction achieved
from personal banking services from their existing banks. In figure 2, the total number of
3. Methodology
To evaluate the efficiency of the above mentioned metrics, primary data has been
collected through a survey process. 208 customers of the Australian banks were chosen
randomly, using simple random sampling technique, and were asked 4 close ended questions that
revealed their choices for personal banking, their satisfaction level with their main bank’s
personal banking services, their preference ranking for recommending their bank to friends and
colleagues and their potential choice for main bank for attaining personal banking services. The
responses are presented in a MS Excel file and Pivot table and charts have been used to create
visual presentation of the data for all the four categories (Provided in the Appendix). A
comparison of their current main banks and their choice for another bank has been illustrated in a
chart. Descriptive method has been used to analyze and interpret the data.
4. Interpretation
The survey responses have been presented in the charts in a most comprehensive manner
provided in Appendix. Figure 1 shows that among the 208 customers, majority, that is, 65 use the
personal banking services of CBA, 40 use ANZ, 36 use APAC, 35 use the 2nd Tier banks and the
lowest number of customers, that is, 32 are the customers of NAB personal banking. This shows
that in a random sample, lowest number of customers use NAB, which is a concern for the bank
and they should improve their personal banking services.
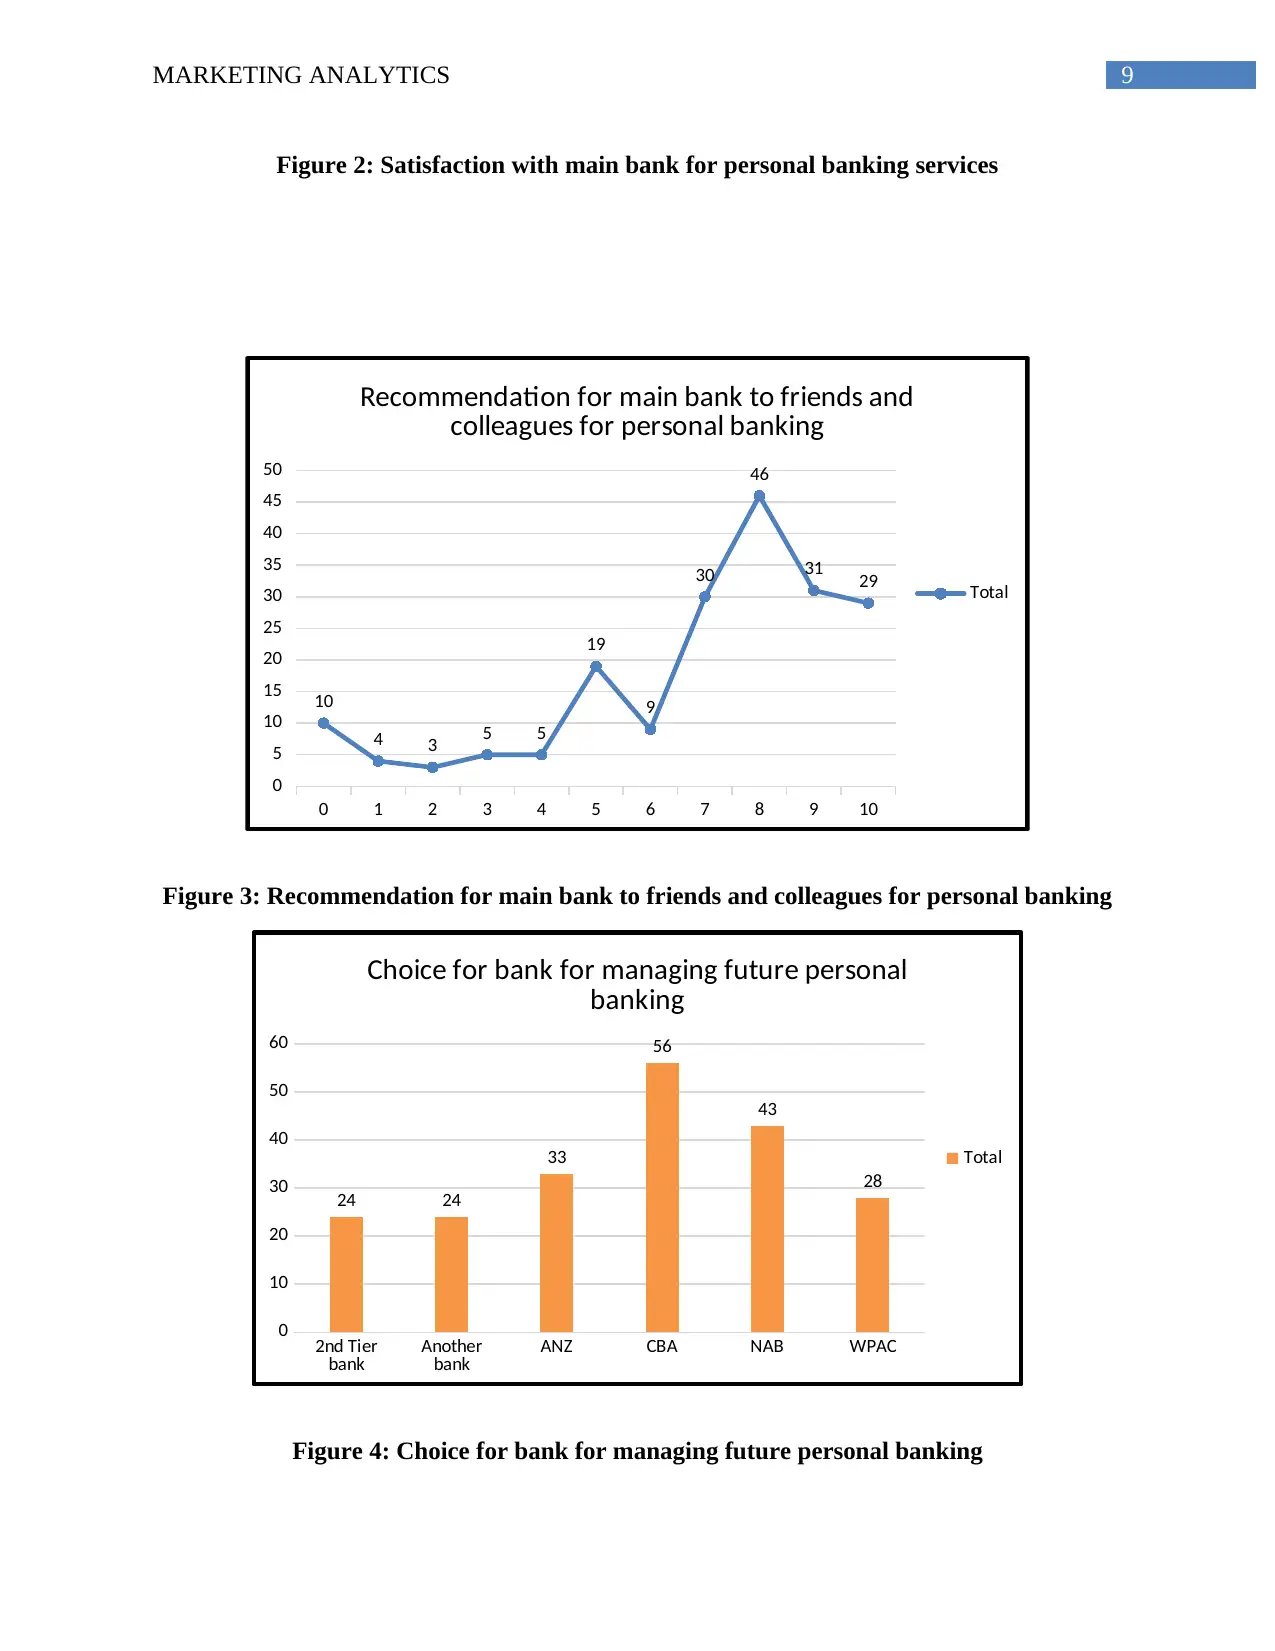
The ratings on customer satisfaction and their chances of recommending their current
banks are collected using a rating scale of 0-10; 0 signifying extremely dissatisfied and 10
signifying extremely satisfied. Figure 2 and 3 depict the rating of customer satisfaction achieved
from personal banking services from their existing banks. In figure 2, the total number of

5MARKETING ANALYTICS
customers for each of the rating has been presented in a Line chart. It shows that 65 people rated
8 for their satisfaction level from the current banks’ personal banking services, and 45 rated 10
for their satisfaction level. 35 people rated their satisfaction level as 9 and 25 rated 7. Thus,
according to the NPS, the majority of the customers, 90 people (=65+25) are considered as
passive and 80 (=45+35) are considered as the net promoter. Rest of customers who rated 6 and
below, that is, 36 people are considered as detractors.
Regarding the preference for recommending the bank to friends and colleagues, it is
found that 46 people rated 8, 31 people rated 9, 30 people rated 7 and 29 people rated 10. Hence,
in this case, 60 (= 31+29) people are treated as net promoters, majority, that is, 76 (=46+30)
people are treated as passive and the rest, 72 are considered as detractors (Figure 3).
Figure 4 represents the number of customers voted for their preferred banks for personal
banking services and it is found that maximum number of customers voted for CBA (56),
followed by 43 voted for NAB, 33 voted for ANZ. It can be said that some customers are not
satisfied with their current bank’s services and they would like to go for other banks. A
comparison chart (Figure 5) for the current bank and future preferences has been prepared that
shows that preferences for the banking services of CBA, ANZ, WPC, 2nd Tier bank and another
bank have fallen, while that for NAB has increased.
Thus, it can be said that people using the personal banking services of CBA, ANZ,
WPAC, and 2nd Tier bank are not very satisfied and some of them want to choose NAB for
personal banking in the future. On the other hand, as per the ratings, maximum number of
respondents are being considered as passively satisfied, whose opinions are not counted in the
NPS structure. Thus, these large group of customers can be influenced by the service quality of
⊘ This is a preview!⊘
Do you want full access?
Subscribe today to unlock all pages.
Trusted by 1+ million students worldwide

6MARKETING ANALYTICS
their banks and if they are not satisfied, they can move to any other rival bank. This would be a
loss for the bank and they would not be able to identify the scopes of improvement under this
NPS system.
5. Recommendation
From the above analysis, it can be found that NPS is suitable for identifying the total
number or percentage of the promoters and detractors, while that cannot define the precise
factors that can influence the satisfaction level and loyalty of the customers availing personal
banking services from the major banks of Australia. On the other hand, the CSAT metric would
help the bank to identify the scopes of improvement and they can work accordingly to improve
customers’ satisfaction level and loyalty, as this system also considers the satisfaction level of
the passively satisfied customer group, and have a sustainable profit in the long term. Hence, it
can be recommended that NAB should keep their CSAT metric system rather than adopting only
the NPS system.
Paraphrase This Document
Need a fresh take? Get an instant paraphrase of this document with our AI Paraphraser
7MARKETING ANALYTICS
6. Appendix
Responses to questionnaire on personal banking
The Data worksheet contains responses to a questionnaire on personal banking.
Four questions were asked:
Q1. Which would you consider to be your main bank for personal banking services?
Response categories: ANZ, CBA, NAB, WPAC, 2nd Tier bank
Q2. Thinking of your overall personal banking experience, how satisfied are you with your
main bank for personal banking services?
Scale: 0 (Completely dissatisfied) -10 (Completely satisfied)
Q3. How likely would you be to recommend your main bank to friends and colleagues for
personal banking?
Scale: 0 (Extremely unlikely to recommend) -10 (Extremely likely to recommend)
Some respondents did not answer this question. A blank cell in the worksheet represents missing
data.
Q4. If you were to choose one bank today to manage your personal banking, which one
would you choose?
Response categories: ANZ, CBA, NAB, WPAC, 2nd Tier bank, Another bank

8MARKETING ANALYTICS
(Respondents were told to assume that any contractual obligations or other barriers to switching
from your current bank are not applicable.)
The response "Another bank" means that they would choose a different main bank from
their current one, but would not, or could not, state which other bank they would choose.
2nd Tier bank ANZ CBA NAB WPAC
0
10
20
30
40
50
60
70
35
40
65
32
36
Main bank for personal banking services
Total
Figure 1: Main bank for personal banking services
0 1 2 3 4 5 6 7 8 9 10
0
10
20
30
40
50
60
70
4 7
2 5
1
12 10
25
65
32
45
Satisfaction with main bank for personal
banking services
Total
⊘ This is a preview!⊘
Do you want full access?
Subscribe today to unlock all pages.
Trusted by 1+ million students worldwide
9MARKETING ANALYTICS
Figure 2: Satisfaction with main bank for personal banking services
0 1 2 3 4 5 6 7 8 9 10
0
5
10
15
20
25
30
35
40
45
50
10
4 3 5 5
19
9
30
46
31 29
Recommendation for main bank to friends and
colleagues for personal banking
Total
Figure 3: Recommendation for main bank to friends and colleagues for personal banking
2nd Tier
bank Another
bank ANZ CBA NAB WPAC
0
10
20
30
40
50
60
24 24
33
56
43
28
Choice for bank for managing future personal
banking
Total
Figure 4: Choice for bank for managing future personal banking
Paraphrase This Document
Need a fresh take? Get an instant paraphrase of this document with our AI Paraphraser

10MARKETING ANALYTICS
2nd Tier
bank Another
bank ANZ CBA NAB WPAC
35
40
65
32
36
24 24
33
56
43
28
Comparison of main bank and preferences
Main bank for personal
banking services
If you were to choose
one bank today to
manage your personal
banking, which one
would you choose?
Figure 5: Comparison of main bank and preferences for personal banking

11MARKETING ANALYTICS
References
Eklof, J., Podkorytova, O. and Malova, A., 2018. Linking customer satisfaction with financial
performance: an empirical study of Scandinavian banks. Total Quality Management & Business
Excellence, pp.1-19.
Keiningham, T.L., Aksoy, L., Cooil, B. and Andreassen, T.W., 2008. Linking customer loyalty
to growth. mIt Sloan management review, 49(4), p.51.
Keiningham, T.L., Cooil, B., Andreassen, T.W. and Aksoy, L., 2007. A longitudinal examination
of net promoter and firm revenue growth. Journal of Marketing, 71(3), pp.39-51.
Reichheld, F.F., 2003. The one number you need to grow. Harvard business review, 81(12),
pp.46-55.
Shaw, R., 2008. Net promoter. Journal of Database Marketing & Customer Strategy
Management, 15(3), pp.138-140.
Stewart, D. and Worthington, S., 2015. An open letter to CMOS: why you shouldn’t trust net
promoter scores | Marketing Magazine. [online] Marketing Magazine. Available at:
https://www.marketingmag.com.au/hubs-c/open-letter-cmos-shouldnt-trust-net-promoter-scores/
[Accessed 16 Dec. 2019].
Stewart, D. and Worthington, S., 2015. The problems with net promoter scores: how to better
measure customer advocacy | Marketing magazine. [online] Marketing Magazine. Available at:
https://www.marketingmag.com.au/hubs-c/problems-net-promoter-scores-better-measure-
customer-advocacy/ [Accessed 16 Dec. 2019].
⊘ This is a preview!⊘
Do you want full access?
Subscribe today to unlock all pages.
Trusted by 1+ million students worldwide
1 out of 12
Related Documents


Your All-in-One AI-Powered Toolkit for Academic Success.
+13062052269
info@desklib.com
Available 24*7 on WhatsApp / Email
![[object Object]](/_next/static/media/star-bottom.7253800d.svg)
Unlock your academic potential
Copyright © 2020–2026 A2Z Services. All Rights Reserved. Developed and managed by ZUCOL.