Capital Budgeting Report: Evaluating NPV, IRR, and Analysis Methods

Verified

Added on  2020/03/28

|13
|2466
|1476
Report
AI Summary
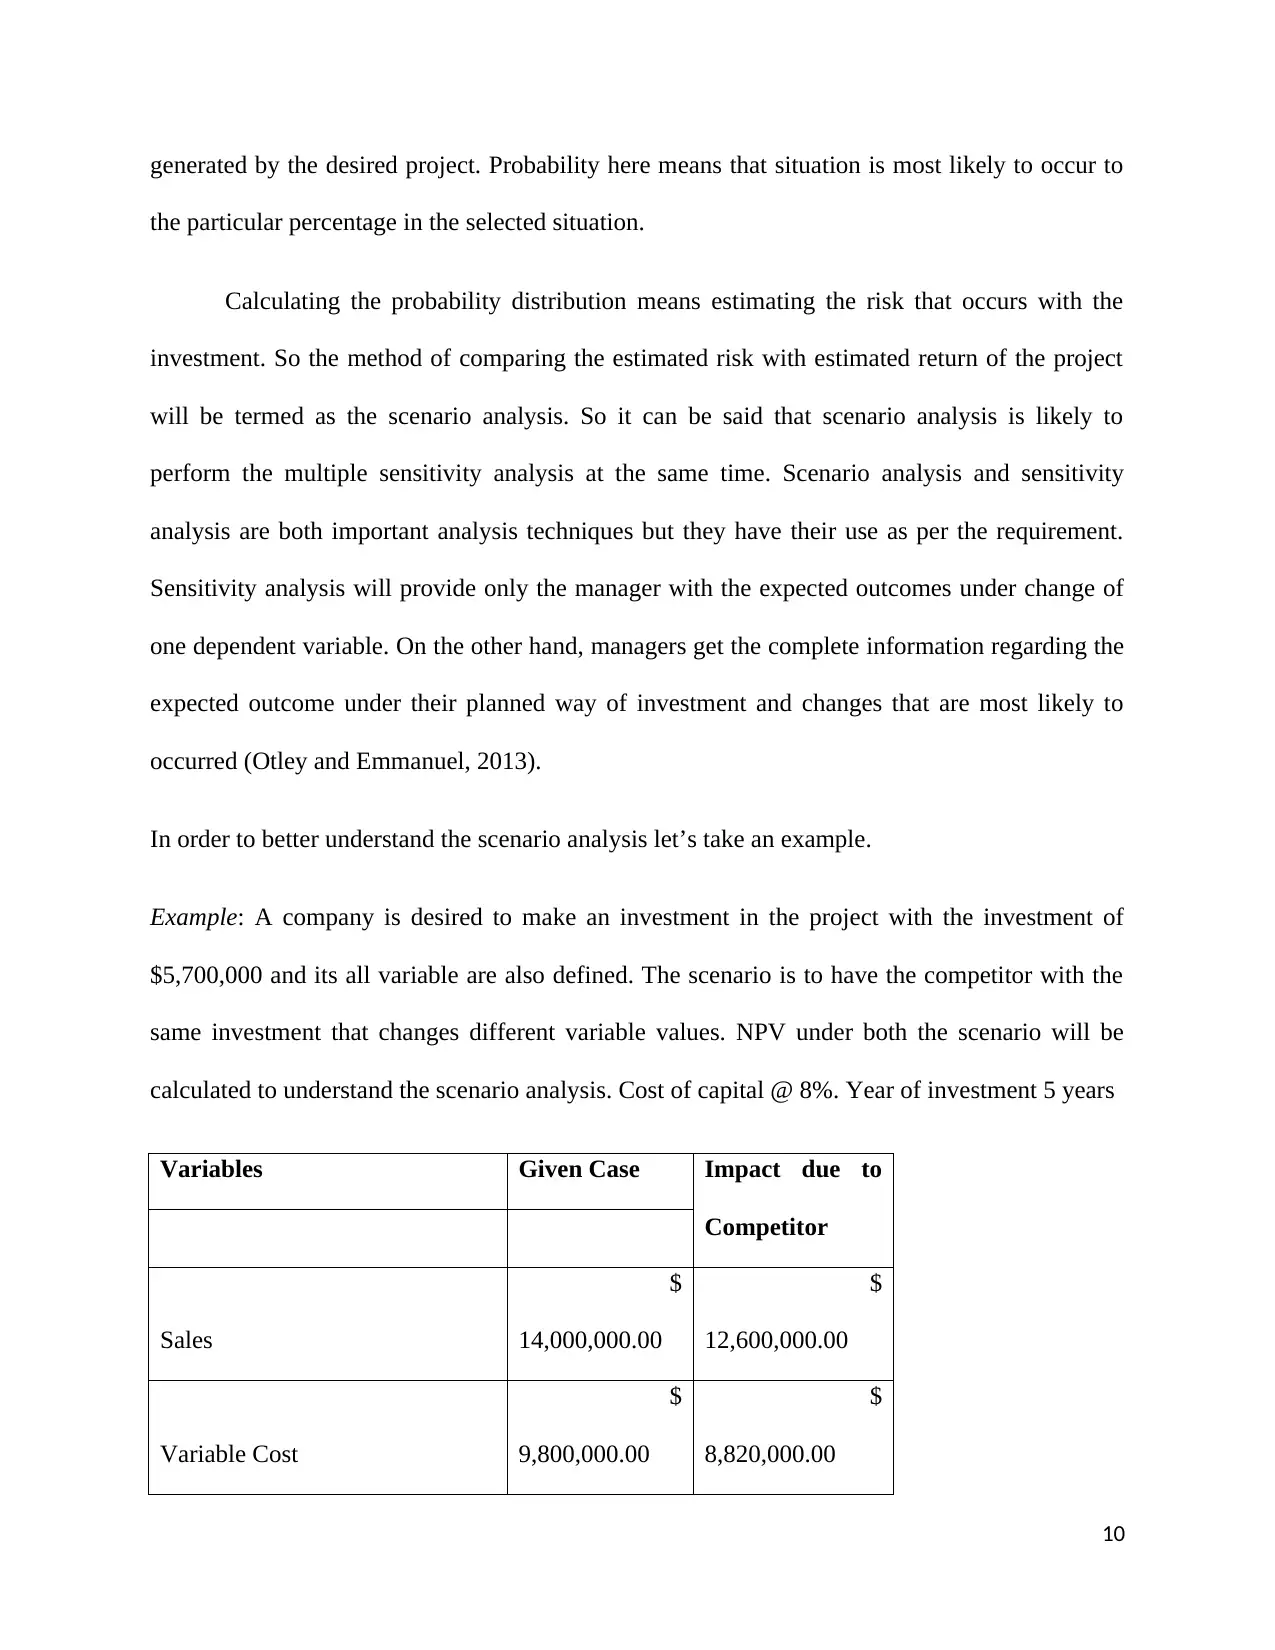
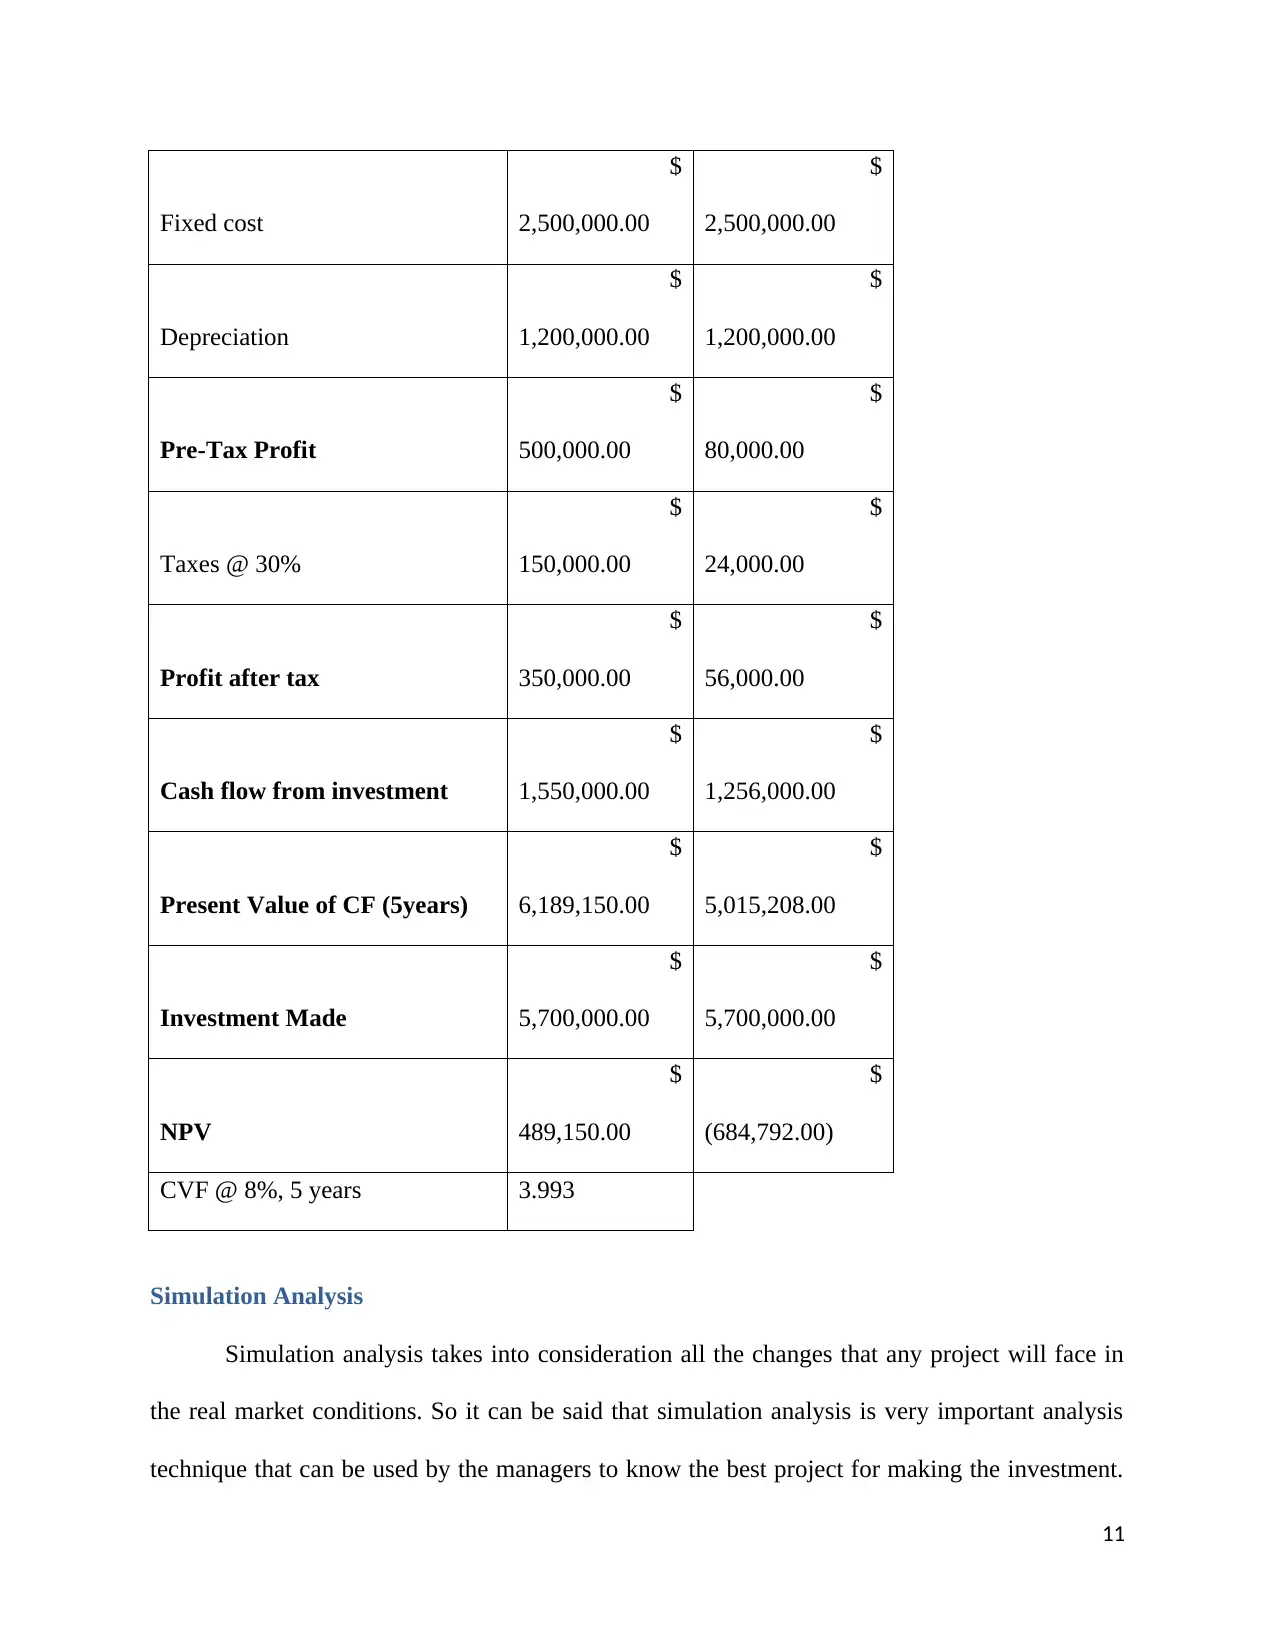
This report provides a comprehensive overview of capital budgeting techniques, focusing on Net Present Value (NPV) and Internal Rate of Return (IRR). It explains the core concepts of NPV and IRR, emphasizing their role in evaluating investment projects. The report then delves into various analysis methods, including sensitivity analysis, scenario analysis, simulation analysis, and break-even analysis, detailing their impact on NPV and IRR. Sensitivity analysis is discussed as a method to assess how changes in variables affect project outcomes, while scenario analysis is presented as a tool to evaluate projects under different potential conditions. Simulation analysis, employing the Monte-Carlo method, is highlighted for its ability to consider the interaction of variables and predict project outcomes in real-world market conditions. Finally, the report covers break-even analysis, a crucial concept for understanding the point at which a project neither generates profit nor incurs a loss. The report aims to check impact of management decision making on the capital budgeting process on the basis of various analysis techniques. The report concludes by emphasizing the importance of these analyses in making informed capital budgeting decisions.
Document Page
Capital Budgeting
1
tabler-icon-diamond-filled.svg

Paraphrase This Document

Need a fresh take? Get an instant paraphrase of this document with our AI Paraphraser
Document Page
Contents
Introduction......................................................................................................................................3
Concept of NPV and IRR................................................................................................................3
Discussion of sensitivity analysis and its impact on NPV and IRR................................................5
Scenario Analysis............................................................................................................................9
Simulation Analysis.......................................................................................................................11
Breakeven Analysis.......................................................................................................................12
Conclusion.....................................................................................................................................12
References......................................................................................................................................13
2
Document Page
Introduction
Management of any company has to take many decisions to accomplish various
objectives of the organizations. In this regard manager have to take the capital budgeting
decisions in order to maintain the proper requirement of working capital and also to arrange the
cash for purchasing the fixed assets or to expand the business. Capital budgeting decisions is
truly based on the cost and benefit analysis of the project cost and cash flow generated. There are
many techniques available to evaluate the project but among them two techniques are widely
used namely net present value and internal rate of return (Baker, 2011).
In this report, capital budgeting techniques specifically NPV and IRR will be evaluated in
detail and both these methods are also be judged on various analysis method like sensitivity,
scenario, break-even and simulation analysis. The aim of this report is to check impact of
management decision making on the capital budgeting process on the basis of various analysis
techniques. The main focus of the report is on the different analysis techniques and their impact
on NPV and IRR.
Concept of NPV and IRR
It is important to understand the concept underlined in the NPV and IRR so that it will be
easy to understand the sensitivity analysis and other analysis methods too. In every evaluation
project there is requirement of future cash flows and also the investment made. Investment can
be made at initial stage also at any stage later to initial stage such as working capital. Future cash
flows are totally dependent on the expected revenue and cost incurred to earn that revenue. So it
can be said that expected cash flows works on the simple function of volume of sales made and
3
Document Page
selling price at which it is sold. Also, the volume totally depends upon the market size and
market share own by the company. Until know, it can be said that there are many factors like
sales volume, market size, unit sale price that can impact the expected cash flows of any project.
Other than this there is cost that can impact the cash flows of the project. Cost of any project can
include initial cost of starting project (Depreciation mainly), variable cost (occurs according to
sales made) and fixed cost (will continue to occur despite of change in volume). NPV and IRR
are totally based on the after tax cash flows and discount rate at which present value has been
calculated. It can be said that value of NPV and IRR is totally dependent on the variable that
determine the occurrence of expected cash flows (Moyer, McGuigan and Rao, 2014). In order to
work out the NPV or IRR, and impact of sensitivity in any project, we can calculate the
difference by taking different situation. It can be done by taking the three different situations,
which can be pessimistic, expected and optimistic. NPV and IRR should be calculated using the
different value under each of these situations. The method of calculating the NPV and IRR under
different situations is referred to as sensitivity analysis (Weygandt, Kimmel and Kieso, 2009).
NPV or Net present value refers to the difference of present value of cash inflows less
present values of cash outflows. Present value of cash flows is being calculated using the time
series method. NPV shows how much value the project will provide to the business if that
project in selected. Positive value of NPV means that project will add some value to the
company profit and negative amount reflects there is loss to company if that project is being
chosen (Baker, 2011).
Formula of NPV: Net present value of cash inflow less present value of cash outflows
4
tabler-icon-diamond-filled.svg

Paraphrase This Document

Need a fresh take? Get an instant paraphrase of this document with our AI Paraphraser
Document Page
IRR means internal rate of return that is used to calculate the rate at which the project
will generate the cash inflow for the company. In easy language it can be said that IRR refers to
that rate on which project provide return to the company. It is greater than the required rate of
return or cost of capital or discounted rate, the project must be selected, otherwise it should be
rejected. In finance terms, IRR can be defined as effective compounded rate of return (Annually)
that project provides on the total investment made. It is also regarded as yield on the respective
investment project (Moyer, McGuigan and Rao, 2014).
Formula to calculate the IRR: R (L) + NPV (L)*[R (H)-R (L)] / [NPV (L)-NPV (H)]
Where: R (L) = Lower discount rate selected
R (H) = Higher Discount rate selected
NPV (L) = Net present value at lower discount rate
NPV (H) = Net present value at higher discount rate
Discussion of sensitivity analysis and its impact on NPV and IRR
Sensitivity analysis refers important technique used to evaluate the project under different
conditions. It is technique used to calculate how the various values of the independent variable
react to the given dependent variable in the given set of assumptions. So it can be said that
sensitivity analysis helps in determining manager that how the project will react in various
situations that will that come at any time in near future. Sensitivity analysis can be carried out
through changing the assumptions made or estimation taken in the project.
5
Document Page
Sensitivity analysis aims to note the change in project NPV or IRR due to change in any
one variable. Sensitivity indicates the change in NPV and IRR because of change in variable.
There are three main steps that have to be followed to carry out the sensitivity analyses are as
given under:
Detection of all such variables that impact the NPV or IRR of the project
Relation between the variables so that NPV and IRR under different scenario can be
calculated (Smit, 2007)
To evaluate the impact that each variable brings to NPV or IRR due to its change
It is important to understand the sensitivity analyses by using the example. In order to
take the example there is need to chose the three situation i.e. pessimistic, current and optimistic
situation. NPV or IRR can change with change in volume, cost or any other variable (Baker,
2011).
A sensitivity analysis has been analyzed with NPV through taking three different situations.
Possible outcomes of cash flows and other variables under different situations
Variables Pessimistic Expected Optimistic
Initial Investment
$
10,000.00
$
10,000.00
$
10,000.00
Cash Inflows (Sales) (PV)
$
28,000.00
$
32,000.00
$
36,000.00
Expenditures or cash outflows (PV)
$
12,000.00
$
12,000.00
$
12,000.00
Fixed cost (PV) $ $ $
6
Document Page
4,000.00 4,000.00 4,000.00
PV = Present Value
NPV under different Situation
Changing the cash inflows Pessimistic Expected Optimistic
Net Present Value $ 2,000.00 $ 6,000.00 $ 10,000.00
Pessimistic Expected Optimistic
$-
$1,000.00
$2,000.00
$3,000.00
$4,000.00
$5,000.00
$6,000.00
$7,000.00
$8,000.00
$9,000.00
$10,000.00
Sensitivity Analysis (Change in Cash Inflows)
Net Present Value
Possible outcomes of cash flows and other variables under different situations
Variables Pessimistic Expected Optimistic
Initial Investment
$
15,000.00
$
10,000.00
$
5,000.00
Cash Inflows (Sales) (PV) $ $ $
7
tabler-icon-diamond-filled.svg

Paraphrase This Document

Need a fresh take? Get an instant paraphrase of this document with our AI Paraphraser
Document Page
32,000.00 32,000.00 32,000.00
Expenditures or cash outflows
(PV)
$
12,000.00
$
12,000.00
$
12,000.00
Fixed cost (PV)
$
4,000.00
$
4,000.00
$
4,000.00
NPV under different Situation
Changing the initial
investment Pessimistic Expected Optimistic
Net Present Value
$
1,000.00
$
6,000.00
$
11,000.00
8
Document Page
Pessimistic Expected Optimistic
$-
$2,000.00
$4,000.00
$6,000.00
$8,000.00
$10,000.00
$12,000.00
Sensitivity Analysis (Change in Initial
Investment)
Net Present Value
From the above analysis it can be said that there is change in value of NPV with the small
change in value of any variable in the entire three scenarios. So it can be said that NPV and IRR
are most likely to change with the change in scenario (Smit, 2007).
Scenario Analysis
Scenario analysis is somewhat similar to the sensitivity analysis but it takes many
changes to the situation to carry out the change in value of NPV and IRR. Scenario analysis as
the name means tell the expected value of proposed project under different scenario. The change
in value of NPV and IRR is totally dependent upon the change in variables but it is very
important to check the probability of occurrence of each event so that correct estimation of real
NPV or IRR can be made. So creating the various situations that are likely to be occur and
combining them with their probability of occurrence, will provide the better estimation of value
9
Document Page
generated by the desired project. Probability here means that situation is most likely to occur to
the particular percentage in the selected situation.
Calculating the probability distribution means estimating the risk that occurs with the
investment. So the method of comparing the estimated risk with estimated return of the project
will be termed as the scenario analysis. So it can be said that scenario analysis is likely to
perform the multiple sensitivity analysis at the same time. Scenario analysis and sensitivity
analysis are both important analysis techniques but they have their use as per the requirement.
Sensitivity analysis will provide only the manager with the expected outcomes under change of
one dependent variable. On the other hand, managers get the complete information regarding the
expected outcome under their planned way of investment and changes that are most likely to
occurred (Otley and Emmanuel, 2013).
In order to better understand the scenario analysis let’s take an example.
Example: A company is desired to make an investment in the project with the investment of
$5,700,000 and its all variable are also defined. The scenario is to have the competitor with the
same investment that changes different variable values. NPV under both the scenario will be
calculated to understand the scenario analysis. Cost of capital @ 8%. Year of investment 5 years
Variables Given Case Impact due to
Competitor
Sales
$
14,000,000.00
$
12,600,000.00
Variable Cost
$
9,800,000.00
$
8,820,000.00
10
tabler-icon-diamond-filled.svg

Paraphrase This Document

Need a fresh take? Get an instant paraphrase of this document with our AI Paraphraser
Document Page
Fixed cost
$
2,500,000.00
$
2,500,000.00
Depreciation
$
1,200,000.00
$
1,200,000.00
Pre-Tax Profit
$
500,000.00
$
80,000.00
Taxes @ 30%
$
150,000.00
$
24,000.00
Profit after tax
$
350,000.00
$
56,000.00
Cash flow from investment
$
1,550,000.00
$
1,256,000.00
Present Value of CF (5years)
$
6,189,150.00
$
5,015,208.00
Investment Made
$
5,700,000.00
$
5,700,000.00
NPV
$
489,150.00
$
(684,792.00)
CVF @ 8%, 5 years 3.993
Simulation Analysis
Simulation analysis takes into consideration all the changes that any project will face in
the real market conditions. So it can be said that simulation analysis is very important analysis
technique that can be used by the managers to know the best project for making the investment.
11
Document Page
As it is explained above the sensitivity analysis and scenario analysis are beneficial to predict the
uncertainly associated with the project but it is essential to consider the interaction or
interrelation of the variables so that proper risk can be measured. The future of any project is not
certain due to changes made by the factors like competition, government interference, climate
change, geographical disturbance and technological development. So it is important to consider
the impact of all these changes while making the choice of best project (Moyer, McGuigan and
Rao, 2014).
This method is purely based of real time situation and uses computer based model to
predict the changes in the expected outcomes of the project. The method used under this analysis
is known as Monte-Carlo Simulation Method. Under this process computer generates the random
variable of each of variable and table is prepared for each set of random numbers. This process is
carried out lot of time in order to predict the NPV and IRR of the project (Smit, 2007).
Breakeven Analysis
Breakeven analysis is the point where project provides no return or zero return on the
investment made. So it can be said that it is situation where there is no loss and no profit on the
project. It is situation where NPV comes to be zero and IRR comes equal to cost of capital. There
is huge competition in the market and it is uneasy to survive in the hostile conditions. It is
essential for the companies to reach the breakeven to remain stable in the market. In the
breakeven situation, company is likely to achieve the variable expenses but unable to recover the
fixed expenses. So it is important to know the breakeven point of every project so that every
possible step can be taken by company to safe themselves from falling below that point.
12
chevron_up_icon
1 out of 13
circle_padding
hide_on_mobile
zoom_out_icon
[object Object]